Solomon Islands Marine Assessment - Equator Initiative
Solomon Islands Marine Assessment - Equator Initiative
Solomon Islands Marine Assessment - Equator Initiative
- No tags were found...

You also want an ePaper? Increase the reach of your titles
YUMPU automatically turns print PDFs into web optimized ePapers that Google loves.
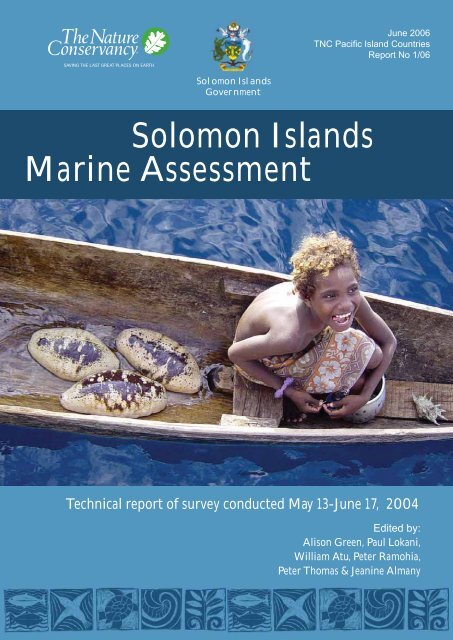
June 2006TNC Pacifi c Island CountriesReport No 1/06<strong>Solomon</strong> <strong>Islands</strong>Government<strong>Solomon</strong> <strong>Islands</strong><strong>Marine</strong> <strong>Assessment</strong>Technical report of survey conducted May 13-June 17, 2004Edited by:Alison Green, Paul Lokani,William Atu, Peter Ramohia,Peter Thomas & Jeanine Almany1
June 2006TNC Pacifi c Island CountriesReport No 1/06<strong>Solomon</strong> <strong>Islands</strong>Government<strong>Solomon</strong> <strong>Islands</strong><strong>Marine</strong> <strong>Assessment</strong>Technical report of survey conducted May 13-June 17, 2004Edited by:Alison Green, Paul Lokani,William Atu, Peter Ramohia,Peter Thomas & Jeanine Almanyi
Published by: The Nature Conservancy, Indo-Pacific Resource CentreContact Details:Alison Green : The Nature Conservancy, 51 Edmondstone Street, South Brisbane, QLD 4101Australiae-Mail : agreen@tnc.orgWilliam Atu : The Nature Conservancy, PO BOX 759, Honiara, <strong>Solomon</strong> <strong>Islands</strong>e-Mail : tncdpm@solomon.com.sbSuggested Citation:Green, A., P. Lokani, W. Atu, P. Ramohia, P. Thomas and J. Almany (eds.) 2006. <strong>Solomon</strong><strong>Islands</strong> <strong>Marine</strong> <strong>Assessment</strong>: Technical report of survey conducted May 13 to June 17, 2004.TNC Pacific Island Countries Report No. 1/06.© 2006, The Nature ConservancyAll Rights Reserved.Reproduction for any purpose is prohibited without prior permission.Design: Jeanine AlmanyArtwork: Nuovo DesignMaps: Stuart Sheppard & Jeanine AlmanyCover Photo: © Louise Goggin, CRC Reef Research CentreAvailable from:Indo-Pacific Resource CentreThe Nature Conservancy51 Edmondstone StreetSouth Brisbane, QLD 4101AustraliaOr via the worldwide web at: www.conserveonline.orgii
Supported by:David and LucilePackard FoundationJohn D and Catherine TMacArthur FoundationMarisla FoundationTriggerfishImages
ForewordThe <strong>Solomon</strong> <strong>Islands</strong> is a young country striving to overcome the destabilising social andeconomic impacts of the recent civil unrest and provide a future of hope for our people based onsound, sustainable economic development and the protection of our distinct and unique naturalheritage, cultural traditions and social values. We are a country where over 85 % of our peoplestill live in rural communities. The recent troubles showed us just how heavily we rely on cleanrivers and streams to provide us with life giving water, on the land for our gardens, on healthyforests for many resources, and the sea, coral reefs and mangroves for our daily sustenance. It isalso true that for many of our communities these same natural resources are our only source ofcash income to pay for the necessities of life such as school fees, fuel and trade goods.Because we are still so heavily reliant on our environment it is vital that we work together tosustainably and wisely manage our biological and natural resources. This is not a new conceptto us. <strong>Solomon</strong> Islanders have been successfully practising conservation since our forebears firstarrived in our beautiful islands many generations ago. Indeed, many of our cultural traditionsand Christian beliefs have their very origin in the conservation of our environment as do ourtraditional systems of resource use rights. However, in recent times population growth and theinfluence of the cash economy has made an impact on our society resulting in dramaticallyincreased pressures on all our natural resources.The establishment of conservation areas is an important way of helping to safeguard our naturalresources so that they can continue to meet our material and cultural needs and help us and ourchildren flourish as a society. In this regard the <strong>Solomon</strong> <strong>Islands</strong> <strong>Marine</strong> <strong>Assessment</strong> will beinvaluable to helping us plan the future sustainable use of our marine resources. This firstnational marine survey is a scientific milestone in our history and provides us with vitalinformation on the state of our marine environment and a baseline against which we canmeasure change over time. More importantly, it will help many coastal communities to establishcommunity based conservation areas to protect important fish breeding grounds and reefs.The survey was remarkable in that it was also a fully co-operative project between the <strong>Solomon</strong><strong>Islands</strong> Government which provided logistical support and scientific and technical expertise,local communities which freely gave their permission for the survey team to visit their reefs andinternational conservation groups which provided scientific expertise, planning and funding.On behalf of the people of the <strong>Solomon</strong> <strong>Islands</strong> I would like to thank all those involved inbringing this important project to a successful conclusion. In many ways this report is thebeginning of the hard work not the end and I would urge that we all commit to working incontinued partnership to sustain the future of the <strong>Solomon</strong> <strong>Islands</strong>.Sir Allan KemakezaOffice of the Prime Ministeriii
AcknowledgementsThe survey was a cooperative project between The Nature Conservancy, <strong>Solomon</strong> <strong>Islands</strong>National and Provincial Government Departments and non-government conservation agenciesincluding World Wide Fund for Nature (WWF), Conservation International (CI), WildlifeConservation Society (WCS), Australian research organisations (Australian Institute of <strong>Marine</strong>Science (AIMS), CRC Reef Research Centre, Queensland Dept Primary Industries & Fisheries(QDPI&F), APEX Environmental Pty Ltd) and Triggerfish Images.The success of this survey hinged on the support and interest of the tribal chiefs, church leaders,local NGOs, elders, men, women and children of the villages and communities that we havevisited from May 13- June 17. We thank them all and would like to say, Barava Tagio Tumas.Your kind assistance in helping us to carry out this survey on your reefs has been instrumentalto its success. It is hoped that the results of the marine assessment will be used to help ensurethe sustainability of the marine resources of the <strong>Solomon</strong> <strong>Islands</strong>, while also raising globalawareness on the uniqueness and importance of <strong>Solomon</strong> <strong>Islands</strong> reefs, some of the last greatreef ecosystems on earth.This survey was supported by the David and Lucile Packard Foundation, Marisla Foundation,the John D. and Catherine T. MacArthur Foundation and the MV FeBrina of Walindi PlantationDive Cruises.iv
ContentsForeword ...................................................................................................................................................iiiAcknowledgements.............................................................................................................................ivExecutive Summary .............................................................................................................................viConservation & Management Recommendations..........................................................ixOverview 1Conservation Context ............................................................................................................................3<strong>Solomon</strong> <strong>Islands</strong> <strong>Marine</strong> <strong>Assessment</strong>................................................................................................8Partner and Community Liaison ........................................................................................................16Communications......................................................................................................................................22Technical Reports 35Chapter 1: Coral Diversity ....................................................................................................................35Chapter 2: Coral Communities & Reef Health..............................................................................65Chapter 3: Coral Reef Fish Diversity.................................................................................................111Chapter 4: Benthic Communities.......................................................................................................157Chapter 5: Fisheries Resources: Food and Aquarium Fishes......................................................195Chapter 6: Fisheries Resources: Commercially Important Macroinvertebrates..................329Chapter 7: Seagrasses and Mangroves ...............................................................................................401Chapter 8: Oceanic Cetaceans & Associated Habitats ................................................................445Appendix .....................................................................................................................................................517v
Executive SummaryThe <strong>Solomon</strong> <strong>Islands</strong> <strong>Marine</strong> <strong>Assessment</strong> represents the first broad scale survey of marineresources in the <strong>Solomon</strong> <strong>Islands</strong>. The survey was conducted over a five-week period from May13 to June 17 2004, covering a distance of almost 2000-nm and encompassing seven of the nineprovinces. The survey team comprised an international team of scientists and managers,including some of the world’s experts of coral reefs and associated habitats. The surveyprovided an assessment of the biodiversity and status of coral reefs, seagrass beds, oceaniccetaceans, reef food fish, commercial invertebrates and associated habitats, andrecommendations for their conservation and management.The marine assessment demonstrated that the <strong>Solomon</strong> <strong>Islands</strong> is an area of high conservationvalue where marine diversity is exceptionally high, marine habitats are in good condition, andcurrent threats are low. The diversity of marine life, condition of marine habitats, and theattractiveness of rainforest-dominated islands combine to create coastal settings seldom seen intoday’s over-populated and over-exploited world. However, there is some concern regardingincreasing threats to marine habitats, particularly from fishing and poor land use practices.The <strong>Solomon</strong> <strong>Islands</strong> has one of the highest diversities of corals anywhere in the world. A totalof 494 species were recorded on this survey: 485 known species and nine that were unknown tothe coral experts, which may be new species. This extraordinarily high diversity of coral speciesis the second highest in the world, second only to the Raja Ampat <strong>Islands</strong> of eastern Indonesia.Of the described species, 122 species have their known ranges extended by this study.The survey also confirmed that the <strong>Solomon</strong> <strong>Islands</strong> possess one of the richest concentrations ofreef fishes in the world. A total of 1019 fish species were recorded, of which 786 were observedduring the survey and the rest were found from museum collections. A formula for predictingthe total reef fish fauna indicates that at least 1,159 species can be expected to occur in the<strong>Solomon</strong> <strong>Islands</strong>. Forty-seven new distributional records were obtained, including at least onenew species of cardinalfish. The number of species visually surveyed at each site ranged from100 to 279, with an average of 184.7. Two hundred or more species per site is considered thebenchmark for an excellent fish count, and this figure was achieved at 37 percent of the sites inthe <strong>Solomon</strong> <strong>Islands</strong>. One site (Njari Island, Gizo) was the fourth highest fish count everrecorded for a single dive, surpassed only by three sites in the Raja Ampat <strong>Islands</strong>.Seagrass biodiversity is also high. Ten species of seagrass were identified, which represents80% of the known seagrass species in the Indo-Pacific Region. The most extensive seagrassmeadows were found in Malaita Province, where there were some very large meadows,including one that was more than 1000 hectares in size. Seagrass meadows were associatedwith a high biodiversity of fauna including dugong, fish, sea cucumbers, seastars, algae andcoral. These highly productive seagrass meadows are often located on the fringe of coastalcommunities and support important fisheries and provide extensive nursery areas for juvenilefish.A relatively low species diversity and abundance of cetaceans (whales and dolphins) wasrecorded throughout most of the <strong>Solomon</strong> <strong>Islands</strong> with spinner and spotted dolphins locallyabundant in some areas. Ten species of cetaceans where sighted, including spinner, pantropicalspotted, Risso’s, common bottlenose, Indo-Pacific bottlenose and rough-toothed dolphins, aBryde’s or Sei whale, orca and beaked whales. Sperm whales were also identified acoustically.vi
The Indispensable Strait region and some other narrow, deep passages in the <strong>Solomon</strong> Seaswere tentatively identified as important migratory corridors.This survey has shown that the <strong>Solomon</strong> <strong>Islands</strong> are clearly part of the global centre of marinediversity, known as the Coral Triangle, which also includes parts of the Philippines, Indonesia,Malaysia (Sabah), East Timor and Papua New GuineaFigure 1. The Coral TriangleThe primary reason for this extraordinary biodiversity is the wide range of marine habitats.Virtually every situation is represented from highly protected, silt-laden embayments aroundlarger islands to clear-water oceanic atolls situated well offshore. In some areas, the coastlinesare exceptionally convoluted with many fjord-like embayments, narrow straits and islandclusters, all set in very wide ranges of bathymetry and current regimes. In other areas, thecoastlines are dominated by reefs exposed to high-energy wave action (including barrier reefs ofmany types). Other coastlines have very extensive mangrove forests, seagrass meadows andother soft substrate habitats. There are also vertical walls exposed to currents and dominated bysea fans, sponges and crinoids, and islands with enclosed lagoons with steeply sloping sides andclear deep water. When combined, this array of habitats creates a range of environments seldomseen in other regions of comparable size.Unfortunately it was not possible to include the remote outer islands and reefs in the <strong>Solomon</strong><strong>Islands</strong> (Ontong Java atoll, Rennel Island, Indispensable reefs and Santa Cruz <strong>Islands</strong>) in thissurvey. These areas are geologically, oceanographically and climatologically different from therest of the <strong>Solomon</strong> <strong>Islands</strong>, and are therefore expected to support different coral reefcommunities. The full extent of the biodiversity of the <strong>Solomon</strong> <strong>Islands</strong> will not be understooduntil similar surveys have been completed in these areas.A significant component of the survey was an assessment of key fisheries resources, which arevitally important to the livelihood of the <strong>Solomon</strong> Island people. Healthy populations of reeffishes were observed in more remote areas (particularly Choiseul, Isabel and WesternProvinces), although there was some evidence of overfishing in provinces close to majorpopulation centres in Guadalcanal and Malaita. There was also evidence of overfishing of large,vulnerable reef fishes and commercially important invertebrates (particularly trochus, seacucumbers and giant clams) throughout most of the <strong>Solomon</strong> <strong>Islands</strong>. In contrast, these speciesvii
were still abundant in the Arnavon Community <strong>Marine</strong> Conservation Area (ACMCA) wherecommercial fishing and collecting is banned and only subsistence collecting of some reef fishspecies is allowed. These results show that after more than 10 years of protection, the ACMCAhas been successful in achieving its goal of protecting important fisheries species.Finally, reflecting their concern and that of the community representatives who participated inthe survey, the survey team has offered a range of recommendations for the conservation andsustainable use of these globally, nationally and locally important marine habitats and resources.These include specific recommendations for the establishment of networks of locally managedmarine areas, the management of important reef fisheries, the protection of key habitats (coralreefs, seagrasses and mangroves), and the conservation of oceanic cetaceans and associatedhabitats.viii
Conservation & ManagementRecommendationsReflecting their concern and that of the community representatives who participated in thesurvey, the survey team has offered a range of recommendations for the conservation andsustainable use of the globally, nationally and locally important marine habitats and resources inthe <strong>Solomon</strong> <strong>Islands</strong>. These include specific recommendations for the establishment of networksof locally managed marine areas, the management of critically important reef fisheries, theprotection of key habitats (coral reefs, seagrasses and mangroves), and the conservation ofoceanic cetaceans and associated habitats.<strong>Marine</strong> Conservation AreasLocally managed marine conservation areas can play a critical role in protecting biologicaldiversity and marine resources. The key to protecting the biological diversity of the <strong>Solomon</strong><strong>Islands</strong> is to establish a network of marine conservation areas (MCAs) that includesrepresentative examples of the main habitat types (coral reefs, seagrasses and mangroves), withspecial attention to degree of exposure from wind and waves, substrate type, and depth. While itis seldom possible to capture all these characteristics in a single area, there is plenty of scope tocreate an effective network that represents the full range of marine biodiversity in the <strong>Solomon</strong><strong>Islands</strong>. While climate change has not had major impacts on the <strong>Solomon</strong> <strong>Islands</strong> to date, it isalso important that MCA networks are designed to be resilient in the face of change.The Arnavon <strong>Islands</strong> Community <strong>Marine</strong> Conservation Area (ACMCA) is an importantcommunity managed marine conservation area and an example of what can be achieved inmarine conservation in the <strong>Solomon</strong> <strong>Islands</strong>. Although originally established to protect animportant sea turtle-nesting area, the ACMCA also harbours impressive coral reef and fishcommunities and due to its high biodiversity status and the excellent condition of the reefs, theArnavon <strong>Islands</strong> is a high priority to remain as a MCA in the <strong>Solomon</strong> <strong>Islands</strong>.<strong>Marine</strong> Conservation Areas like the Arnavon <strong>Islands</strong> play an important role in maintaining andenhancing marine resources on which the people of the <strong>Solomon</strong> <strong>Islands</strong> depend. The ACMCAprovides an excellent example of how local communities can work together to protect theirmarine resources. Since local communities have traditional user rights in all the reef and coastalsea areas, community managed MCAs are a key strategy for marine resource management in the<strong>Solomon</strong> <strong>Islands</strong>. While these MCAs are often small in size, they can be successful inprotecting marine resources if they are strategically incorporated as part of a larger scalenetwork of MCAs. A number of these small MCAs have already been established bycommunities in Marau Sound, Ngella, Marovo Lagoon, Tetepare, Roviana Lagoon and Gizo(Figure 1). Similar areas should be established for marine resource management in the Shortland<strong>Islands</strong>, Russell <strong>Islands</strong>, Three Sisters <strong>Islands</strong>, Leli Island, Lau Lagoon, Suafa Bay, LangalangaLagoon, Are’Are Lagoon and small Malaita, Northern Isabel and Northern Choiseul. Althoughthese areas would be managed by the communities themselves, government and partner NGOsupport would be essential. Both the national and provincial governments through relevantdepartment(s) with community and clan support, should take appropriate steps to legalise theselocally managed marine areas as provided for under provisions of the Fisheries Act 1998. Underthis Act, the responsibility for coastal and inshore fisheries is vested in the provinces. This alsoincludes the power to prepare ordinances for the establishment and protection of marinereserves.ix
xFigure 1. Priority sites for <strong>Marine</strong> Conservation Areas identified during the <strong>Solomon</strong> <strong>Islands</strong> <strong>Marine</strong> <strong>Assessment</strong>.
Other areas that the survey team believe would make good choices for MCAs to protectbiodiversity would include (Figure 1) (by Province):Choiseul Province• The fjord-like coastline on the south coast of Choiseul Island is an area of great interestfrom an ecological and biodiversity perspective.Isabel Province• The general area around Kia Village (north-western Isabel) provides an excellentvariety of well-flushed sheltered reef habitats and extensive mangrove environment. Itis perhaps the best example of this sort of habitat in the entire <strong>Solomon</strong>s. Themangrove-reef habitat is vital for many commercial species, such as snappers andNapoleon Wrasse. Therefore its inclusion in any protected area network is essential.• The fjord-like coastline on southern Isabel is also an area of great interest.Western Province• Njari Island (near Gizo) is a world-class diving site and a prime location for a MCA.This is an area of very high diversity, strong currents and good flushing, steep outerreef dropoff, and a sheltered reef near shore interspersed with areas of clean-sand. Theisland is uninhabited. Coral reef fish diversity is extremely high – the highest recordedin the <strong>Solomon</strong> <strong>Islands</strong> and one of the highest recorded in the world.• The Shortland <strong>Islands</strong> is also an area of great interest, where biodiversity is high, andreefs are in good condition. One good candidate would be Haliuna Bay and vicinity(Fauro Island). This area supports a very diverse fish community despite its shelteredposition. There is a good cross section of habitat within the bay including mangroves,seagrass beds, shallow reef flat, rich coral areas, and an abrupt slope to relatively deepwater. The bay is uninhabited and the surrounding mountainous slopes provide aspectacular setting. There would also be scope at this location to encompass the moreexposed marine habitats, including the outer reef environment, that lie just outside thebay.Central Province• The Russell <strong>Islands</strong> provide the best opportunity for a MCA in Central Province, sincebiodiversity is relatively high, there is a range of habitat types, and the reefs are in goodcondition.Guadalcanal Province• Marau Sound is an extensive, picturesque lagoonal system at the southern tip ofGuadalcanal with great conservation potential. There is an excellent variety of reefhabitats from sheltered bays to exposed outer reefs. Of special interest are thenumerous, variable-sized islands scattered across the sound. The human population isrelatively sparse and the local community has experience with conservation andmanagement projects, since it is the site of a giant clam grow-out experiment.xi
Malaita Province• Lau’alo Passage and Maana’oba Island (northeast Malaita) with its extensive shallowreef areas and reticulate channels, seagrass meadows and artificial reef island villages,is an area of great ecological and cultural value, and potential conservation interest.The artificial reef island villages in this area reflect a unique culture in Malaita, and theinhabitants’ livelihood is strongly linked with the reef and its resources. The passage tothe harbour was not surveyed, but it is likely to support unique coral community types.This was also an area of extremely large seagrass beds, perhaps the largest in the<strong>Solomon</strong> <strong>Islands</strong>. This area may prove to be one of the most special areas in the<strong>Solomon</strong> <strong>Islands</strong>.• Leli Island (north-eastern coast of Malaita) has a unique “half-atoll” structure featuringa well-sheltered lagoon with mangroves and fringing reef, and a very interestingcomplex of outer reefs offering all degrees of exposure. Water clarity on outer reefdives is excellent. The island does not appear to support a permanent humanpopulation, only sporadic fishing camps.Makira Province• The west coast of Makira was one of the most scenic areas visited during the survey,and the Makira Harbour area in particular appears to have excellent potential as aMCA. There is an extensive network of highly sheltered bays as well as ample outerreef habitat.• The Three Sisters <strong>Islands</strong> also have excellent potential, providing a prime example ofan offshore island system with minimal terrestrial influence and a very sparse humanpopulation. Some of the best underwater conditions were encountered off MalaupainaIsland, including excellent visibility and high biodiversity. Malaupaina also has anextensive shallow lagoon that is almost entirely land-locked.Two key areas of the <strong>Solomon</strong> <strong>Islands</strong> were not surveyed during this survey: Rennell Island andOntong Java Atoll. These areas possess special environmental features and need to be assessed inthe future. It would appear that both areas would feature prominently within a national network ofMCAs.Fisheries ManagementThe results of this survey indicate that overfishing of marine resources may already be occurring insome provinces. While overfishing is a concern for coral reef fish resources in some provinces, thesituation is even more serious for some species of commercially important invertebrates. Given therapidly rising population in the <strong>Solomon</strong> <strong>Islands</strong>, this problem is likely to become more serious andwidespread in the future.Because of the importance of these resources to the livelihood of the <strong>Solomon</strong> Island people, it isvery important that they are managed to ensure their long term sustainability. As the country’spopulation increases, the reliance on reef fish resources is also expected to increase. In light of thisscenario, the government is strongly urged to undertake appropriate measures to safeguard its coralreef resources.xii
Coral Reef FishesWe recommend that the National Government consider the following management actions to ensurethe long term sustainability of coral reef fishes:• Ban the use of highly efficient and destructive fishing methods, particularly gillnets andnight spear fishing;• Undertake a nationwide education and awareness program to help fishermen understand theimportance of conservation and management of fisheries resources, and the importanthabitats these resources depend on for their well being;• Implement an education and awareness program on blast fishing targeted towards ensuringthat young people understand the effect of these methods on marine resources and theirhabitats, and that this activity is prohibited and penalties apply for breaching the law;• Recruit more enforcement officers to work closely with other law enforcement agencies andrural fishing communities to monitor and enforce fisheries laws and regulations;• Facilitate and support the establishment of <strong>Marine</strong> Conservation Areas in conjunction withlocal communities, to protect key fisheries species (food and aquarium fishes);• Protect large and vulnerable fish species (humphead parrotfish, humphead wrasse and largegroupers) through the protection of fish spawning aggregation sites, and the implementationof the National Management and Development Plan for the Live Reef Food Fish Fishery;• Develop Management and Development Plans for other food fishes and the AquariumIndustry;• Speed-up the appointment and establishment of the Fishery Advisory Council as providedfor under the Fisheries Act 1998, to ensure proper Fisheries Management and DevelopmentPlans are implemented;• Develop alternative offshore fisheries such as deep water snapper fishing, raft fishing fortuna and squid fishing to ease fishing pressure on the inshore resources; and• Establish long term monitoring of key fisheries resources, and their use in subsistence andartisanal fisheries in the <strong>Solomon</strong> <strong>Islands</strong>Commercially Important MacroinvertebratesWe recommend that the National Government consider the following management actions to ensurethe long term sustainability of commercially important invertebrates:• The Fisheries Regulation banning the use of SCUBA and Hookar gear for harvesting ofvaluable invertebrate resources like sea cucumber should be vigorously enforced.• Awareness programs on all Fisheries Regulations should be targeted at rural communities,schools and the public at large. Funding should be sought for radio awareness programs. Ameeting should be held with each Provincial Police Commander to discuss with themaspects relating to the enforcement of Fisheries Regulations.• The Department of Fisheries and <strong>Marine</strong> Resources should consider alternativemanagement options for the sea cucumber and Trochus fisheries in the <strong>Solomon</strong> <strong>Islands</strong>. Anumber of options are suggested:1) Limiting the number of export permits;2) Setting annual export quotas for these resources; and3) Setting size limits for sea cucumbers species (wet and dry size limits)xiii
• The Department of Fisheries and <strong>Marine</strong> Resources should impose a total protection of thespecies greensnail (Turbo marmoratus) through a Fisheries Regulation. A reseedingprogram should be initiated to rebuild this almost extinct population.• The Department of Fisheries and <strong>Marine</strong> Resources should consider utilising existingstructures like Fisheries Centres and Extension arrangements already in place to improvecollection of harvest data (species and location) and awareness for fisheries in rural areas.• The collection of live coral for lime production may pose a serious threat to reefs in somelocations, and should be investigated and managed.Addressing Land Based ThreatsOne of the major threats to inshore marine habitats in the <strong>Solomon</strong> <strong>Islands</strong>, particularly seagrassesand coral reefs, is poor land use practices associated with large scale logging and agriculturalpractices. This is a serious issue that will need to be addressed through appropriate environmentalguidelines to fully protect marine biodiversity and key resources in the <strong>Solomon</strong> <strong>Islands</strong>.Protection of Seagrasses & Mangrove HabitatsSeagrasses and mangroves provide vitally important habitat for many marine species, includingmany species of fish and invertebrates that are important in local fisheries. Recommendations forthe conservation and management of seagrasses and mangroves in the <strong>Solomon</strong> <strong>Islands</strong> include:• Promoting seagrass and mangrove conservation as they have had a low priority inconservation programs in the region. Seagrass and mangrove conservation values need tobe enhanced by development of education resource materials, to be used in schools andcommunity groups;• Establishing more MCAs to ensure that examples of seagrass and mangrove ecosystemsremain in the <strong>Solomon</strong> <strong>Islands</strong> for use by future generations;• Enforcing legislation for the protection of mangrove forests;• Establishing a monitoring program of seagrass and mangrove ecosystem health, linked toexisting region/global monitoring programs (e.g., Seagrass-Watch,www.seagrasswatch.org) for monitoring climate change/sea level rise impact;• Preparing detailed maps of seagrass beds for locations which are highly threatened by poorwater quality (e.g., Marovo Lagoon);• Conducting detailed surveys and studies on dugong/turtle-seagrass distribution based on theknown seagrass habitats identified in this survey; and• Conducting studies on the importance, ecology, and population dynamics of subsistencefisheries (e.g., rabbit fish) which seagrass/mangrove ecosystems support.Conservation of Oceanic Cetaceans & Associated HabitatsThis study represents the first broad scale assessment of oceanic cetaceans and associated habitatsthroughout the main island chain of the <strong>Solomon</strong> <strong>Islands</strong>. However, further studies are still requiredto provide a strong basis for their conservation and management including:xiv
• Identifying important cetacean habitats for protective management, including preferredbreeding, feeding and resting areas, as well as migratory routes and corridors;• Investigating the sustainability of traditional dolphin drives;• Investigating interactions between cetaceans and pelagic fisheries, marine tourism and othercommercial uses (eg captive-dolphin export trade);• Further evaluating the effect of the increased pressure of the Gavutu Captive DolphinFacility on local fish stocks due to the captive dolphin food requirements;• Further studies to address the knowledge gap on the diversity, abundance and distributionof whales and dolphins in <strong>Solomon</strong> <strong>Islands</strong>’ territorial waters, including additional cetaceansurveys and focused research on priority areas and species (particularly commerciallyexploited species and those targeted by traditional fisheries); and• Accessing other available information through short term, cost-effective projects such ascanvassing and consolidating local knowledge, establishing a local cetacean sighting andstranding network, and recording new sightings and human-interactions (fisheries,tourisms).Oceanic cetaceans are wide ranging and it is not possible to support them throughout their entirerange. However, they do have preferred habitats for breeding, feeding, resting, and migrating,which should be identified and protected. While further studies are required to identify and confirmthese areas in the <strong>Solomon</strong> <strong>Islands</strong>, best available information suggests that the following should beregarded as a preliminary shortlist for protection:• North Guadalcanal to the Florida <strong>Islands</strong> (waters and inter-island passages);• New Georgia Group, especially the wider Gizo – Kolombangara – Simbo Isl. Area;• Malaita, especially the waters around Fanalei and Bita ‘Ama (southeast and northwestMalaita respectively);• Shortland <strong>Islands</strong> (Fauro and Shortland Island Groups);• Russell <strong>Islands</strong>;• Southern oceanic waters off New Georgia;• All deep, yet relatively narrow passages separating the main islands of the <strong>Solomon</strong> <strong>Islands</strong>from the South Pacific Ocean or the <strong>Solomon</strong> Sea: Indispensable Strait to Bita ‘Ama, ManningStrait including the Arnavon <strong>Islands</strong>, Iron Bottom Sound, Gizo Strait and Vella Gulf, BlancheChannel, and Bougainville Strait; and• Temotu Province.Other recommendations for the conservation and management of ocean cetaceans and associatedhabitats include:• The national government should seriously consider becoming a member of Convention ofInternational Trade of Endangered Species (CITES) 1 , in order to strengthen themanagement and conservation of the relatively high level of endemic and endangeredspecies (both terrestrial and marine) in the <strong>Solomon</strong> <strong>Islands</strong>.• Preferred cetacean habitats such as migratory corridors should be protected through sitebased management such as their inclusion in MCAs and managing key threats particularlygill and/or drift netting, blast fishing and noise pollution.1 CITES is an internationally recognized mechanism to sustainably manage wildlife trade in endangeredspecies, including cetaceans.xv
• Protecting dolphin resting areas by working with local communities in collaboration withprovincial and national government agencies, and exploring opportunities for dolphin watchtourism in these areas.• Building local capacity to improve local expertise in cetacean monitoring and research bygovernment and NGO personnel, and interested resort dive staff and community groups.• Policy development for marine mammal conservation and management, for both nationaland provincial governments• Broadening environmental awareness of cetaceans and related issues.xvi
June 2006TNC Pacifi c Island CountriesReport No 1/06<strong>Solomon</strong> <strong>Islands</strong>GovernmentOverview3 Conservation ContextPeter Thomas, Paul Lokani & William Atu8 <strong>Solomon</strong> <strong>Islands</strong> <strong>Marine</strong> <strong>Assessment</strong>Alison Green, William Atu & Peter Ramohia16 Partner and Community LiaisonWilliam Atu22 CommunicationsLouise Goggin & Jeanine Almany1
Published by: The Nature Conservancy, Indo-Pacific Resource CentreFirst Author Contact Details:Peter Thomas : pthomas@tnc.orgAlison Green : agreen@tnc.orgWilliam Atu : tncdpm@solomon.com.sbLouise Goggin: Louise.Goggin@csiro.auSuggested Citations:Thomas, P., P. Lokani and W. Atu. 2006. Conservation Context. In: Green, A., P. Lokani, W. Atu, P.Ramohia, P. Thomas and J. Almany (eds.) 2006. <strong>Solomon</strong> <strong>Islands</strong> <strong>Marine</strong> <strong>Assessment</strong>: Technicalreport of survey conducted May 13 to June 17, 2004. TNC Pacific Island Countries Report No. 1/06.Green, A., W. Atu and P. Ramohia. 2006. <strong>Solomon</strong> <strong>Islands</strong> <strong>Marine</strong> <strong>Assessment</strong>. In: Green, A., P.Lokani, W. Atu, P. Ramohia, P. Thomas and J. Almany (eds.) 2006. <strong>Solomon</strong> <strong>Islands</strong> <strong>Marine</strong><strong>Assessment</strong>: Technical report of survey conducted May 13 to June 17, 2004. TNC Pacific IslandCountries Report No. 1/06.Atu, W. 2006. Partner and Community Liaison. In: Green, A., P. Lokani, W. Atu, P. Ramohia, P.Thomas and J. Almany (eds.) 2006. <strong>Solomon</strong> <strong>Islands</strong> <strong>Marine</strong> <strong>Assessment</strong>: Technical report of surveyconducted May 13 to June 17, 2004. TNC Pacific Island Countries Report No. 1/06.Goggin, L. and J. Almany. 2006. Communications. In: Green, A., P. Lokani, W. Atu, P. Ramohia, P.Thomas and J. Almany (eds.) 2006. <strong>Solomon</strong> <strong>Islands</strong> <strong>Marine</strong> <strong>Assessment</strong>: Technical report of surveyconducted May 13 to June 17, 2004. TNC Pacific Island Countries Report No. 1/06.© 2006, The Nature ConservancyAll Rights Reserved.Reproduction for any purpose is prohibited without prior permission.Design: Jeanine AlmanyArtwork: Nuovo DesignMaps: Stuart Sheppard & Jeanine AlmanyCover Photo: ©Emre TurakAvailable from:Indo-Pacific Resource CentreThe Nature Conservancy51 Edmondstone StreetSouth Brisbane, QLD 4101AustraliaOr via the worldwide web at: www.conserveonline.org2
CONSERVATION CONTEXTP ETER T HOMAS, PAUL L OKANI AND W ILLIAM A TUThe Nature ConservancyABOUT THE SOLOMON ISLANDSDotting the South Pacific in a double chain of 922 islands, the <strong>Solomon</strong> <strong>Islands</strong> covers morethan two million square kilometres of ocean, making it one of the largest archipelagos in theworld (Figure 1). In keeping with the nature of island environments, which have evolved inisolation from continental land masses, the <strong>Solomon</strong> <strong>Islands</strong> has many rare and endemicspecies. Although the country has long been known for its diverse and valuable marineresources, the <strong>Solomon</strong> <strong>Islands</strong> <strong>Marine</strong> <strong>Assessment</strong> confirmed that it supports one of theworld’s highest levels of marine diversity.Figure 1. Location of the <strong>Solomon</strong> <strong>Islands</strong>The <strong>Solomon</strong> <strong>Islands</strong> has a population of about 538,000 people, with an annual growth rate of2.8 percent—one of the world’s highest. Eighty-five percent of its people live in rural villagecommunities, most of which are dependant on the sea for their livelihoods. Like otheremerging Pacific Island nations with fast growing populations, the <strong>Solomon</strong> <strong>Islands</strong> is rapidlydepleting its natural resources to obtain food and generate income for basic necessities. Insome areas of the country, valuable marine resources such as beche-de-mer, trochus, and giantclams have been so heavily exploited that they have almost completely disappeared.Commercially valuable coral reef fish species are also beginning to show signs of overfishingin several provinces.Because the people of the <strong>Solomon</strong> <strong>Islands</strong> own more than 95% of the land and havetraditional user rights in all the reef and coastal sea areas, any conservation work must takeinto account the needs of local communities. The Nature Conservancy and other conservationorganisations have collaborated with community and government partners in the <strong>Solomon</strong><strong>Islands</strong> for more than a decade to protect some of the planet’s richest marine ecosystems. In3
<strong>Solomon</strong> <strong>Islands</strong> <strong>Marine</strong> <strong>Assessment</strong> Technical Report1995, the Conservancy helped establish one of the first community-managed marineconservation areas in the South Pacific at the Arnavon <strong>Islands</strong>, a small island group betweenthe main islands of Choiseul and Isabel (Figure 2). The Conservancy and other conservationorganisations are now committed to expanding marine conservation strategies to all areas ofthe <strong>Solomon</strong> <strong>Islands</strong> archipelago, with a long-term goal of helping local communities,provincial and national governments, and other partners establish networks of marineprotected areas to achieve lasting conservation in the <strong>Solomon</strong> <strong>Islands</strong>.SURVEY BACKGROUND AND PARTNERSHIPSDespite the extraordinary natural environment of the <strong>Solomon</strong> <strong>Islands</strong>, there is little scientificinformation regarding its biodiversity, an issue that has limited the effective conservation andmanagement of local resources. At an experts’ planning meeting for the Bismarck-<strong>Solomon</strong>Seas Ecoregion in 2003 led by World Wide Fund for Nature, participants agreed that the<strong>Solomon</strong> <strong>Islands</strong> was an area of extreme data deficiency and that a marine assessment of thearea should be of highest priority. To help address this issue The Nature Conservancycollaborated with community, government, and non-government partners to organize the firstcomprehensive scientific survey of the <strong>Solomon</strong> <strong>Islands</strong>’ marine environment. Conductedfrom May 13 to June 17 2004, and led by the Conservancy’s Dr. Alison Green, the <strong>Solomon</strong><strong>Islands</strong> <strong>Marine</strong> <strong>Assessment</strong> focused on the islands of the seven main provinces in the<strong>Solomon</strong> Island chain—Isabel, Choiseul, Western, Central, Guadalcanal, Malaita and Makira(San Cristobal) (Figure 2). The goal of the survey was to gather critical data on thebiodiversity and status of marine ecosystems in the <strong>Solomon</strong> <strong>Islands</strong>.Figure 2. <strong>Solomon</strong> Island ProvincesTo ensure support from local and provincial governments and the many village communities,the survey team also conducted a series of community liaison activities before, during, andafter the survey (see Partner and Community Liaison this report).4
Overview: Conservation ContextA critical factor in the success of the survey was the decision by <strong>Solomon</strong> Island NGOs andGovernment agency representatives to establish the <strong>Solomon</strong> <strong>Islands</strong> <strong>Marine</strong> <strong>Assessment</strong>Coordinating Committee (SIMACC). SIMACC was comprised of:• Government Partners: Department of Forestry, Environment and Conservation;Department of Fisheries and <strong>Marine</strong> Resources; Department of National Reform andPlanning; and the Visitors Bureau.• Local NGOs: Environmental Concern Action Network of <strong>Solomon</strong> <strong>Islands</strong>; andFoundations of South Pacific International.• International NGOs: Worldwide Fund for Nature; International Waters Program; andThe Nature Conservancy.At their first official meeting, members of SIMACC unanimously agreed that the survey wasof critical importance for future marine conservation and sustainable resource management.Expectations were discussed and the role that each member would take to ensure its successwas agreed on. Subsequently, the SIMACC and its members were responsible for thesuccessful co-ordination of the in-country logistics for the survey.The committee also endorsed The Nature Conservancy to lead the survey as the organizationin the strongest position to co-ordinate logistic, scientific, and financial support for theexpedition. Other partners included Conservation International, the Wildlife ConservationSociety, the Australian Institute of <strong>Marine</strong> Science, CRC Reef Research Centre, QueenslandDepartment of Primary Industries and Fisheries, APEX Environmental, and TriggerfishImages. Funding support was provided by the David and Lucile Packard Foundation, MarislaFoundation, the John D. and Catherine T. MacArthur Foundation, and The NatureConservancy.CAPACITY BUILDINGAll partners agreed that the marine survey represented a unique opportunity to help build theskills and scientific knowledge of local marine scientists and managers in the <strong>Solomon</strong><strong>Islands</strong>. Eight out of 17 positions on the survey team were assigned to <strong>Solomon</strong> Islanders,who were nominated for the survey based on recommendations from the SIMACC.Subsequently, these participants were engaged in all aspects of the survey, from planning andlogistics to field surveys and report writing. They worked alongside recognized scientificexperts with decades of experience conducting marine surveys in an atmosphere thatencouraged learning and long-term mentoring relationships. This hands-on, one on one skillbuildingstrengthened the ability of local scientists to conduct surveys and undertake followup monitoring independently in the future. In turn, The <strong>Solomon</strong> Island participantscontributed their extensive knowledge and understanding of the local environment, whichthey shared with the scientific experts.CONSERVATION FOR THE FUTUREThe survey showed that the mega-diversity area of the Indo-Pacific region known as the CoralTriangle extends to and embraces the <strong>Solomon</strong> <strong>Islands</strong> (Figure 3). This knowledge willenable marine scientists to create a blueprint for conservation in the <strong>Solomon</strong> <strong>Islands</strong> thattakes into account the Coral Triangle and its associated marine ecosystems. Based oninformation gathered during the assessment, the survey partners are now working on5
<strong>Solomon</strong> <strong>Islands</strong> <strong>Marine</strong> <strong>Assessment</strong> Technical Reportestablishing a network of marine protected areas in the <strong>Solomon</strong> <strong>Islands</strong> that links to otherhigh-biodiversity sites in the Coral Triangle.Perhaps most importantly, the marine survey showed that the <strong>Solomon</strong> <strong>Islands</strong> has one of thehighest levels of marine biodiversity in the world. This realisation provides a newopportunity for the <strong>Solomon</strong> <strong>Islands</strong> in terms of its importance on a global scale and its abilityto attract support for conservation.Figure 3. The Coral Triangle (Green and Mous 2006)Building on their success with the in country co-ordination of the survey, SIMACC membershave decided to evolve their organisation into the Conservation Council for the <strong>Solomon</strong><strong>Islands</strong> (CCOSI). This group meets regularly to discuss issues of national importance andwork together to influence conservation at a broader scale. Importantly, in terms of the futureof conservation in the <strong>Solomon</strong> <strong>Islands</strong>, the CCOSI is now is acting as a catalyst toreinvigorate the process to develop a National Biodiversity Strategic Action Plan (NBSAP)for the <strong>Solomon</strong> <strong>Islands</strong>. The NBSAP is critical for developing conservation policy and actionat the national level and for linking the <strong>Solomon</strong> <strong>Islands</strong> to the International Convention onBiological Diversity and associated international funding opportunities. The neworganisation will also provide co-ordination, continuity and support as the survey partnersbegin applying its results to on-the-ground conservation work in the <strong>Solomon</strong> <strong>Islands</strong>.The <strong>Solomon</strong> <strong>Islands</strong> <strong>Marine</strong> <strong>Assessment</strong> also provided a scientific basis for the NationalGovernment to reassess the status of beche de mer stocks in the <strong>Solomon</strong> <strong>Islands</strong>, leading to amoratorium on this fishery (particularly the commercial export of all beche de mer products)introduced in December 2005. While this moratorium is in place, the National Government isin the process of developing a Management and Development Plan for this fishery. The<strong>Solomon</strong> <strong>Islands</strong> <strong>Marine</strong> <strong>Assessment</strong> has also helped provide a scientific basis for theNational Government to review the status of other key fisheries species, including food andaquarium fishes. These results will be used as the basis for reassessing management6
Overview: Conservation Contextarrangements for these fisheries, particularly the use of highly efficient and destructive fishingmethods.These outcomes demonstrate that the <strong>Solomon</strong> <strong>Islands</strong> <strong>Marine</strong> <strong>Assessment</strong> has provided astrong basis for the future of marine conservation in the <strong>Solomon</strong> <strong>Islands</strong>.REFERENCESGreen A.L. & Mous P.J. 2006. Delineating the Coral Triangle, its ecoregions and functionalseascapes. Report based on an expert workshop, held at the TNC Coral TriangleCenter (April - May 2003), Bali, Indonesia, and on expert consultations held in June –August 2005. Version 3.1 (February 2006). Report from The Nature Conservancy,Coral Triangle Center (Bali, Indonesia) and the Global <strong>Marine</strong> <strong>Initiative</strong>, Indo-PacificResource Centre (Brisbane Australia). 340 pp.7
OBJECTIVEThe primary objective of the <strong>Solomon</strong> <strong>Islands</strong> <strong>Marine</strong> <strong>Assessment</strong> was to conduct a broadscaleassessment of the biodiversity and status of marine ecosystems of the <strong>Solomon</strong> <strong>Islands</strong>.SURVEY AREA AND TIMINGSOLOMON ISLANDS MARINE ASSESSMENTA LISON G REEN 1 , WILLIAM A TU 1 AND P ETER R AMOHIA 2The Nature Conservancy 1 & <strong>Solomon</strong> <strong>Islands</strong> Dept of Fisheries and<strong>Marine</strong> Resources 2 8While a comprehensive survey of the <strong>Solomon</strong> <strong>Islands</strong> (Figure 1) was desirable, it was notfeasible given logistic constraints (available time and resources), so the survey focused on thecore island group stretching from Choiseul and the Shortland <strong>Islands</strong> in the northwest toMakira (San Cristobal) in the southeast (Figure 2). The survey track was 1860 nautical mileslong, encompassing seven of the nine provinces: Isabel, Choiseul, Western, Central,Guadalcanal, Malaita and Makira.The <strong>Marine</strong> <strong>Assessment</strong> was conducted over a five-week period from May 13 to June 17,2004. This time period was selected because favorable weather conditions were expected atthat time of the year, and the research vessel (see Research Platform below) was available atthat time. The timing also allowed adequate time to make logistic arrangements, developeffective partnerships, and conduct community liaison prior to the survey (see Partner andCommunity Liaison this report).Figure 1. <strong>Solomon</strong> Island Provinces.
Overview: <strong>Solomon</strong> <strong>Islands</strong> <strong>Marine</strong> <strong>Assessment</strong>Figure 2. Survey route (red line) of the <strong>Solomon</strong> <strong>Islands</strong> <strong>Marine</strong> <strong>Assessment</strong>.The survey was divided into two sectors due to the requirements of provisioning in Honiaraand Gizo:• Northwest Sector: The first three weeks focused on the northwest sector of the mainisland chain. The survey departed Honiara on May 13, and traveled north to theFlorida <strong>Islands</strong>, Isabel, Arnavon <strong>Islands</strong>, Choiseul, Shortland <strong>Islands</strong>, Mono Island,New Georgia, Russell <strong>Islands</strong> and returned to Honiara on June 3.• Southeast Sector: The last two weeks of the survey focused on the southeast sectorof the main island chain. The survey departed Honiara on June 5 and traveledsoutheast along Guadalcanal to Makira, the Three Sisters and Ugi Island, beforeheading north to Malaita, west to the Florida <strong>Islands</strong> and Savo Island, and back toGuadalcanal, returning to Honiara on June 17.SURVEY COMPONENTS AND RESEARCH TEAMThe primary focus of the survey was a scientific assessment of marine ecosystems, with anemphasis on high priority shallow water ecosystems: coral reefs and seagrass beds (with someinformation collected on mangrove forests). A cetacean survey was also conducted, due tothe high level of interest in cetacean conservation and management in the <strong>Solomon</strong> <strong>Islands</strong>.The <strong>Marine</strong> <strong>Assessment</strong> was conducted by a multi-disciplinary team focusing on thefollowing components:• Coral Reef Biodiversity and Reef Health (Corals and Reef Fishes);• Coral Reef Resources (Benthic Communities, Key Invertebrates and Reef Fishes);9
<strong>Solomon</strong> <strong>Islands</strong> <strong>Marine</strong> <strong>Assessment</strong> Technical ReportSeagrass Beds and Mangrove ForestsThe seagrass team comprised three people:• Dr. Len McKenzie and Dr. Stuart Campbell, Queensland Department ofPrimary Industries & Wildlife Conservation Society: Drs. McKenzie andCampbell are seagrass ecologists and Principle Investigators with the Seagrass WatchProgram, which is active throughout the Pacific <strong>Islands</strong>. They conducted a baselinesurvey of the extent (area and biomass), biodiversity, threats, and condition ofseagrass beds. Where possible, they also made similar observations for mangrovesforests. Dr McKenzie participated in the first three weeks of the survey (northwestsector), and Dr Campbell participated in last two weeks (southeast sector).• Mr. Ferral Lasi, The Nature Conservancy: Mr. Lasi has a Masters Degree in<strong>Marine</strong> Biology from University of the South Pacific. He has previously worked withICLARM, and was working for The Nature Conservancy (based in Honiara) at thetime of the survey. He has recently left the Conservancy to join the <strong>Marine</strong>Resources Division with the Secretariat of the Pacific Community. Mr. Lasi assistedDrs McKenzie and Campbell in the seagrass survey.Cetaceans and Deep Water Habitats• Dr. Benjamin Kahn, APEX Environmental: Dr. Kahn is a cetacean expert whohas worked towards establishing collaborative cetacean conservation andmanagement programs in eastern Indonesia and Papua New Guinea. Programsinclude biodiversity, fisheries interactions, policy, outreach and marine tourismcomponents; with a focus on Indo-Pacific marine corridors and other critical habitatsfor large cetaceans and other large migratory marine life. Dr Kahn conducted thecetacean survey during the survey, including visual and acoustic surveys, andcanvassing community knowledge.Community LiaisonThe core community liaison team comprised three people:• Mr. Willie Atu, The Nature Conservancy: Mr. Atu is the Project Manager for theConservancy’s Project in the <strong>Solomon</strong> <strong>Islands</strong>. He holds a Diploma of Educationfrom Pacific Adventist University in PNG, and a Bachelor of Environmental Sciencefrom the University of the South Pacific. Mr Atu led the Community Liaison Team,conducting community liaison before, during and after the survey. During thesurvey, he conducted community liaison during the northwest sector of the survey.• Mr. Rudi Susurua, The Nature Conservancy: Mr Susurua is the EnterpriseCoordinator for the Conservancy’s’ Project in the <strong>Solomon</strong> <strong>Islands</strong>, and has workedas a Fishery Trainer for the European Union’s Rural Fisheries Project in the <strong>Solomon</strong><strong>Islands</strong>. He holds a Diploma in Tropical Fisheries from the University of the SouthPacific. Together with John Pita, he conducted community liaison during thesoutheast sector of the survey.• Mr. John Pita, Department of Environment: Mr Pita holds a certificate inEcotourism from the Australian Conservation Training Institute, and a Certificate inProtected Area Management from the University of South Pacific. At the time of thesurvey, he was a Wild Life Officer with the Department of Environment in the<strong>Solomon</strong> <strong>Islands</strong>, seconded to SPREP as <strong>Solomon</strong> <strong>Islands</strong> Representative for the12
Overview: <strong>Solomon</strong> <strong>Islands</strong> <strong>Marine</strong> <strong>Assessment</strong>South Pacific Biodiversity Program (SPBCP). Mr Pita has led turtle and dugongmonitoring programs in the <strong>Solomon</strong> <strong>Islands</strong>, and was appointed as the ConservationArea Support Officer (CASO) for the Arnavon Community <strong>Marine</strong> ConservationArea. Mr Pita has recently joined WWF Gizo as Bismarck <strong>Solomon</strong> Seas EcoregionCountry Coordinator for the <strong>Solomon</strong> <strong>Islands</strong>. Together with Rudi Susurua, heconducted community liaison during the southeast sector of the survey.In addition to the core team, representatives from local communities and government joinedthe survey for a few days each to assist with community liaison in their areas. Theirparticipation greatly facilitated the community liaison team in obtaining permission to work inthose areas. They included:• Chief Leslie Miki, Kia House of Chiefs and representative of Kia community toArnavon Community <strong>Marine</strong> Conservation Area Management Committee;• Hon Ivan Rotupeoko, Hon Minister for Natural Resources, Isabel ProvincialGovernment;• Mr. Bruno Manele, Darwin Project Coordinator, World Wildlife Fund;• Mr. Nelson Tanito, Senior Fisheries Officer, Choiseul Province;• Mr. Stephen Mauni, Senior Fisheries Officer, Malaita Province; and• Mr. Andrew Doritelia, Fisheries Assistant, Malaita Province.CommunicationsThe communications team comprised two people – a science writer and an underwaterphotographer. Since only one berth was allocated to this team, the science writer participatedin the northwest sector of the survey, and the underwater photographer participated in thesoutheast sector. The team overlapped for a few days on southwest portion of the northwestsector (from Gizo to Honiara) to allow time to coordinate their activities more closely. Theywere:• Dr. Louise Goggin, Cooperative Research Centre for the Great Barrier ReefWorld Heritage Area: Dr. Goggin is a science writer and marine biologist. She haswritten communication strategies, industry reports, scripts for corporate videos,promotional brochures, annual reports, press releases, radio scripts, and newsletters,as well as stories for newspapers, magazines, and the worldwide web. At the time ofthe survey, Dr. Goggin was leading the Communication and Extension Program at theCooperative Research Centre for the Great Barrier Reef where she managed all mediacontact, as well as the production of printed and online products. She is currently aneditor at CSIRO in Canberra, Australia.• Dr. David Wachenfeld, Triggerfish Images: Dr. Wachenfeld is an underwaterphotographer and marine biologist who provided high quality underwater images forthe survey. He has a doctorate in marine biology and is currently the Director of theScience, Technology and Information Group at the Great Barrier Reef <strong>Marine</strong> ParkAuthority.Some of the scientists, particularly Emre Turak, Benjamin Kahn and Gerry Allen, alsoprovided high quality images for the communications team, and Jeanine Almany of TheNature Conservancy coordinated the publication of communication products for the survey(see Communications this report).13
<strong>Solomon</strong> <strong>Islands</strong> <strong>Marine</strong> <strong>Assessment</strong> Technical ReportRESEARCH PLATFORMThe MV FeBrina provided the research platform for the survey. FeBrina is a 72ft liveaboarddive vessel based at Walindi Plantation Resort in Kimbe Bay, Papua New Guinea. FeBrinaprovided an ideal research platform, since it is equipped to provide support for diving inremote locations. The vessel provided accommodation, an experienced crew, full divingfacilities, and a work platform for the research team. In addition to the tender (small boat)provided by the research vessel, the Arnavon Community <strong>Marine</strong> Conservation Area and theDepartment of Fisheries and <strong>Marine</strong> Resources provided three additional tenders and motors.The use of a liveaboard dive vessel, an experienced crew, and four tenders were major factorsin the success of the <strong>Marine</strong> <strong>Assessment</strong>, since they allowed the scientists to maximise theirsurvey time.SITE SELECTIONStudy sites were distributed to provide maximum geographic coverage of the main islands,and exposures around the islands, within the study area. Sites were selected on a daily basistaking survey objectives and logistic constraints into consideration. Sites were selected toinclude representative examples of marine habitats of interest, special and unique areas, andareas of particular interest to partner organisations (particularly marine reserves).In general, five to seven days were spent on each of the large islands or groups (Isabel,Choiseul, New Georgia, Guadalcanal, Makira and Malaita), while one or two days were spenton each of the smaller islands or groups (Arnavons, Shortlands, Russells, Floridas, ThreeSisters, Ugi, and Savo <strong>Islands</strong>). Both exposed and sheltered sites were surveyed on eachisland or island group.Each day, the scientific survey teams, the community liaison team, and the vessel crewassembled to select two general areas to survey the following day, and to identify potentialstudy sites within those areas (based on best available information from navigation charts,satellite images, and local knowledge). When the research team arrived in the study area thenext day, they would confirm their site selection based on a visual assessment of potentialsites. The community liaison team would then visit the local communities and obtainpermission to survey those sites. Once permission had been obtained, the survey wouldproceed.SURVEY PROTOCOLThree survey teams were deployed in separate tenders in each survey area: the Coral ReefBiodiversity and Reef Health team; the Coral Reef Resources team, and the Seagrass andMangrove team.In general, the two coral reef teams each surveyed two sites (exposed and sheltered) in eachstudy area. Two or three sites were surveyed each day, leading to a total of more than 60 sitessurveyed each. This was the maximum possible given logistic constraints of diving, sinceeach site required a long dive (1.5-2 hours) of depths up to 50-60m. It was also oftennecessary to steam for several hours between survey areas, which limited the number of sitesthat could be surveyed each day. This time was used to process data and samples, and toallow divers to have the required surface intervals.In contrast, the Seagrass and Mangrove team covered many sites over a much wider areawithin each study area. This team employed a rapid assessment technique, which allowedthem to survey a total of 1426 sites throughout the <strong>Solomon</strong> <strong>Islands</strong>.14
Overview: <strong>Solomon</strong> <strong>Islands</strong> <strong>Marine</strong> <strong>Assessment</strong>The cetacean survey was conducted while the research vessel was underway (using visual andacoustic methods), and while on-site when tenders were available. Visual surveys wereconducted over 36 days of the survey (a distance of 1228nm) and acoustic surveys wereconducted at 49 sites.The communications team worked with each of the survey teams to summarise their keyfindings and produce high quality communications products for partners (SIMACC members)and key stakeholders (particularly local communities) through news media (newspaper andradio), magazine articles, websites, and PowerPoint presentations.Further details of survey methodology can be found in the technical reports by each surveyteam in this report.15
Partner & Community LiaisonW ILLIAM A TUThe Nature ConservancyIn the early stages of the planning process for the <strong>Solomon</strong> <strong>Islands</strong> <strong>Marine</strong> <strong>Assessment</strong>, it wasrealised that the success of the scientific components of the survey would be contingent, inlarge part, upon the backing of the survey by the <strong>Solomon</strong> Island (SI) Government, surveypartners, and the local SI rural communities and villages. To address these social and politicalelements of the <strong>Assessment</strong>, a Community Liaison Team was assembled, led by William Atuof The Nature Conservancy (TNC) and assisted by Rudi Susurua of TNC and John Pita of the<strong>Solomon</strong> <strong>Islands</strong> Department of Environment.<strong>Solomon</strong> <strong>Islands</strong>: Leadership and Customary Ownership of ResourcesThe <strong>Solomon</strong> <strong>Islands</strong> has been an independent nation since 1978, and is a member of theBritish Commonwealth of nations. There are three distinct tiers of leadership in the <strong>Solomon</strong><strong>Islands</strong>: national and provincial governments and local village leaders. The nationalgovernment consists of a parliamentary configuration, in which members are elected from 50electorates. Provincial governments, of which there are nine, elect ward representatives tomanage their affairs at the Provincial level, and at the local level, village chiefs and churchleaders play an important leadership role. The Community Liaison Team worked to gain theunderstanding and support of all levels of SI leadership, as each level had a critical role toplay in the progress and overall success of the <strong>Marine</strong> <strong>Assessment</strong>.One particularly important tier for the Community Liaison Team to address was that of thelocal leadership. As nearly 85% of the land and associated marine areas in the <strong>Solomon</strong><strong>Islands</strong> are customarily owned by local villages, tribal groupings and communities, theCommunity Liaison Team had to seek permission from customary owners to access theircustomary fishing grounds.Partnerships and Community Outreach<strong>Solomon</strong> <strong>Islands</strong> <strong>Marine</strong> <strong>Assessment</strong> Co-ordinating Committee (SIMACC)The first initiative by The Nature Conservancy (TNC) and the Arnavon <strong>Marine</strong> ConservationArea (AMCA) to conduct a biodiversity-focused marine assessment in the <strong>Solomon</strong> <strong>Islands</strong>was in 1999 as part of the AMCA Expansion Program. The idea for this assessment was tofocus on the islands of Choiseul and Isabel, which were the two main islands surrounding thealready existing AMCA, and thus a possible target for the extension of TNC and AMCA’sconservation efforts in the area. Unfortunately, while AMCA and TNC planned to conductthis survey in 1999, they were forced to delay these plans because of political unrest in thecountry.Several years later in 2003, new interest and a revitalised plan to conduct a marine assessmentof the SI surfaced at an expert planning meeting for the Bismarck-<strong>Solomon</strong> Seas Ecoregion(BSSE) held in Madang, Papua New Guinea. Participants agreed that the <strong>Solomon</strong> <strong>Islands</strong>was an area of extreme data deficiency and that a marine assessment of the area should be ahigh priority. After this meeting, the SI participants (government and non-government16
Overview: Partner & Community Liaisonofficials) returned home with a strong commitment to conduct an assessment that would beginto fill some of the gaps in the biological information for the SI marine environment.In 2004, TNC facilitated the formation of the <strong>Solomon</strong> <strong>Islands</strong> <strong>Marine</strong> <strong>Assessment</strong>Coordinating Committee (SIMACC) to co-ordinate the <strong>Marine</strong> <strong>Assessment</strong>. SIMACC wascomprised primarily of local and international NGOs and various sectors of the SIgovernment. Members included: Department of Forestry, Environment and Conservation;Fisheries Department (of the Ministry of Natural Resources); <strong>Solomon</strong> <strong>Islands</strong> VisitorsBureau (SIVB); Department of National Reform and Planning; Environment Concern ActionNetwork of <strong>Solomon</strong> <strong>Islands</strong>(ECANSI); Foundations of South Pacific International (FSPI);International Waters Program (IWP); The Nature Conservancy (TNC); and the World WideFund for Nature (WWF). The SIMACC was chaired by Peter Ramohia of the <strong>Solomon</strong><strong>Islands</strong> Department of Fisheries and <strong>Marine</strong> Resources.In their first official meeting, SIMACC members unanimously agreed that a marineassessment of the SI was of critical importance. They then discussed the expectations for thesurvey and the role that each of the various NGOs and governmental departments that formedthe SIMACC would take to ensure the success of the survey and its benefits to their workprograms and to the country as a whole. The committee agreed that The Nature Conservancywould lead the survey, since they were in the strongest position to provide logistic, scientificand financial support for the expedition.Community Outreach and AwarenessOnce the SIMACC had determined the geographic scope of the assessment (see <strong>Solomon</strong><strong>Islands</strong> <strong>Marine</strong> <strong>Assessment</strong> this report), the next step was to determine how to go aboutraising adequate awareness at the community and provincial levels. This was critical because,as previously mentioned, tribal villages maintain customary tenure over their reefs, therebygoverning who is allowed to visit them and who isn’t. As such, the Conservancy was facedwith the difficult task of raising awareness around seven of the nine provinces in the SI,educating people about why the survey was going to be conducted, what it would entail,where and when it would happen, and most importantly, why this should matter at all to thelocal communities. The strategy used to address this challenge involved three main concepts:using established relationships within SIMACC and grassroots NGOs to promote and raiseawareness within the affected provinces and communities; forging new relationships withprovincial leaders, chiefs and church leaders by visiting the region and giving presentations;and using media and environmental awareness programs to educate even the most remote ofcommunities about the nature of the survey, and to inform them when the survey vessel wasexpected to be in their area.Using Established Relationships to Promote the <strong>Marine</strong> <strong>Assessment</strong>An example of an opportunity to raise awareness for the <strong>Marine</strong> <strong>Assessment</strong> using preexistingrelationships arose during a Conservancy-run reef fish spawning aggregationworkshop held in Gizo, Western Province, in March 2004. This workshop was attended bythe Gizo Dive Shop, WWF, the Department of Fisheries and Conservation, Uepi Dive Resort,International Waters Program and the Roviana Resource Management Program. A sessionwas scheduled in the workshop to discuss the community liaison strategies with theparticipants. All of the participants of this meeting agreed to not only provide support for theupcoming survey, but to raise grassroots and provincial awareness on what the survey wasabout and its relevance to the livelihoods of <strong>Solomon</strong> Islanders.17
<strong>Solomon</strong> <strong>Islands</strong> <strong>Marine</strong> <strong>Assessment</strong> Technical ReportSoon after the spawning aggregation workshop, a National Fisheries meeting was conductedin Honiara, which was attended by all the Fishery Officers from all the Provinces in thecountry. The Fisheries Department invited the Conservancy to give a presentation about thesurvey at this meeting, which provided an excellent opportunity to encourage the FisheriesDepartment to actively sponsor the assessment. The Fisheries Department was a critical allyfor the assessment, not only because they have management jurisdiction over marineresources in the <strong>Solomon</strong> <strong>Islands</strong> and an obvious interest in the information that the surveywould provide, but because they have networks and influence that spread to even the mostremote villages in the <strong>Solomon</strong> <strong>Islands</strong>. Therefore the Fisheries Department had the positionand respect needed to successfully communicate the importance of the survey for the<strong>Solomon</strong> <strong>Islands</strong>, which would translate into much support and cooperation within theProvinces visited by the expedition.The National Fisheries meeting proved very successful. The <strong>Marine</strong> <strong>Assessment</strong> was givenfull support from all the Provincial Fisheries officers and was given two letters of supportissued by the Department of Fisheries and the Department of Environment and Conservation.In addition to wholeheartedly backing the survey, the provincial officers went one step furtherand helped identify significant sites within their provinces that they considered important toinclude in the survey.Forging New RelationshipsThe next step taken to raise awareness for the survey was to visit the Provincial Centres of theCentral <strong>Islands</strong>, Isabel, Guadalcanal and Malaita Provinces. The Provincial Premiers, ChurchLeaders and elders of each province were briefed about the <strong>Marine</strong> <strong>Assessment</strong> and itsimportance to the local rural communities, the nation, and the world at large. The ProvincialPremiers of these Provinces endorsed the <strong>Marine</strong> <strong>Assessment</strong> and pledged the support of theirrespective Provinces and its communities to this important national undertaking.With the National and Provincial governments now fully in support of the expedition, theCommunity Liaison Team then focussed its efforts on the local villages that directlycontrolled all access to the reefs. To access these tribal resource owners, collaboration withexisting grassroots organisations in each province was required. Some of the indigenousgrassroots organizations that were consulted included the Lauru Land Conference of TribalCommunity in Choiseul, the Isabel Council of Chiefs in Isabel Province, the FAMOACouncil of Chiefs in the Shortlands, and the Gela Council of Chiefs in the Central IslandProvince. All of the grassroots organisations that were approached gave their full approval forthe assessment to be carried out in their respective areas. Churches also served as a usefulmedium for raising awareness at the community level, as <strong>Solomon</strong> Island is a Christiancountry and religion has been very integral part of the lives of the people in ruralcommunities.MediaThe final tactic that the Community Liaison Team used to promote the survey to the villagesinvolved the use of radio and print media as well as environmental awareness presentations inschools. These strategies were implemented before and during the survey, and weresuccessful in convincing the local villages about the importance of this marine assessment totheir daily livelihood and that of their future generations.Radio was the most important means of communicating with remote villages, as radiofrequencies could be received in even the most remote villages. The Community LiaisonTeam used the <strong>Solomon</strong> <strong>Islands</strong> Broadcasting Cooperation to send out survey related18
Overview: Partner & Community Liaisonmessages to church leaders, village chiefs, political leaders and community elders prior to andduring the assessment. These radio awareness messages outlined what the <strong>Marine</strong><strong>Assessment</strong> was, and the expected dates of arrival at various villages and islands.In addition to public radio, two-way radios were also used to communicate the whereaboutsof the survey vessel with the communities. Upon arrival at the villages, the CommunityLiaison Team would call in to arrange a meeting with the chief and church leaders and to tellthem who was aboard the vessel, and what activities were being conducted as part of thesurvey. This type of communication was well received among all the communities visited.In addition to radio, the Community Liaison Team helped facilitate press releases to promotethe progress and the findings of the assessment (see Communications, this report). Thesereleases raised interest among local newspapers, including the local daily the <strong>Solomon</strong> Star, aswell as with the national broadcaster.. In several instances, media releases createdopportunities for live interviews with several of the scientific experts from the survey to talkabout the importance and uniqueness of <strong>Solomon</strong> <strong>Islands</strong>’ coral reefs, and the need topreserve them for the benefits of future generations of <strong>Solomon</strong> Islanders.The last tactic that was used to help with the education and awareness of the <strong>Marine</strong><strong>Assessment</strong> within the villages involved the survey team members leading environmentalawareness presentations for several of the schools and communities. While unfortunatelytime was a limiting factor during the survey and only a limited number of these sorts ofpresentations took place, it did proved to be an extremely valuable tool for sharing the contentand the importance of the survey with the people of the <strong>Solomon</strong> <strong>Islands</strong>.Lessons Learned and Implications for ManagementWorking with people is a complex task. Unlike the biological components of the <strong>Marine</strong><strong>Assessment</strong> where rigid scientific methods could be applied throughout the survey, theCommunity Liaison component involved many more variables and operated more along thenorms and cultural systems that were different in each location. Different challenges werefaced every day of the survey, and for each of these challenges there was a different set ofsolutions. Below is a collection of some of the most critical ‘lessons learned’ with regards tothe process of liaising with the people, villages, community groups and governments in the<strong>Solomon</strong> <strong>Islands</strong>.Work within existing infrastructure• Seek the support of the government and churches in what you are doing.. The peoplein the rural communities have respect for the government and churches who haveoperated and lived with them and understand them. Communities also respectconservation NGO’s who have genuine interest and sincere commitment in what theywere doing in their community.• Respect the beliefs of local churches, customs and cultures as these elements are thefoundation of local communities.• Work with local communities, organisations and groups in the villages so they reallyunderstand what you are intending to do, as misunderstandings can make things reallydifficult for you.• It is very important to contact the community residents who are also living in theurban centres about your planned undertaking.• Always consult the chief of the village upon arrival in a community as there may berestricted or cultural tamboo sites.19
<strong>Solomon</strong> <strong>Islands</strong> <strong>Marine</strong> <strong>Assessment</strong> Technical ReportUse meaningful and relevant approaches when interacting with communitiesTo gain acceptance from local people, use meaningful and relevant approaches. For example,instead of promoting the <strong>Marine</strong> <strong>Assessment</strong> as a means of understanding the biodiversity ofthe <strong>Solomon</strong> <strong>Islands</strong> (a term that locals are not familiar with), promote it as a survey whichwill improve local knowledge about the status of their marine resources, and how tosustainably manage these resources for future generations.Focus on relationship building rather than one-off visits to the communities• Community liaison is about building partner relationships and this process takes up alot of time. It takes time to build confidence and trust with the community beforethey can confidently confide in you. It will be really difficult to build it again once ithas been messed up.• The people in rural communities are simple and hospitable. They will accept you andbe willing to share with you what they have as long as you are honest and sincere.• You must always go back to the villages and communities and inform them about thefindings of their resources.• Admit what you can and cannot do.• Do not make any promise that you cannot keep.ROLE OF COMMUNITY LIAISON IN RESOURCE MANAGEMENTIn my work as the leader of the Community Liaison Team for the SI <strong>Marine</strong> <strong>Assessment</strong>, myapproach was to bring the idea across to the communities that our population is increasing,and as such it exerts a lot of pressure on the resources. For many more years to come themajority of our people in rural communities will depend on natural resources for theirsurvival. Therefore, it is important that we should apply proper management to ensure thelong term sustainability of these resources.Many of the people have already realised that their resources are being depleted at a fast rate,and they do not know what to do. My aim was to show them what is possible using theArnavon <strong>Marine</strong> Conservation Area as an example of how they can conserve their marineresources. Inviting community groups to the Arnavons to see for themselves the successfulconservation of marine resources by local communities has had positive impacts on the livesof the visitors and conservation. Last year a group of chiefs and elders visited the Arnavonsand they were really surprised at what they saw. Since that trip many have started restrictingaccess to some portion of their reefs for conservation.Many (or most) of the resource owners do not have a good understanding of their marineresources, or the relationships within and among ecosystems. As you start to explain this tothem their eyes lit up as they nod their heads. I believe if local communities’ knew moreabout the interrelationship and the interdependence of their ecosystems, they would be morecautious about how they use their marine resources.In one of the communities that I gave an awareness talk to during the <strong>Marine</strong> <strong>Assessment</strong>,most of the participants were women. After I had given the talk they really thanked me andsaid that this was their first time to hear such a talk with so much useful information. In thisparticular area of the <strong>Solomon</strong> <strong>Islands</strong> they have a matrilineal system, and the women havethe last say about how to use their resources. Women have the most worry of feeding theirfamilies every day, and such information will help them protect their livelihood and supporttheir future generations.20
Overview: Partner & Community LiaisonTHANK YOU’STo the tribal chiefs, elders, men, women and children of the villages and communities that wehave visited from May 13th – June 17 th 2004, I would like to say, Barava Tagio Tumas. Yourkind assistance in helping us in your villages and communities and to carry out this survey onyour reefs has been instrumental to its success. It is my sincere hope that the results of the<strong>Marine</strong> <strong>Assessment</strong> will be used to help ensure the sustainability of the marine resources ofour country, while also raising global awareness on the uniqueness and importance of<strong>Solomon</strong> <strong>Islands</strong> inshore reef systems21
COMMUNICATIONSLouise Goggin 1 and Jeanine Almany 2Cooperative Research Centre for the Great Barrier Reef World HeritageArea (CRC Reef) 1 and The Nature Conservancy 2Effective communication was vital to the success of the <strong>Solomon</strong> <strong>Islands</strong> <strong>Marine</strong> <strong>Assessment</strong>.A well-developed communication strategy enabled the survey team to engage a variety oflocal, national and international audiences with specific tools designed to capture support andto promote interest in the <strong>Marine</strong> <strong>Assessment</strong>.Successful and effective communication depended on identifying the objectives ofcommunication efforts, and the key messages. It was also crucial to determine the targetaudiences who needed to be kept informed of the survey, and then design the most effectiveways to communicate with them (Appendix 1). As with any process, it was important toevaluate the effectiveness of the communication efforts and to identify the lessons learned.OBJECTIVESThe objectives of the communication plan for the <strong>Solomon</strong> <strong>Islands</strong> marine survey were to:• inform key audiences of the impending survey, its progress and key findings;• seek access to survey sites from customary owners;• raise the profile of the <strong>Solomon</strong> <strong>Islands</strong> for conservation;• generate interest in the scientific community to work in the <strong>Solomon</strong> <strong>Islands</strong>;• raise the profile of <strong>Solomon</strong> <strong>Islands</strong> as a tourist destination, and• raise awareness of the assessment among partners (in <strong>Solomon</strong> <strong>Islands</strong> andelsewhere) and interested members of the public.KEY MESSAGESAn important part of the communication planning was identifying the key messages about thesurvey. The messages which were considered key were:• <strong>Marine</strong> resources of the <strong>Solomon</strong> <strong>Islands</strong> cannot be managed properly for futuregenerations unless we better understand the status of key marine species.• The survey will help to improve knowledge of the status of key marine resources inthe <strong>Solomon</strong> <strong>Islands</strong>, particularly those of importance for the subsistence, artisanaland commercial fisheries.• The results will be important to local rural communities, to the <strong>Solomon</strong> <strong>Islands</strong>nation and to the world.• The survey will determine if the <strong>Solomon</strong> <strong>Islands</strong> is within the ‘Coral Triangle’: anarea which has the highest marine biodiversity in the world• A survey will determine the effectiveness of existing marine conservation areas in the<strong>Solomon</strong> <strong>Islands</strong>.• The survey is a cooperative project between The Nature Conservancy, <strong>Solomon</strong><strong>Islands</strong> Government, local and international non-government conservation agenciesincluding WWF, Conservation International, Wildlife Conservation Society,Australian research organisations (Australian Institute of <strong>Marine</strong> Science, CRC Reef22
Overview: CommunicationsResearch Centre, Queensland Dept Primary Industries & Fisheries, APEXEnvironmental Pty Ltd) and Triggerfish Images. It is supported by the David andLucile Packard Foundation, Marisla Foundation, the John D. and Catherine T.MacArthur Foundation and the MV FeBrina of Walindi Plantation Dive Cruises.TARGET AUDIENCESThis survey would not have been possible if key audiences were not kept advised of plans forthe survey, informed of progress of the survey once it began, and notified of the results of thesurvey as soon as possible after it was completed. The target audiences for the communicationplan were:• local communities in the <strong>Solomon</strong> <strong>Islands</strong>;• <strong>Solomon</strong> <strong>Islands</strong> <strong>Marine</strong> <strong>Assessment</strong> Coordinating Council (SIMACC);• <strong>Solomon</strong> <strong>Islands</strong> Government;• The Nature Conservancy, WWF and other NGOs involved in the survey;• donors;• international general public; and• scientific community.COMMUNICATION TOOLSWhile the key messages about the survey were the same, communication methods had to betailored for different audiences to be most effective. Some of the key communication toolsused before, during and after the <strong>Solomon</strong> <strong>Islands</strong> marine survey were:• face-to-face communication including meetings and briefings with individuals,villagers, committees and interest groups;• posters and flyers;• two-way and public radio;• media including local and international newspapers, television, magazines, radio andonline news services;• The Nature Conservancy magazine and website;• CRC Reef newsletter;• a slide show (in Microsoft PowerPoint) of the best images;• video footage;• web diaries and web photo gallery;• summary of key findings;• scientific journal articles, and• technical report.COMMUNICATING WITH TARGET AUDIENCESLocal Communities, Partners and the <strong>Solomon</strong> <strong>Islands</strong> GovernmentThe support of local communities and the <strong>Solomon</strong> <strong>Islands</strong> Government was critical to thesuccess of the survey: the survey would not have been possible without their support (seePartner & Community Liaison, this report). Communications for these audiences werefacilitated primarily through the partner and community liaison strategy, with support fromthe tools generated by the communications team.23
<strong>Solomon</strong> <strong>Islands</strong> <strong>Marine</strong> <strong>Assessment</strong> Technical ReportThe Partner & Community Liaison chapter provides a detailed description of how localcommunities, partners through SIMACC and the <strong>Solomon</strong> <strong>Islands</strong> Government were engagedin the <strong>Marine</strong> <strong>Assessment</strong>. The survey team worked before, during and after the <strong>Marine</strong><strong>Assessment</strong> to secure the support of these very important audiences, ensuring that they werekept up-to-date with the latest news, location and progress of the survey.The SIMACC and <strong>Solomon</strong> <strong>Islands</strong> Government were briefed as frequently as possiblethroughout the survey, and at its conclusion. Both received the technical report that outlinesthe full details of results.Three media releases (18 May, 31 May, 3 June) were distributed to local media during thesurvey which stimulated several stories in the local <strong>Solomon</strong> <strong>Islands</strong> newspaper, the <strong>Solomon</strong>Star. An example of a media release is attached (Appendix 2) which may be used as atemplate for future surveys.At the end of the survey, but prior to the release of the technical report, two criticalcommunication tools were produced: a slide show (in Microsoft PowerPoint) of the surveys’best images and; a two-sided A4 sheet outlining the Key Findings from the survey (Appendix3). These tools were effective in disseminating survey results to key partners in a fast andefficient manner so they could be used immediately for conservation in the <strong>Solomon</strong> <strong>Islands</strong>while the full technical report was compiled.The best images from the survey participants (including a professional photographer, DrDavid Wachenfeld) were compiled into a slide show. About 100 of the best images were usedto highlight the major scientific areas of the survey; corals, fishes, cetaceans, seagrasses andcommercial species.Pictures speak in all languages and are a powerful tool to communicate with any audience.The slide show was intended to be used as a prompt for any presenter who could tell the storyof the survey’s highlights in their own words and language. The slide show was easilydistributed to Conservancy staff on CD and was then loaded onto laptop computers forviewing in remote villages. Therefore, it was very useful for the Community Liaison teamwhen they visited communities after the survey.Eight hours of video footage taken by a member of the survey team, Dr Benjamin Kahn, wasedited into an 8-minute compilation. While the video was not taken for broad release and wasinitially intended for Dr Kahn’s personal use, we decided to take the opportunity to createanother communication tool. The final 8-minute video illustrated the key species as well ashow the scientists did their work. The video was particularly useful when providing feedbackto communities after the survey.DonorsThe support of public and private donors was critical to the success of this survey and will becritical to the long term success of conservation in the <strong>Solomon</strong> <strong>Islands</strong>.We used the Key Findings and existing mechanisms including The Nature Conservancywebsite (nature.org) and The Nature Conservancy magazine to share the results of the surveywith donors. A web diary, written over the course of the survey, was posted on nature.org. Anexample of this type of communication product is provided in Appendix 4. A photo gallerywas also posted on the website.24
Overview: CommunicationsStories were published in The Nature Conservancy magazine to promote the importance ofthe region scientifically and to emphasize the urgency for funding. Together, the web and themagazine were designed to help gain support for marine conservation in the <strong>Solomon</strong> <strong>Islands</strong>.The slide show, mentioned above, was also a powerful tool to share with donors and theinternational community. It has assisted The Nature Conservancy in raising the profile ofwork in the region.General PublicThe media were used to raise awareness of the survey both locally and internationally. Localmedia coverage in the <strong>Solomon</strong> <strong>Islands</strong> is mentioned above.In Australia, media releases were written before (5 May) and after (22 June) the survey toraise awareness of the work. In addition, stories appeared in the magazines, Ecos (also onlinehttp://www.publish.csiro.au/ecos/index.cfm?sid=10&issue_id=4745) and AustralasianScience about the results of the survey as well as on television, in newspapers and online.Television coverage for a story hinges on footage. The quality the footage will determine thereach of the story. Unfortunately, the 8-minute video compilation was not yet finished whenthe press release about the survey was distributed in Australia (22 June). Therefore, televisioncoverage of the results of the survey was limited. It is intended that the footage will be used toattract television media coverage when a press release is written about the distribution of thetechnical report.The survey results were also reported in the CRC Reef newsletter which is printed and postedto 1,200 people and organisations in Australia and overseas. It is also available online athttp://www.reef.crc.org.au/publications/newsletter/june04_coraltriangle.htmThe Conservancy’s website (nature.org) is also a valuable tool for communicating with abroad audience. As mentioned above, it houses background information about the survey,web diaries and photo gallery.A total of two radio broadcasts, nine newspaper articles, two newsletter articles, five onlinestories, four magazine articles and one television story reported the results of the survey.Scientific CommunityCommunicating survey outcomes to the scientific community helped to raise awareness ofmarine life of the region. It was also intended to attract attention and interest in further workin the region.The Key Findings document, mentioned above, was prepared soon after the survey wascompleted so it could be distributed at the 10 th International Coral Reef Symposium (ICRS)which was held from 28 June until 2 July 2004 in Okinawa, Japan. The ICRS is the keyconference for coral reef researchers and attracts several thousand delegates from around theglobe.Scientific team participants gave a presentation at the conference to about 30 delegates usingthe slideshow mentioned above to highlight the scientific results.25
<strong>Solomon</strong> <strong>Islands</strong> <strong>Marine</strong> <strong>Assessment</strong> Technical ReportIn addition, an article was written for Biodiversity which is an online scientific journal(Goggin L. 2004. <strong>Solomon</strong> <strong>Islands</strong>: a marine life survey. Biodiversity. 5(4):8-12). It is likelythat the scientists involved in the survey will also write scientific articles in the near future.Lastly, the <strong>Solomon</strong> <strong>Islands</strong> <strong>Marine</strong> <strong>Assessment</strong> technical report, which includes fullscientific details of all species found during the survey, will be a valuable resource for thescientific community. It will be available in PDF format on Conserve Online(conserveonline.org).LESSONS LEARNEDCommunication tools that were found particularly useful were brief and very visual.The slide show and Key Findings were effective for both local and international audiences,and the fact that they were available immediately after the survey meant that the results weredisseminated quickly and well received.The communication tools for donors were also well received, and there has been steadyinterest from donors to support marine conservation in the <strong>Solomon</strong> <strong>Islands</strong> since the survey.In addition, the survey and the associated communication tools have attracted the interest ofinternational tourists. For example, a US-based ecotourism company is now taking smallgroups to visit the Conservancy’s project site and several villages in the ArnavonsCommunity <strong>Marine</strong> Conservation Area.Some other lessons learned were:• Target the communications for different audiences. Face-to-face contact is vital forsome audiences, while a technical report or media article can be used to reach adifferent audience.• Use existing networks and mechanisms – newsletters, magazines, websites,community groups or posters.• Use every opportunity for communicating.• Professional video footage is vital to attract television coverage.• Photographs speak louder than words, in any language, to any audience. They areparticularly useful to attract media coverage of a story. Take lots of photographs tocapture the landscape, the work and the people.THANKSLouise Goggin thanks The Nature Conservancy and CRC Reef for the opportunity toparticipate in the marine survey. I was very proud to be part of such a significant voyage ofdiscovery that has greatly expanded understanding and raised awareness of this incrediblydiverse reef ecosystem.26
Overview: CommunicationsAppendix 1. Summary of communications planning for <strong>Solomon</strong> <strong>Islands</strong> marine assessmentTarget audiences Timing Objectives Key Messages Strategies Desired OutcomesLocal communities Before survey Inform communitiesof the impendingsurveyLocal communities During survey Inform communitiesadjacent to surveysites where scientistswill visit and whatthey will be doingLocal communities After survey Inform communitiesof results of surveySIMACC (SI Govt,NGOs etc) & donorsSIMACC (SI Govt,NGOs etc), donors,members and localcommunitiesBefore survey Welcome surveyteam; reinforceSIMACC surveyobjectivesDuring survey Keep SIMACC,donors and localcommunitiesinformed of progressof survey and keyfindingsWhy, when and howthe survey is beingconductedWhy and how weare conducting thesurvey; resultsreported aftersurvey completedKey findings ofsurvey andrelevance to localcommunitiesWhat SIMACCrequire from surveyHow things aregoing, what is foundLocal radio andnewspaper;Meetings withProvincial Govt etc(see Partner &Community Liaisonreport)Consultation duringsurvey (see Partner& CommunityLiaison report)Local radio,newspapers andposters (see Partner& CommunityLiaison report)SIMACC meetings(and 3 Ministers),reception forparticipants onarrival in HoniaraWeb diary, 1-2 pagesummary of keyfindings providedevery 1-2 weekswhen in Port (Gizo,Honiara)Communities wellinformed of impendingsurvey and know toexpect teamCommunities wellinformed about surveyand happy for surveyteam to visit sitesadjacent to their villagesCommunities wellinformed about surveyresults, particularly onissues that are of interestto themClear understanding byparticipants of needs ofSIMACC: local radioand newspaper coverageof meeting/start ofsurveyTarget audiences wellinformed of progressand key findings; keyfindings reported bylocal media (for localcommunities)27
<strong>Solomon</strong> <strong>Islands</strong> <strong>Marine</strong> <strong>Assessment</strong> Technical ReportTarget audiences Timing Objectives Key Messages Strategies Desired OutcomesSIMACC (SI Govt, NGOs etc), donors and localcommunitiesBy end of survey SIMACC & donorsinformed of surveyresults ASAP aftersurvey1-2 page glossysummary withphotosSIMACC, donorsand scientistsGeneral public(international),scientific communityAfter survey Report technicaldetails of surveyresultsAfter survey Raise profile of SIfor conservation;Generate interest byscientific communityto work in SI; Goodprofile for TNC andpartners; Raisemoney for marineconservation in SISummary of keyfindings of survey:marine biodiversity;status of keyfisheries species;particularly impareas forconservation etcKey findings ofsurvey supported bytechnical detailsSI is an area of highbiodiversity, healthymarine ecosystems,and a goodinvestment forconservation. TNCand partners havealready startedworking there withSI govt; needsupport to protectthis areaSIMACC and donorshappy that survey hasachieved its statedgoals (beforetechnical report isavailable); picked upby local media (forinfo of localcommunities)Technical report Technical detailsArticles inmagazines egAustralasianScience, Ecos,content on TNCwebsitesummarised in asingle report:executive summaryfor non-technicalaudiencesImproved profile ofSI for conservation;Increased funding formarine conservationin SI28
Overview: CommunicationsTarget audiences Timing Objectives Key Messages Strategies Desired OutcomesTNC members & potential SIdonorsAfter survey Raise profile of <strong>Solomon</strong> <strong>Islands</strong> for conservationKey findings of the surveyThe NatureConservancymagazineInternationaltourists<strong>Solomon</strong> <strong>Islands</strong>Cabinet<strong>Solomon</strong> <strong>Islands</strong>CabinetSIMACC (SIGovt, NGOs etc)& donors &PublicAfter survey Raise profile of SI asa tourist destinationAfter survey Inform Cabinet of theresults of the surveyAfter survey Inform Cabinet of theresults of the surveyBefore, duringand afterSurveyRaise profile of theassessment amongpartners (SI andNGOs) and interestedmembers of thepublicWhy SI is a gooddestination for touristsReporting results,maintaining interestReporting results,maintaining interestSI Govt and NGOsrunning first broadscalemarine resourceassessment in SI:project proposal, 1-2updates during survey,2 page summary at end,technical reportTeam to providekey info andimages for use byTourism Bureau inpromotionalmaterialsIncreased interest formarine conservationin the <strong>Solomon</strong><strong>Islands</strong>Increased tourismprofile for <strong>Solomon</strong><strong>Islands</strong>Key Findings Continuedparticipation byCabinet in researchand conservation inthe SITechnical report Continuedparticipation byCabinet in SI researchand conservationContent for TNC’swebsite under AsiaPacific/ <strong>Solomon</strong><strong>Islands</strong> with link toNGO partnersA greater awarenessof the <strong>Marine</strong><strong>Assessment</strong>29
Overview: CommunicationsAppendix 3. <strong>Solomon</strong> <strong>Islands</strong> <strong>Marine</strong> <strong>Assessment</strong>, Key FindingsAn international team of scientists and managersconducted a large-scale marine assessment of the<strong>Solomon</strong> <strong>Islands</strong> in May/June 2004. Led by Dr AlisonGreen of the Nature Conservancy, this was the firstsurvey of the marine resources of the main archipelago,covering a distance of almost 2,000nm and sevenprovinces. In 35 days of survey, the team found veryhigh biodiversity of both corals and fish indicating thatthe <strong>Solomon</strong> <strong>Islands</strong> are part of the Coral Trianglewhich has the highest marine biodiversity in the world.Unfortunately, the team found low numbers ofcommercially exploited species in most areas,indicating that overfishing is widespread.© Triggerfish Images 2004CORALS AND REEF CONDITIONDr Charlie Veron (AIMS) and Emre Turak found that the <strong>Solomon</strong> <strong>Islands</strong> has one of the highest diversities ofcorals anywhere in the world. They recorded 494 species of corals and several new species. This extraordinarilyhigh diversity of coral species is second in the world only to Raja Ampat in Indonesia. The reefs that the teamvisited were generally in good health. However, many sites had above natural numbers of crown-of-thorns starfish(COTS), with significant coral mortality at a few sites where there were high numbers of COTS. Patches ofmortality that appear to match the 2000 coral bleaching event were found, particularly in the eastern <strong>Solomon</strong><strong>Islands</strong>. Damage to corals from blast fishing was only seen at a few sites.REEF FISHThe survey confirms that the <strong>Solomon</strong> <strong>Islands</strong> has one of the richest concentrations of reef fishes in the world and isan integral part of the Coral Triangle. Dr Gerry Allen (CI) recorded 1019 fish species of which 786 (77%) wereobserved during the survey and the rest were found from museum collections. Gerry found approximately 47 newdistribution records for the <strong>Solomon</strong> <strong>Islands</strong>, as well as a cardinalfish (Apogonidae) which is a new species. Gerryfound from100 to 279 fish species per site, with an average of 185 per site. A total of 200 species per site isconsidered the benchmark for an excellent fish count. This figure was exceeded at 37% of <strong>Solomon</strong> <strong>Islands</strong> sites.The best site for fish diversity was Njari Island, off Gizo with a total of 279 fish species. Gerry has only found morespecies than this at three other sites in the world.© Triggerfish Images 2004COMMERCIALLY IMPORTANT MARINE SPECIESPeter Ramohia (Department of Fisheries), Alec Hughes, Tingo Leve(WWF), Michael Ginigele (Tiola <strong>Marine</strong> Protected Area Project,Roviana Lagoon) and Alison Green (TNC) surveyed the status ofstocks of commercially important species. On many reefs, the teamfound few sea cucumbers, Trochus shell, crayfish, tridacnid clams orlarge commercial fish species. The most valuable species such asmaori wrasse, bumphead parrotfish, Trochus, larger species oftridacnid clams and some sea cucumbers (Holothuria nobilis,Holothuria fuscogilva, Thelanota ananas) were often absent. Duringthe survey, the team did not see a single green snail Turbomarmoratus which used to support a large export industry, indicatingthat this species may be locally extinct and requires immediateprotection.In contrast, in the Arnavon <strong>Marine</strong> Conservation Area where commercial fishing and collecting is banned and onlysubsistence collecting of some reef fish species is allowed, there were many sea cucumbers, Trochus, tridacnidclams, crayfish, as well as large commercial fish species particularly the bumphead parrot fish. Also, after morethan 10 years of protection, pearl oyster, especially black lip Pinctada margaritifera, were abundant. This showsthat the conservation area has achieved its goal of protecting important fisheries species.31
<strong>Solomon</strong> <strong>Islands</strong> <strong>Marine</strong> <strong>Assessment</strong> Technical Report© Triggerfish Images 2004WHALES AND DOLPHINSminimal modernisation in the fishery.Benjamin Kahn (APEX Environmental Pty Ltd) found arelatively low cetacean species diversity and abundancethroughout most of the <strong>Solomon</strong> <strong>Islands</strong> with dolphinslocally abundant in a few areas. Benjamin sighted 10species of cetaceans including spinner, spotted, Risso’s,bottlenose, Indo-Pacific bottlenose and rough-tootheddolphins, and a Bryde’s or Sei whale, orca and beakedwhales. Sperm whales were also identified acoustically.The Indispensable Strait region and some other narrow,deep passages in the <strong>Solomon</strong> Seas are probablymigratory corridors. Benjamin spoke to villagers aboutthe traditional dolphin drive which is still practiced insome areas. The drive has a strong cultural heritage withSEAGRASSLen McKenzie (QDPI&F), Ferral Lasi (TNC) and StuartCampbell (WCS) found 10 species of seagrass, 80% of theknown seagrass species in the Indo-Pacific region. Theyfound some very large meadows, including one that wasmore than 1000 hectares in size and some deep meadows,down to 37m. Throughout the survey, the seagrassmeadows were associated with a high biodiversity of faunaincluding dugong, fish, sea cucumbers, seastars, algae andcoral. The highly productive seagrass meadows are oftenon the fringe of coastal communities and supportimportant artisanal fisheries and provide extensive nurseryareas for juvenile fish.COMMUNITY LIAISONCommunication with local communities and national and provincial governments was critical to the success of thesurvey and was conducted by Willie Atu, Ferral Lasi, Rudi Susurua (TNC) and John Pita (Dept Environment &Conservation), with assistance from national and provincial government officials, WWF and local NGOs. Becauseof the excellent liaison work conducted before and during the survey, the team had fantastic support as it travelledthrough the <strong>Solomon</strong> <strong>Islands</strong>. This survey has provided an important basis for working with partners and localcommunities to protect these important resources in the long term.SUPPORTThe survey was a cooperative project between The NatureConservancy (TNC), <strong>Solomon</strong> <strong>Islands</strong> Government, local andinternational non-government conservation agencies includingWorld Wide Fund for Nature (WWF), Conservation International(CI), Wildlife Conservation Society (WCS), Australian researchorganisations (Australian Institute of <strong>Marine</strong> Science (AIMS),CRC Reef Research Centre, Queensland Dept Primary Industries& Fisheries (QDPI&F), APEX Environmental Pty Ltd) andTriggerfish Images. It was supported by the David and LucilePackard Foundation, Homeland Foundation, the John D. andCatherine T. MacArthur Foundation and the MV FeBrina of Walindi Plantation Dive Cruises.© Triggerfish Images 2004© Triggerfish Images 2004For more information contact: Dr Alison Green, The Nature Conservancy. Email: agreen@tnc.org32
Overview: CommunicationsAPPENDIX 4. Example of <strong>Solomon</strong> <strong>Islands</strong> Postcard from the fieldThey have also found more than 100 corals in the <strong>Solomon</strong> <strong>Islands</strong> that are thousands of kilometresbeyond where they were known to live. According to Charlie, these amazing discoveries mean thatmany of his maps showing the distribution of corals are in tatters.So far, Charlie and Emre have found 474 species of corals in the <strong>Solomon</strong> <strong>Islands</strong> as well as ninespecies which could be new to science. This is the second highest diversity of corals in the world,second only to the Raja Ampat <strong>Islands</strong> in eastern Indonesia. This incredible biodiversity places the<strong>Solomon</strong> <strong>Islands</strong> into the ‘Coral Triangle’ – a region with more coral species than anywhere else inthe world. The Coral Triangle was thought to extend from Indonesia only to Papua New Guinea. Thesurvey has shown that the <strong>Solomon</strong> <strong>Islands</strong> also belong within the Coral Triangle. But the news is notonly exciting for corals.So far, Gerry Allen has found more than 900 species of reef fish during the survey, which means thatthe <strong>Solomon</strong> <strong>Islands</strong> is one of the ‘big five’ for reef fish species, ranking with Indonesia, Philippines,Papua New Guinea and Australia.Gerry has also found some sites in the <strong>Solomon</strong> <strong>Islands</strong> that have extremely high biodiversity. Duringa single dive at Njari near Gizo, Gerry found 278 species of reef fish! In 35 years of diving and withmore than 7,000 hours underwater, he has only found higher biodiversity at a few sites in Raja Ampatin Indonesia where the most he has ever found was 284 species of fish on a single dive; only sixspecies less than he recorded in the <strong>Solomon</strong> <strong>Islands</strong>.This incredible biodiversity is exciting news for the <strong>Solomon</strong> <strong>Islands</strong>. But also brings an enormouschallenge. With rising populations in the <strong>Solomon</strong> <strong>Islands</strong>, the challenge will be to ensure that thisbountiful marine life is protected for future generations.33
June 2006TNC Pacifi c Island CountriesReport No 1/06<strong>Solomon</strong> <strong>Islands</strong>GovernmentChapter 1CoralDiversity<strong>Solomon</strong> <strong>Islands</strong> <strong>Marine</strong> <strong>Assessment</strong>Charlie Veron& Emre Turak35
Published by: The Nature Conservancy, Indo-Pacific Resource CentreAuthor Contact Details:‘Charlie’ Veron: Australian Institute of <strong>Marine</strong> Science, Townsville 4810, Australiae-Mail: j.veron@aims.gov.auEmre Turak: Rue Francois Villon, 95000, Cergy, Francee-Mail: emreturak@wanadoo.frSuggested Citation:Veron, J.E.N. and E. Turak. 2006. Coral Diversity. In: Green, A., P. Lokani, W. Atu, P.Ramohia, P. Thomas and J. Almany (eds). 2006. <strong>Solomon</strong> <strong>Islands</strong> <strong>Marine</strong> <strong>Assessment</strong>:Technical report of survey conducted May 13 to June 17, 2004. TNC Pacific Island CountriesReport No 1/06.© 2006, The Nature ConservancyAll Rights Reserved.Reproduction for any purpose is prohibited without prior permission.Design: Jeanine AlmanyArtwork: Nuovo DesignCover Photo: © Emre TurakAvailable from:Indo-Pacific Resource CentreThe Nature Conservancy51 Edmondstone StreetSouth Brisbane, QLD 4101AustraliaOr via the worldwide web at: www.conserveonline.org36
Coral DiversityContentsExecutive Summary ................................................................................................................. 38Methods.......................................................................................................................................... 38Results ............................................................................................................................................. 38Discussion ..................................................................................................................................... 39Conservation Merit............................................................................................................... 39References ......................................................................................................................................41Tables................................................................................................................................................ 42Table 1. ........................................................................................................................................................42Table 2.........................................................................................................................................................5837
<strong>Solomon</strong> <strong>Islands</strong> <strong>Marine</strong> <strong>Assessment</strong> Technical ReportEXECUTIVE SUMMARYA total of 485 described species belonging to 76 genera were recorded during the <strong>Solomon</strong><strong>Islands</strong> survey. An additional 9 species were collected that are unknown to the authors and arepossibly new species. This is the second highest species diversity in the world, second only tothe region of the Raja Ampat <strong>Islands</strong> of eastern Indonesia. Significantly, of the describedspecies, 122 species have their known ranges extended by this study. This unexpectedly highdiversity is due to the wide range of habitats encountered during the survey.METHODSThis study concentrated on building a cumulative total of species for the entire island groupand was undertaken simultaneously with a study of site comparisons (Coral Communities andReef Health, this report).Observations were recorded by scuba diving at 66 sites to a maximum depth of ~50m. Allrecords were initially based on visual identification made underwater. Where skeletal detailwas required for species determination voucher specimens were collected.Specimens of taxonomic interest were sent to the Australian Institute of <strong>Marine</strong> Science. Thebulk of the collection was sent to the Department of Fisheries of the <strong>Solomon</strong> <strong>Islands</strong>. Wherethere was a taxonomic or identification issue, collections were made as necessary to addressthe issue.Sites are as listed elsewhere in this report. (Coral Communities and Reef Health, this report).The taxonomic basic for this study was Veron (2000) and the references cited therein.Geographic information providing the basis for reporting range extensions are the speciesdistribution maps of Veron and Stafford-Smith (2001).RESULTSA total of 485 described species belonging to 76 genera were found during the survey (Table1). This table does not include additional 9 unidentified species belonging to generaAcropora, Anacropora, Goniopora, Leptoseris, Merulina, Porites, Seriatopora andTurbinaria which brings the total species complement to 494. Table 1 also lists the describedspecies from the Raja Ampat <strong>Islands</strong> of Indonesia and Milne Bay of Papua New Guinea.Field reference numbers of specimens prepared for further study or reference are given inTable 2. Extensive collections were made of some species where there was a taxonomic oridentification problem that warranted detailed study. Excess specimens were discardedbecause of space and handling limitations and many species were not collected if in situidentification was deemed adequate.Of the 485 described species, 122 species (indicated in Table 1) and 4 genera (all of which aremonospecific) have distribution range extended by this study, although all but one (Pectiniaafricanus) has been previously recorded in the western Pacific. This high number of rangeextensions is mostly because little previous work has been done at the <strong>Solomon</strong>s.Only one otherwise common group of corals, Genus Alveopora, was rarely encountered.38
Coral DiversityMany species had variation in growth form or skeletal detail not previously recorded andsome well-studied species (notably Merulina ampliata and Stylocoeniella guentheri) havevariations so different from previous records that they were initially thought to be differentspecies.DISCUSSIONThere have been no in-depth surveys of <strong>Solomon</strong> Island corals before the present work, whichis why there were so many range extensions in the present results. The <strong>Solomon</strong> <strong>Islands</strong> cannow be recognised as being an integral part of the centre of coral biodiversity. The highdiversity is due to the wide range of habitats encountered during the survey. However, veryhigh diversities were recorded in only a small (
<strong>Solomon</strong> <strong>Islands</strong> <strong>Marine</strong> <strong>Assessment</strong> Technical ReportBy World Heritage criteria the <strong>Solomon</strong> <strong>Islands</strong> rates high. The overall condition of mostreefs is good, presumably an outcome of low population density and low levels of explosivefishing. Reef condition, the diversity of marine life, and the attractiveness of rainforestdominatedislands, combine to create old-world settings that are seldom seem in today’s overpopulatedand over-exploited world.40
Coral DiversityREFERENCESBrodie, J. and E. Turak. 2004. Land use practices in the Stettin Bay catchment area and theirrelation to the status of the coral reefs in the Bay. Report to TNC and NBPOL.Fenner, D. and E. Turak. 2003. List of coral species recorded at Milne Bay Province, PapuaNew Guinea during 2000 RAP survey. In: Allen, Gerald R., Jeff P. Kinch, and SheilaA. McKenna, (eds). A Rapid <strong>Marine</strong> Biodiversity <strong>Assessment</strong> of Milne Bay Province,Papua New Guinea – Survey II (2000). Conservation International Rapid <strong>Assessment</strong>ProgramGreen, A. and P.J. Mous. 2003. Delineating the Coral Triangle, its ecoregions and functionalseascapes. Report on an expert workshop, held at the Southeast Asia Center for<strong>Marine</strong> Protected Areas, Bali, Indonesia. The Nature Conservancy, Southeast AsiaCenter for <strong>Marine</strong> Protected Areas.Turak, E. and J. Aitsi. 2003. <strong>Assessment</strong> of coral biodiversity and status of coral reefs of EastKimbe Bay, New Britain, Papua New Guinea, 2002. The Nature Conservancy Report.Turak, E. and J. Souhoka. 2003. Coral diversity and status of coral reefs in the Raja Ampat<strong>Islands</strong>. In: Donnelly R, Duncan N and Mous PJ (eds). Report on a rapid ecologicalassessment of the Raja Ampat <strong>Islands</strong>, Papua, Eastern Indonesia. The NatureConservancy.Veron, J.E.N. 1998. Corals of the Milne Bay Region of Papua New Guinea. In: Werner, TAand Allen GR (eds). A rapid biodiversity assessment of the coral reefs of Milne BayProvince, Papua New Guinea. Conservation International.Veron, J.E.N. 2000. Corals of the World Vols.1-3. Townsville. Australian Institute of <strong>Marine</strong>Science.Veron, J.E.N. 2002. Reef corals of the Raja Ampat <strong>Islands</strong>, Irian Papua Province, Indonesia.RAP Bulletin of biological assessment. 22Veron, J.E.N. and M.G. Stafford-Smith. 2002. Coral ID. Australian Institute of <strong>Marine</strong>Science (CD-ROM).41
<strong>Solomon</strong> <strong>Islands</strong> <strong>Marine</strong> <strong>Assessment</strong> Technical ReportTABLESTable 1. Coral species list.Zooxanthellate Scleractinia<strong>Solomon</strong> <strong>Islands</strong>MilneRajaBay,AmpatPapua<strong>Islands</strong>,NewGuinea 1 Indonesia 2Record DistributionFamily Astrocoeniidae Koby, 1890 P Genus Stylocoeniella Yabe and Sugiyama, 1935 P Stylocoeniella armata (Ehrenberg, 1834) P Stylocoeniella cocosensis Veron, 1990Stylocoeniella guentheri Bassett-Smith, 1890 P Genus Palauastrea Yabe and Sugiyama, 1941 N Palauastrea ramosa Yabe and Sugiyama, N 1941Genus Madracis Milne Edwards and Haime, 1849 N Madracis kirbyi Veron and Pichon, 1976 N Family Pocilloporidae Gray, 1842 P Genus Pocillopora Lamarck, 1816 P Pocillopora ankeli Scheer and Pillai, 1974 Pocillopora damicornis (Linnaeus, 1758) P Pocillopora danae Verrill, 1864 P Pocillopora elegans Dana, 1846 N Pocillopora eydouxi Milne Edwards and P Haime, 1860Pocillopora kelleheri Veron, 2000 P Pocillopora meandrina Dana, 1846 P Pocillopora verrucosa (Ellis and Solander, P 1786)Pocillopora woodjonesi Vaughan, 1918 P Genus Seriatopora Lamarck, 1816 P Seriatopora aculeata Quelch, 1886 P Seriatopora caliendrum Ehrenberg, 1834 P Seriatopora dendritica Veron, 2000 N Seriatopora guttatus Veron, 2000 P Seriatopora hystrix Dana, 1846 P Seriatopora stellata Quelch, 1886 P Genus Stylophora Schweigger, 1819 P Stylophora pistillata Esper, 1797 P Stylophora subseriata (Ehrenberg, 1834) P Family Acroporidae Verrill, 1902 P Genus Montipora Blainville, 1830 P Montipora aequituberculata Bernard, 1897 P Montipora altasepta Nemenzo, 1967 P Montipora angulata (Lamarck, 1816) N Montipora australiensis Bernard, 1897 P Montipora cactus Bernard, 1897 N Montipora calcarea Bernard, 1897 N 42
Coral DiversityZooxanthellate Scleractinia<strong>Solomon</strong> <strong>Islands</strong>MilneBay,PapuaNewGuinea 1RajaAmpat<strong>Islands</strong>,Indonesia 2Montipora caliculata (Dana, 1846) P Montipora capitata Dana, 1846 P Montipora capricornis Veron, 1985 P Montipora cebuensis Nemenzo, 1976 P Montipora cocosensis Vaughan, 1918 N Montipora confusa Nemenzo, 1967 N Montipora corbetensis Veron and Wallace, P 1984Montipora crassituberculata Bernard, 1897 P Montipora danae (Milne Edwards and P Haime, 1851)Montipora deliculata Veron, 2000 N Montipora digitata (Dana, 1846) P Montipora efflorescens Bernard, 1897 P Montipora effusa Dana, 1846 PMontipora florida Nemenzo, 1967 Montipora floweri Wells, 1954 P Montipora foliosa (Pallas, 1766) P Montipora foveolata (Dana, 1846) P Montipora friabilis Bernard, 1897 N Montipora gaimardi Bernard 1897Montipora grisea Bernard, 1897 P Montipora hirsuta Nemenzo, 1967 N Montipora hispida (Dana, 1846) P Montipora hodgsoni Veron, 2000 N Montipora hoffmeisteri Wells, 1954 P Montipora incrassata (Dana, 1846) P Montipora informis Bernard, 1897 P Montipora mactanensis Nemenzo, 1979 N Montipora malampaya Nemenzo, 1967 N Montipora meandrina (Ehrenberg, 1834)Montipora millepora Crossland, 1952 P Montipora mollis Bernard, 1897 P Montipora monasteriata (Forskäl, 1775) P Montipora niugini Veron, 2000 N Montipora nodosa (Dana, 1846) P Montipora orientalis Nemenzo, 1967 N Montipora plawanensis Veron, 2000 N Montipora peltiformis Bernard, 1897 P Montipora porites Veron, 2000 N Montipora samarensis Nemenzo, 1967 P Montipora spongodes Bernard, 1897 P Montipora spumosa (Lamarck, 1816) P Montipora stellata Bernard, 1897 N Montipora taiwanensis Veron, 2000Montipora tuberculosa (Lamarck, 1816) P 43
<strong>Solomon</strong> <strong>Islands</strong> <strong>Marine</strong> <strong>Assessment</strong> Technical ReportZooxanthellate Scleractinia<strong>Solomon</strong> <strong>Islands</strong>MilneRajaBay,AmpatPapua<strong>Islands</strong>,NewGuinea 1 Indonesia 2Montipora turgescens Bernard, 1897 P Montipora turtlensis Veron and Wallace, P 1984Montipora undata Bernard, 1897 P Montipora venosa (Ehrenberg, 1834) P Montipora verrucosa (Lamarck, 1816) P Montipora verruculosa Veron, 2000 N Montipora vietnamensis Veron, 2000 N Genus Anacropora Ridley, 1884 P Anacropora forbesi Ridley, 1884 P Anacropora matthai Pillai, 1973 N Anacropora pillai Veron, 2000 NAnacropora puertogalerae Nemenzo, 1964 P Anacropora reticulata Veron and Wallace, P 1984Anacropora spinosa Rehberg, 1892 N Genus Acropora Oken, 1815 P Acropora abrolhosensisVeron, 1985 P Acropora abrotanoides (Lamarck, 1816) P Acropora aculeus (Dana, 1846) P Acropora acuminata (Verrill, 1864) P Acropora akajimensis Veron, 1990 N Acropora anthocercis (Brook, 1893) P Acropora aspera (Dana, 1846) P Acropora austera (Dana, 1846) P Acropora awi Wallace and Wolstenholme, N 1998Acropora batunai Wallace, 1997 N Acropora bifurcata Nemenzo, 1971 N Acropora brueggemanni (Brook, 1893) P Acropora carduus (Dana, 1846) P Acropora caroliniana Nemenzo, 1976 P Acropora cerealis (Dana, 1846) P Acropora chesterfieldensis Veron and P Wallace, 1984Acropora clathrata (Brook, 1891) P Acropora convexa (Dana, 1846) N Acropora cophodactyla (Brook, 1892) Acropora copiosa Nemenzo, 1967 P Acropora crateriformis (Gardiner, 1898) P Acropora cuneata (Dana, 1846) P Acropora cylindrica Veron and Fenner, 2000 N Acropora cytherea (Dana, 1846) P Acropora dendrum (Bassett-Smith, 1890) P Acropora derewanensis Wallace (1997) Acropora desalwii Wallace, 1994 N Acropora digitifera (Dana, 1846) P 44
Coral DiversityZooxanthellate Scleractinia<strong>Solomon</strong> <strong>Islands</strong>MilneBay,PapuaNewGuinea 1RajaAmpat<strong>Islands</strong>,Indonesia 2Acropora divaricata (Dana, 1846) P Acropora donei Veron and Wallace, 1984 P Acropora echinata (Dana, 1846) P Acropora efflorexcens (Dana, 1846) PAcropora elegans Milne Edwards and Haime, 1860 Acropora elseyi (Brook, 1892) P Acropora exquisita Nemenzo, 1971 P Acropora florida (Dana, 1846) P Acropora formosa (Dana, 1846) P Acropora glauca (Brook, 1893)Acropora gemmifera (Brook, 1892) P Acropora globiceps (Dana, 1846) P Acropora gomezi Veron, 2000 NAcropora grandis (Brook, 1892) P Acropora granulosa (Milne Edwards and P Haime, 1860)Acropora hoeksemai Wallace, 1997 N Acropora horrida (Dana, 1846) P Acropora humilis (Dana, 1846) P Acropora hyacinthus (Dana, 1846) P Acropora indonesia Wallace, 1997 N Acropora inermis (Brook, 1891) P Acropora insignis Nemenzo, 1967 P Acropora irregularis (Brook, 1892) N Acropora jacquelineae Wallace, 1994 N Acropora kimbeensis Wallace, 1999 P Acropora kirstyae Veron and Wallace, 1984 P Acropora latistella (Brook, 1891) P Acropora listeri (Brook, 1893) P Acropora loisetteae Wallace, 1994Acropora lokani Wallace, 1994 N Acropora longicyathus (Milne Edwards and P Haime, 1860)Acropora loripes (Brook, 1892) P Acropora lovelli Veron and Wallace, 1984 PAcropora lutkeni Crossland, 1952 P Acropora macrostoma (Brook, 1891)Acropora meridiana Nemenzo, 1971 N Acropora microclados (Ehrenberg, 1834) P Acropora microphthalma (Verrill, 1859) P Acropora millepora (Ehrenberg, 1834) P Acropora mirabilis (Quelch, 1886) P Acropora monticulosa (Brüggemann, 1879) P Acropora multiacuta Nemenzo, 1967 N Acropora nana (Studer, 1878) P Acropora nasuta (Dana, 1846) P 45
<strong>Solomon</strong> <strong>Islands</strong> <strong>Marine</strong> <strong>Assessment</strong> Technical ReportZooxanthellate Scleractinia<strong>Solomon</strong> <strong>Islands</strong>MilneRajaBay,AmpatPapua<strong>Islands</strong>,NewGuinea 1 Indonesia 2Acropora navini Veron, 2000 NAcropora nobilis (Dana, 1846) P Acropora ocellata (Klunzinger, 1879)Acropora orbicularis Brook, 1892 N Acropora palifera (Lamarck, 1816) P Acropora palmerae Wells, 1954 P Acropora paniculata Verrill, 1902 P Acropora papillarae Latypov, 1992Acropora parahemprichii Veron, 2000Acropora parilis (Quelch, 1886) P Acropora pectinatus Veron, 2000Acropora pichoni Wallace, 1999 P Acropora pinguis Wells, 1950 N Acropora plana Nemenzo, 1967 N Acropora plumosa Wallace and N Wolstenholme, 1998Acropora polystoma (Brook, 1891) P Acropora prostrata (Dana, 1846) P Acropora proximalis Veron, 2000Acropora pulchra (Brook, 1891) P Acropora rambleri (Bassett-Smith, 1890) P Acropora robusta (Dana, 1846) P Acropora retusa (Dana, 1846) NAcropora rosaria (Dana, 1846) P Acropora russelli Wallace, 1994Acropora samoensis (Brook, 1891) P Acropora sarmentosa (Brook, 1892) P Acropora scherzeriana (Brüggemann, 1877)Acropora secale (Studer, 1878) P Acropora sekiseinsis Veron, 1990Acropora selago (Studer, 1878) P Acropora seriata Ehrenberg, 1834 Acropora simplex Wallace and Wolstenholme, 1998Acropora solitaryensis Veron and Wallace, P 1984Acropora speciosa (Quelch, 1886) P Acropora spicifera (Dana, 1846) P Acropora striata (Verrill, 1866) Acropora subglabra (Brook, 1891) P Acropora subulata (Dana, 1846) P Acropora tenella (Brook, 1892) P Acropora tenuis (Dana, 1846) P Acropora tortuosa (Dana, 1846) P Acropora turaki Wallace, 1994 N Acropora valenciennesi (Milne Edwards andHaime, 1860) P 46
Coral DiversityZooxanthellate Scleractinia<strong>Solomon</strong> <strong>Islands</strong>MilneRajaBay,AmpatPapua<strong>Islands</strong>,NewGuinea 1 Indonesia 2Acropora valida (Dana, 1846) P Acropora variabilis (Klunzinger, 1879)Acropora vaughani Wells, 1954 P Acropora vermiculata Nemenzo, 1967Acropora verweyi Veron and Wallace, 1984 P Acropora walindii Wallace, 1999 P Acropora wallaceae Veron, 1990 P Acropora willisae Veron and Wallace, 1984 Acropora yongei Veron and Wallace, 1984 P Genus Astreopora Blainville, 1830 P Astreopora cuculata Lamberts, 1980 P Astreopora expansa Brüggemann, 1877 P Astreopora gracilis Bernard, 1896 P Astreopora incrustans Bernard, 1896 N Astreopora listeri Bernard, 1896 P Astreopora macrostoma Veron and Wallace, 1984Astreopora myriophthalma (Lamarck, 1816) P Astreopora ocellata Bernard, 1896 P Astreopora randalli Lamberts, 1980 P Astreopora scabra Lamberts, 1982Astreopora suggesta Wells, 1954 P Family Euphilliidae Veron, 2000 P Genus Euphyllia P Euphyllia ancora Veron and Pichon, 1979 N Euphyllia cristata Chevalier, 1971 P Euphyllia divisa Veron and Pichon, 1980 N Euphyllia glabrescens (Chamisso and P Eysenhardt, 1821)Euphyllia paraancora Veron, 1990 P Euphyllia paradivisa Veron, 1990Euphyllia yaeyamensis (Shirai, 1980) P Genus Catalaphyllia Wells, 1971 Catalaphyllia jardinei (Saville-Kent, 1893) Genus Nemenzophyllia Hodgson and Ross, 1981Nemenzophyllia turbida Hodgson and Ross,1981Genus Plerogyra Milne Edwards and Haime, P 1848Plerogyra discus Veron and Fenner, 2000Plerogyra simplex Rehberg, 1892 P Plerogyra sinuosa (Dana, 1846) P Genus Physogyra Quelch, 1884 Physogyra lichtensteini (Milne Edwards and P Haime, 1851)Family Oculinidae Gray, 1847 P Genus Galaxea Oken, 1815 P Galaxea acrhelia Veron, 2000 P 47
<strong>Solomon</strong> <strong>Islands</strong> <strong>Marine</strong> <strong>Assessment</strong> Technical ReportZooxanthellate Scleractinia<strong>Solomon</strong> <strong>Islands</strong>MilneRajaBay,AmpatPapua<strong>Islands</strong>,NewGuinea 1 Indonesia 2Galaxea astreata (Lamarck, 1816) P Galaxea cryptoramosa Fenner and Veron,2000Galaxea fascicularis (Linnaeus, 1767) P Galaxea horrescens (Dana, 1846) P Galaxea longisepta Fenner & Veron, 2000 N Galaxea paucisepta Claereboudt, 1990 N Family Siderasteridae Vaughan and Wells, 1943 P Genus Pseudosiderastrea Yabe and Sugiyama, P 1935Pseudosiderastrea tayami Yabe and P Sugiyama, 1935Genus Psammocora Dana, 1846 P Psammocora contigua (Esper, 1797) P Psammocora digitata Milne Edwards and P Haime, 1851Psammocora explanulata Horst, 1922 P Psammocora haimeana Milne Edwards and P Haime, 1851Psammocora nierstraszi Horst, 1921 P Psammocora obtusangula (Lamarck, 1816) P Psammocora profundacella Gardiner, 1898 P Psammocora stellata Verrill, 1864Psammocora superficialis Gardiner, 1898 P Genus Coscinaraea Milne Edwards and Haime, P 1848Coscinaraea columna (Dana, 1846) P Coscinaraea crassa Veron and Pichon, 1980 P Coscinaraea exesa (Dana, 1846) P Coscinaraea monile (Foskål, 1775) Coscinaraea wellsi Veron and Pichon, 1980 P Family Agariciidae Gray, 1847 P Genus Pavona Lamarck, 1801 P Pavona bipartita Nemenzo, 1980 P Pavona cactus (Forskål, 1775) P Pavona clavus (Dana, 1846) P Pavona danae Milne Edwards and Haime,1860Pavona decussata (Dana, 1846) P Pavona duerdeni Vaughan, 1907 P Pavona explanulata (Lamarck, 1816) P Pavona frondifera (Lamarck, 1816) N Pavona maldivensis (Gardiner, 1905) P Pavona minuta Wells, 1954 P Pavona varians Verrill, 1864 P Pavona venosa (Ehrenberg, 1834) P Genus Leptoseris Milne Edwards and Haime,1849 P 48
Coral DiversityZooxanthellate Scleractinia<strong>Solomon</strong> <strong>Islands</strong>MilneRajaBay,AmpatPapua<strong>Islands</strong>,NewGuinea 1 Indonesia 2Leptoseris amitoriensis Veron, 1990Leptoseris explanata Yabe and Sugiyama, P 1941Leptoseris foliosa Dineson, 1980 N Leptoseris gardineri Horst, 1921 P Leptoseris hawaiiensis Vaughan, 1907 P Leptoseris incrustans (Quelch, 1886) P Leptoseris mycetoseroides Wells, 1954 P Leptoseris papyracea (Dana, 1846) P Leptoseris scabra Vaughan, 1907 P Leptoseris solida (Quelch, 1886) N Leptoseris striata (Fenner & Veron 2000) N Leptoseris tubulifera Vaughan, 1907 N Leptoseris yabei (Pillai and Scheer, 1976) P Genus Gardineroseris Scheer and Pillai, 1974 P Gardineroseris planulata Dana, 1846 P Genus Coeloseris Vaughan, 1918 P Coeloseris mayeri Vaughan, 1918 P Genus Pachyseris Milne Edwards and Haime, P 1849Pachyseris foliosa Veron, 1990 Pachyseris gemmae Nemenzo, 1955 P Pachyseris involuta (Studer, 1877) Pachyseris rugosa (Lamarck, 1801) P Pachyseris speciosa (Dana, 1846) P Family Fungiidae Dana, 1846 P Genus Cycloseris Milne Edwards and Haime, P 1849Cycloseris colini Veron, 2000 N Cycloseris costulata (Ortmann, 1889) N Cycloseris curvata (Hoeksema, 1989) N Cycloseris cyclolites Lamarck, 1801 P Cycloseris erosa (Döderlein, 1901) N Cycloseris hexagonalis (Milne Edwards and P Haime, 1848)Cycloseris patelliformis (Boschma, 1923) P Cycloseris sinensis (Milne Edwards and P Haime, 1851)Cycloseris somervillei (Gardiner, 1909) P Cycloseris tenuis (Dana, 1846) P Cycloseris vaughani (Boschma, 1923) P Genus Diaseris P Diaseris distorta PDiaseris fragilis Alcock, 1893 P Genus Cantharellus Hoeksema and Best, 1984 N Cantharellus jebbi Hoeksema, 1993 N 49
<strong>Solomon</strong> <strong>Islands</strong> <strong>Marine</strong> <strong>Assessment</strong> Technical ReportZooxanthellate Scleractinia<strong>Solomon</strong> <strong>Islands</strong>MilneBay,PapuaNewGuinea 1RajaAmpat<strong>Islands</strong>,Indonesia 2Cantharellus nuomeae Hoeksema & Best,1984Genus Helliofungia Wells, 1966 P Heliofungia actiniformis Quoy and Gaimard, P 1833Genus Fungia Lamarck, 1801 P Fungia concinna Verrill, 1864 P Fungia corona Döderlein, 1901 P Fungia danai Milne Edwards and Haime, P 1851Fungia fralinae Nemenzo, 1955 N Fungia fungites (Linneaus, 1758) P Fungia granulosa Klunzinger, 1879 P Fungia horrida Dana, 1846 P Fungia klunzingeri Döderlein, 1901 P Fungia moluccensis Horst, 1919 N Fungia paumotensis Stutchbury, 1833 P Fungia repanda Dana, 1846 P Fungia scabra Döderlein, 1901 P Fungia scruposa Klunzinger, 1879 P Fungia scutaria Lamarck, 1801 P Fungia spinifer Claereboudt and Hoeksema, N 1987Genus Ctenactis Verrill, 1864 P Ctenactis albitentaculata Hoeksema, 1989 P Ctenactis crassa (Dana, 1846) P Ctenactis echinata (Pallas, 1766) P Genus Herpolitha Eschscholtz, 1825 P Herpolitha limax (Houttuyn, 1772) P Herpolitha weberi Horst, 1921 P Genus Polyphyllia Quoy and Gaimard, 1833 P Polyphyllia novaehiberniae (Lesson, 1831) P Polyphyllia talpina (Lamarck, 1801) P Genus Sandalolitha Quelch, 1884 P Sandalolitha dentata (Quelch, 1886) P Sandalolitha robusta Quelch, 1886 P Genus Halomitra Dana, 1846 P Halomitra clavator Hoeksema, 1989 N Halomitra meierar Veron and Maragos, 2000Halomitra pileus (Linnaeus, 1758) P Genus Zoopilus Dana, 1864 P Zoopilus echinatus Dana, 1846 P Genus Lithophyllum Rehberg, 1892 P Lithophyllon lobata Horst, 1921 NLithophyllon mokai Hoeksema, 1989 P Lithophyllon undulatum Rehberg, 189250
Coral DiversityZooxanthellate Scleractinia<strong>Solomon</strong> <strong>Islands</strong>MilneRajaBay,AmpatPapua<strong>Islands</strong>,NewGuinea 1 Indonesia 2Genus Podabacia Milne Edwards and Haime, P 1849Podabacia crustacea (Pallas, 1766) P Podabacia motuporensis Veron, 1990 P Family Pectinidae Vaughan and Wells, 1943 P Genus Echinophyllia Klunzinger, 1879 P Echinophyllia aspera (Ellis and Solander, P 1788)Echinophyllia costata Fenner and Veron, N 2000Echinophyllia echinata (Saville-Kent, 1871) P Echinophyllia echinoporoides Veron and N Pichon, 1979Echinophyllia orpheensis Veron and Pichon, P 1980Echinophyllia patula (Hodgson and Ross, N 1982)Echinophyllia pectinata Veron 2000 N Genus Echinomorpha Veron, 2000 N Echinomorpha nishihirea (Veron, 1990) N Genus Oxypora Saville-Kent, 1871 P Oxypora crassispinosa Nemenzo, 1979 N Oxypora glabra Nemenzo, 1959 P Oxypora lacera Verrill, 1864 P Genus Mycedium Oken, 1815 P Mycedium elephatotus (Pallas, 1766) P Mycedium mancaoi Nemenzo, 1979 P Mycedium robokaki Moll and Best, 1984 N Genus Pectinia Oken, 1815 P Pectinia africanus Veron, 2000 NPectinia alcicornis (Saville-Kent, 1871) P Pectinia ayleni (Wells, 1935) N Pectinia elongata Rehberg, 1892 P Pectinia lactuca (Pallas, 1766) P Pectinia maxima (Moll and Borel Best, 1984) N Pectinia paeonia (Dana, 1846) P Pectinia pygmaeus Veron, 2000 N Pectinia teres Nemenzo and montecillo, 1981 N Family Merulinidae Verrill, 1866 P Genus Hydnophora Fischer de Waldheim, 1807 P Hydnophora bonsai Veron, 1990Hydnophora exesa (Pallas, 1766) P Hydnophora grandis Gardiner, 1904 P Hydnophora microconos (Lamarck, 1816) P Hydnophora pilosa Veron, 1985 P Hydnophora rigida (Dana, 1846) P Genus Paraclavarina Veron, 1985 P 51
<strong>Solomon</strong> <strong>Islands</strong> <strong>Marine</strong> <strong>Assessment</strong> Technical ReportZooxanthellate Scleractinia<strong>Solomon</strong> <strong>Islands</strong>MilneRajaBay,AmpatPapua<strong>Islands</strong>,NewGuinea 1 Indonesia 2Paraclavarina triangularis (Veron and Pichon, P 1980)Genus Merulina Ehrenberg, 1834 P Merulina ampliata (Ellis and Solander, 1786) P Merulina scabricula Dana, 1846 P Genus Scapophyllia Milne Edwards and Haime, P 1848Scapophyllia cylindrica Milne Edwards and P Haime, 1848Family Dendrophylliidae Gray, 1847 P Genus Turbinaria Oken, 1815 P Turbinaria frondens (Dana, 1846) P Turbinaria irregularis, Bernard, 1896 N Turbinaria mesenterina (Lamarck, 1816) P Turbinaria patula (Dana, 1846) P Turbinaria peltata (Esper, 1794) P Turbinaria reniformis Bernard, 1896 P Turbinaria stellulata (Lamarck, 1816) P Family Mussidae Ortmann, 1890 P Genus Blastomussa Well, 1961 P Blastomussa merleti, Wells, 1961 PBlastomussa wellsi Wijsman-Best, 1973 P Genus Micromussa Veron, 2000 P Micromussa amakusensis (Veron, 1990) P Micromussa diminuta Veron, 2000 NMicromussa minuta (Moll and Borel-Best, N 1984)Genus Acanthastrea Milne Edwards and Haime, P 1848Acanthastrea bowerbanki Milne Edwards and P Haime, 1851Acanthastrea brevis Milne Edwards and N Haime, 1849Acanthastrea echinata (Dana, 1846) P Acanthastrea faviaformis Veron, 2000 N Acanthastrea hemprichii (Ehrenberg, 1834) N Acanthastrea hillae Wells, 1955 Acanthastrea ishigakiensis Veron, 1990 P Acanthastrea lordhowensis Veron and Pichon, N 1982Acanthastrea regularis Veron, 2000 N Acanthastrea rotundoflora Chevalier, 1975 P Acanthastrea subechinata Veron, 2000 N Genus Lobophyllia Blainville, 1830 P Lobophyllia corymbosa (Forskål, 1775) P Lobophyllia dentatus Veron, 2000 P Lobophyllia diminuta Veron, 1985 P Lobophyllia flabelliformis Veron, 2000 P 52
Coral DiversityZooxanthellate Scleractinia<strong>Solomon</strong> <strong>Islands</strong>MilneRajaBay,AmpatPapua<strong>Islands</strong>,NewGuinea 1 Indonesia 2Lobophyllia hataii Yabe and Sugiyama, 1936 P Lobophyllia hemprichii (Ehrenberg, 1834) P Lobophyllia pachysepta Chevalier, 1975 P Lobophyllia robusta Yabe and Sugiyama, N 1936Lobophyllia serratus Veron, 2000 N Genus Symphyllia Milne Edwards and Haime, P 1848Symphyllia agaricia Milne Edwards and P Haime, 1849Symphyllia hassi Pillai and Scheer, 1976 N Symphyllia radians Milne Edwards and P Haime, 1849Symphyllia recta (Dana, 1846) P Symphyllia valenciennesii Milne Edwards and P Haime, 1849Genus Scolymia Haime, 1852 P Scolymia australis (Milne Edwards and P Haime, 1849)Scolymia vitiensis Brüggemann, 1878 P Genus Australomussa Veron, 1985 P Australomussa rowleyensis Veron, 1985 P Genus Cynarina Brüggemann, 1877 P Cynarina lacrymalis (Milne Edwards and P Haime, 1848)Family Faviidae Gregory, 1900 P Genus Caulastrea Dana, 1846 P Caulastrea curvata Wijsman-Best, 1972 P Caulastrea echinulata (Milne Edwards and N Haime, 1849)Caulastrea furcata Dana, 1846 P Caulastrea tumida Matthai, 1928 P Genus Favia Oken, 1815 P Favia danae Verrill, 1872 P Favia favus (Forskål, 1775) P Favia helianthoides Wells, 1954 P Favia laxa (Klunzinger, 1879) P Favia lizardensis Veron and Pichon, 1977 P Favia maritima (Nemenzo, 1971) P Favia marshae Veron, 2000 N Favia matthai Vaughan, 1918 P Favia maxima Veron, Pichon & Wijsman- N Best, 1972Favia pallida (Dana, 1846) P Favia rosaria Veron, 2000 P Favia rotumana (Gardiner, 1899) P Favia rotundata Veron, Pichon & Wijsman-Best, 1972 P 53
<strong>Solomon</strong> <strong>Islands</strong> <strong>Marine</strong> <strong>Assessment</strong> Technical ReportZooxanthellate Scleractinia<strong>Solomon</strong> <strong>Islands</strong>MilneBay,PapuaNewGuinea 1RajaAmpat<strong>Islands</strong>,Indonesia 2Favia speciosa Dana, 1846 P Favia stelligera (Dana, 1846) P Favia truncatus Veron, 2000 N Favia veroni Moll and Borel-Best, 1984 P Genus Barabattoia Yabe and Sugiyama, 1941 P Barabattoia amicorum (Milne Edwards and P Haime, 1850)Barabattoia laddi (Wells, 1954)Genus Favites Link, 1807 P Favites abdita (Ellis and Solander, 1786) P Favites acuticolis (Ortmann, 1889) N Favites bestae Veron, 2000 P Favites chinensis (Verrill, 1866) P Favites complanata (Ehrenberg, 1834) P Favites flexuosa (Dana, 1846) P Favites halicora (Ehrenberg, 1834) P Favites micropentagona Veron, 2000 N Favites paraflexuosa Veron, 2000 N Favites pentagona (Esper, 1794) P Favites russelli (Wells, 1954) P Favites spinosa (Klunzinger, 1879)Favites stylifera (Yabe and Sugiyama, 1937) N Favites vasta (Klunzinger, 1879) N Genus Goniastrea Milne Edwards and Haime, P 1848Goniastrea aspera Verrill, 1905 P Goniastrea australensis (Milne Edwards and P Haime, 1857)Goniastrea edwardsi Chevalier, 1971 P Goniastrea favulus (Dana, 1846) P Goniastrea minuta Veron, 2000Goniastrea palauensis (Yabe and Sugiyama, P 1936)Goniastrea pectinata (Ehrenberg, 1834) P Goniastrea ramosa Veron, 2000 N Goniastrea retiformis (Lamarck, 1816) P Genus Platygyra Ehrenberg, 1834 P Platygyra acuta Veron, 2000 N Platygyra contorta Veron, 1990 P Platygyra daedalea (Ellis and Solander, P 1786)Platygyra lamellina (Ehrenberg, 1834) P Platygyra pini Chevalier, 1975 P Platygyra ryukyuensis Yabe and Sugiyama, P 1936Platygyra sinensis (Milne Edwards and P Haime, 1849)Platygyra verweyi Wijsman-Best, 1976 N 54
Coral DiversityZooxanthellate Scleractinia<strong>Solomon</strong> <strong>Islands</strong>MilneBay,PapuaNewGuinea 1RajaAmpat<strong>Islands</strong>,Indonesia 2Platygyra yaeyemaensis Eguchi and Shirai, N 1977Genus Australogyra Veron, Pichon and Wijsman- P Best, 1977Australogyra zelli Veron and Pichon, 1977 P Genus Oulophyllia Milne Edwards and Haime, P 1848Oulophyllia bennettae (Veron, Pichon, 1977) P Oulophyllia crispa (Lamarck, 1816) P Oulophyllia levis Nemenzo, 1959 N Genus Leptoria Milne Edwards and Haime, 1848 P Leptoria irregularis Veron, 1990 Leptoria phrygia (Ellis and Solander, 1786) P Genus Montastrea Blainville, 1830 P Montastrea annuligera (Milne Edwards and P Haime, 1849)Montastrea colemani Veron, 2000 P Montastrea curta (Dana, 1846) P Montastrea magnistellata Chevalier, 1971 P Montastrea multipunctata Hodgson, 1985 P Montastrea salebrosa (Nemenzo, 1959) P Montastrea valenciennesi (Milne Edwards P and Haime, 1848)Genus Plesiastrea Milne Edwards and Haime, P 1848Plesiastrea versipora (Lamarck, 1816) P Genus Oulastrea Milne Edwards and Haime, 1848Oulastrea crispata (Lamarck, 1816) Genus Diploastrea Matthai, 1914 P Diploastrea heliopora (Lamarck, 1816) P Genus Leptastrea Milne Edwards and Haime, P 1848Leptastrea aequalis Veron, 2000Leptastrea bewickensis Veron and Pichon,1977Leptastrea bottae (Milne Edwards and N Haime, 1849)Leptastrea inaequalis Klunzinger, 1879 P Leptastrea pruinosa Crossland, 1952 P Leptastrea purpurea (Dana, 1846) P Leptastrea transversa Klunzinger, 1879 P Genus Cyphastrea Milne Edwards and Haime, P 1848Cyphastrea agassizi (Vaughan, 1907) N Cyphastrea chalcidium (Forskål, 1775) P Cyphastrea decadia Moll and Best, 1984 P Cyphastrea japonica Yabe and Sugiyama,1932 N 55
<strong>Solomon</strong> <strong>Islands</strong> <strong>Marine</strong> <strong>Assessment</strong> Technical ReportZooxanthellate Scleractinia<strong>Solomon</strong> <strong>Islands</strong>MilneBay,PapuaNewGuinea 1RajaAmpat<strong>Islands</strong>,Indonesia 2Cyphastrea microphthalma (Lamarck, 1816) P Cyphastrea ocellina (Dana, 1864) P Cyphastrea serailia (Forskål, 1775) P Genus Echinopora Lamarck, 1816 P Echinopora gemmacea Lamarck, 1816 P Echinopora hirsutissima Milne Edwards and P Haime, 1849Echinopora horrida Dana, 1846 P Echinopora lamellosa (Esper, 1795) P Echinopora mammiformis (Nemenzo, 1959) P Echinopora pacificus Veron, 1990 P Echinopora taylorae (Veron, 2000) N Genus Moseleya Quelch, 1884Moseleya latistellata Quelch, 1884Family Trachyphyllidae Verrill, 1901 PGenus Trachyphyllia Milne Edwards and Haime, N1848Trachyphyllia geoffroyi (Audouin, 1826) N Family Poritidae Gray, 1842 P Genus Porites Link, 1807 P Porites aranetai Nemenzo, 1955Porites annae Crossland, 1952 P Porites attenuata Nemenzo 1955 P Porites australiensis Vaughan, 1918 P Porites cumulatus Nemenzo, 1955 N Porites cylindrica Dana, 1846 P Porites deformis Nemenzo, 1955 P Porites densa Vaughan, 1918 N Porites eridani Umbgrove, 1940 NPorites evermanni Vaughan, 1907 N Porites flavus Veron, 2000 N Porites heronensis Veron, 1985 Porites horizontalata Hoffmeister, 1925 Porites latistellata Quelch, 1886 P Porites lichen Dana, 1846 P Porites lobata Dana, 1846 P Porites lutea Milne Edwards and Haime, P 1851Porites mayeri Vaughan, 1918 Porites monticulosa Dana, 1846 P Porites murrayensis Vaughan, 1918 P Porites napopora Veron, 2000Porites negrosensis Veron, 1990 Porites nigrescens Dana, 1846 N Porites profundus Rehberg, 1892Porites rugosa Fenner & Veron, 2000 N 56
Coral DiversityZooxanthellate Scleractinia<strong>Solomon</strong> <strong>Islands</strong>MilneBay,PapuaNewGuinea 1RajaAmpat<strong>Islands</strong>,Indonesia 2Porites rus (Forskål, 1775) P Porites sillimaniana Nemenzo, 1976 P Porites solida (Forskål, 1775) P Porites stephensoni Crossland, 1952 P Porites tuberculosa Veron, 2000 N Porites vaughani Crossland, 1952 P Genus Goniopora Blainville, 1830 P Goniopora albiconus Veron, 2000Goniopora burgosi Nemenzo, 1955 N Goniopora columna Dana, 1846 P Goniopora djiboutiensis Vaughan, 1907 P Goniopora eclipsensis Veron and Pichon, N 1982Goniopora fruticosa Saville-Kent, 1893 N Goniopora lobata Milne Edwards and Haime, P 1860Goniopora minor Crossland, 1952 P Goniopora palmensis Veron and Pichon, N 1982Goniopora pandoraensis Veron and Pichon, P 1982Goniopora pendulus Veron, 1985Goniopora polyformis Zou, 1980Goniopora somaliensis Vaughan, 1907 P Goniopora stokesi Milne Edwards and P Haime, 1851Goniopora stutchburyi Wells, 1955 P Goniopora tenella (Quelch, 1886)Goniopora tenuidens (Quelch, 1886) P Genus Alveopora Blainville, 1830 P Alveopora catalai Wells, 1968 N Alveopora daedalea (Forskål, 1775)Alveopora excelsa Verrill, 1863Alveopora fenestrata (Lamarck, 1816) P Alveopora gigas Veron, 1985Alveopora marionensis Veron and Pichon, 1982Alveopora minuta Veron, 2000 Alveopora spongiosa Dana, 1846 P Alveopora tizardi Bassett-Smith, 1890 P Alveopora verrilliana Dana, 1872TOTAL SPECIES 485 N = 122 436 535P = Previously recorded (within the distribution range of Veron, 2000)N = New record for the <strong>Solomon</strong> <strong>Islands</strong> (not within the distribution range of Veron, 2000)1 From the combined records of Veron (2000) and Turak and Souhoka (2003)2 From the combined records of Veron (1998) and Fenner and Turak (2003)57
<strong>Solomon</strong> <strong>Islands</strong> <strong>Marine</strong> <strong>Assessment</strong> Technical ReportTable 2. Coral specimens collected for further study or reference, and their associated field reference number.SPECIES FIELD REFERENCE NUMBERAcanthastrea brevis 617, 618Acanthastrea echinata 140, 120, 304, 340, 341, 347, 619Acanthastrea faviaformis 875Acanthastrea ishigakiensis 769, 871Acropora abrolhosensis 757Acropora akajimensis 206, 363, 627Acropora awi 758Acropora batunai 213, 214, 215, 216, 217Acropora bifurcata 571Acropora bruggemanni 757, 758, 759, 851Acropora caroliniana 207, 373, 374, 565, 629Acropora cerealis 362, 376, 382, 395, 568, 761Acropora chesterfieldensis 756, 765Acropora clathrata 369Acropora convexa 576Acropora cophodactyla 629Acropora cylindrica 383, 428, 444, 450Acropora digitifera 859Acropora donei 763Acropora echinata 572, 868Acropora elseyi 380, 566, 877Acropora gemmifera 570, 575Acropora globiceps 358Acropora grandis 200Acropora granulosa 203Acropora hoeksemai 627SPECIES FIELD REFERENCE NUMBERAcropora horrida 204, 332, 360, 754Acropora indonesia 628Acropora inermis 573Acropora irregularis 852Acropora jacquelineae 353Acropora kimbeensis 372Acropora latistella 205Acropora lokani 371, 384Acropora lovelli 760Acropora microclados 365, 750, 837Acropora microphthalma 355, 864Acropora millepora 386Acropora monticulosa 405Acropora multiacuta 744, 745, 746Acropora nana 403Acropora nasuta 96, 397, 398, 759, 835Acropora navini 890Acropora orbicularis 853Acropora palifera 218Acropora paniculata 574Acropora parilis 762Acropora pichoni 415Acropora plana 756Acropora plumosa 569, 393Acropora polystoma 375, 387, 388, 389, 390, 391Acropora pulchra 37758
Coral DiversitySPECIES FIELD REFERENCE NUMBERAcropora rambleri 368, 381, 755Acropora retusa 836Acropora robusta 370, 858Acropora rosaria 385Acropora samoensis 219Acropora sarmentosa 202, 354Acropora secale 392Acropora selago 747, 748, 749Acropora solitaryensis 357, 394Acropora sp. 761, 762Acropora speciosa 356, 379Acropora subglabra 359, 364, 366, 367, 378, 754Acropora subulata 201, 753, 755Acropora tenuis 751, 752Acropora valenciennesi 399Acropora valida 795Acropora vaughani 361, 628, 767Acropora wallaceae 872Alveopora catalai 244, 452, 878, 879Alveopora spongiosa 633, 634Alveopora tizardi 643Anacropora forbesi 211, 461, 462, 463Anacropora pillai 212Anacropora puertogalerae 209, 460, 790Anacropora reticulata 208, 464Anacropora sp.Anacropora spinosa 577, 459,210, 453, 454, 455, 456, 457, 458,816SPECIES FIELD REFERENCE NUMBERAstreopora gracilis 775, 777Astreopora incrustans 672, 770, 771Astreopora myriophthalma 772, 774, 776, 789Astreopora randalli 773Australogyra zelli 470, 471, 411Australomussa rowleyensis 424Blastomussa merleti 607, 608, 865Blastomussa wellsi 418, 613, 614Cantharellus jebbi 539Caulastrea curvata 438, 467, 472, 723Caulastrea furcata 724Coeloseris mayeri 547Coscinaraea columna 552Coscinaraea wellsi 844, 845, 848Ctenactis albitentaculata 131Cycloseris colini 247, 509, 510, 511, 783Cycloseris costulata 254Cycloseris cyclolites 127Cycloseris erosa 132, 141, 784, 785Cycloseris hexagonalis 787Cycloseris patelliformis 786Cycloseris somervillei 501, 512, 513Cycloseris tenuis 133Cynarina lacrymalis 123, 249, 250, 507, 508, 422Cyphastrea 8 septa 312Cyphastrea agassizi 564Cyphastrea chalcidium 611Cyphastrea decadia 468, 469, 417, 44559
<strong>Solomon</strong> <strong>Islands</strong> <strong>Marine</strong> <strong>Assessment</strong> Technical ReportSPECIES FIELD REFERENCE NUMBERCyphastrea microphthalma 309, 310, 311, 555Cyphastrea serailia 554, 735Diaseris fragilis 130, 442Echinophyllia aspera 315, 321, 322, 829, 830, 831, 832Echinophyllia echinoporoides 667, 843Echinophyllia orpheensis 251Echinophyllia patula 820Echinopora gemmacea 301, 302, 343Echinopora horrida 414Echinopora lamellosa 248, 466Echinopora taylorae 308, 314, 345, 610, 670, 731Euphyllia ancora 665Euphyllia paraancora 106Euphyllia yaeyamaensis 105, 522Favia danae 876Favia helianthoides 732Favia laxa 797Favia matthaii 324, 325, 326, 327, 733, 768Favia maxima 741Favia rotumana 563 346Favia rotundata 313Favia stelligera 412, 416, 426, 440, 739Favia truncatus 320, 323Favites complanata 348Favites flexuosa 740Favites pentagona 305, 306, 307, 558, 559, 560Favites russelli 561, 780Fungia concinna 516SPECIES FIELD REFERENCE NUMBERFungia fralinae 856, 857Fungia fungites 515Fungia granulosa 253Fungia horrida 140Fungia klunzingeri 139,Fungia moluccensis 128, 134, 138, 788, 794Fungia paumotensis 126Fungia scutaria 137Galaxea astreata 711Galaxea fascicularis 434, 722Galaxea horrescens 433, 441, 709, 710Galaxea longisepta 408Galaxea paucisepta 342, 421, 436, 716Gardineroseris planulata 677Goniastrea aspera 743, 781Goniastrea pectinata 553Goniastrea retiformis 336, 730Goniopora burgosi 647, 648, 649, 650Goniopora columna 651, 821Goniopora djiboutiensis 653Goniopora eclipsensis 817Goniopora fruticosa 793Goniopora lobata 654, 655, 660Goniopora minor 635, 636, 637, 639, 656Goniopora palmensis 644Goniopora pandoraensis 645, 646Goniopora somaliensis 518, 822Goniopora sp. 658, 65960
Coral DiversitySPECIES FIELD REFERENCE NUMBERGoniopora stokesi 652Goniopora stutchburyi 638, 641, 642Halomitra clavator 101, 102, 103, 822Herpolitha weberi 136Hydnophora pilosa 409Hydnophora rigida 329, 330, 540, 541Leptastrea inaequalis 734Leptastrea pruinosa 317, 809Leptastrea purpurea 318, 319, 333, 557Leptastrea transversa 671Leptoseris explanata 523, 532, 536, 537, 538, 404Leptoseris foliosa 109, 526, 534, 612Leptoseris gardineri 519, 532Leptoseris hawaiiensis 823, 824, 825, 849Leptoseris mycetoseroides 406Leptoseris papyracea 107, 108Leptoseris scabra 529, 801, 826Leptoseris solida 524, 525, 530, 531Leptoseris sp. 803, 804, 805, 806, 812Leptoseris tubulifera 527, 528Leptoseris yabei 413, 420Lithophyllon lobata 668, 676, 815, 847Lithophyllon mokai 539, 808Lobophyllia dentatus 402Lobophyllia diminuta 432, 792Lobophyllia flabelliformis 860Lobophyllia hataii 427Lobophyllia pachysepta 401SPECIES FIELD REFERENCE NUMBERMerulina ampliata 548, 727Merulina sp.430, 542, 543, 665, 666, 713, 714,715, 796, 811, 854Micromussa diminuta 615Micromussa minuta 122,Montastrea annuligera 556, 735Montastrea colemani 303, 349, 350, 736Montastrea curta 465, 328, 351, 742Montastrea magnistellata 467Montastrea salebrosa 624Montastrea valenciennesi 738Montipora aequituberculata 264, 271, 272Montipora altasepta 220, 221Montipora calcarea 704Montipora caliculata 235, 686, 687, 698,Montipora capricornis 245Montipora cocosensis 259, 260Montipora confusa 673Montipora danae 267, 429Montipora digitata 224, 225, 226, 227Montipora efflorescens 238, 239, 240, 707Montipora foliosa 690, 691, 693Montipora foveolata 234, 274, 684, 685Montipora grisea 236, 237, 261, 262, 706Montipora hirsuta 695Montipora hispida 232, 233Montipora hodgsoni 692Montipora incrassata 255, 270, 70261
<strong>Solomon</strong> <strong>Islands</strong> <strong>Marine</strong> <strong>Assessment</strong> Technical ReportSPECIES FIELD REFERENCE NUMBERMontipora informis 257, 259Montipora mactanensis 518, 689Montipora malampaya 222, 223, 246Montipora mollis 275, 276Montipora monasteriata 241, 708Montipora niugini 520Montipora orientalis 265, 266Montipora palawanensis 703Montipora peltiformis 258 869Montipora spongodes 277, 278Montipora spumosa 699, 700, 701, 705Montipora stellata 228, 229, 694Montipora tuberculosa 263, 620Montipora turgescens 256Montipora undata 242, 243Montipora verruculosa 268, 269Montipora vietnamensis 230, 231Mycedium elephantotus 546Mycedium robokaki 545Oulophyllia crispa 725Oulophyllia levis 726Oxypora crasispinosa 835, 836, 837, 840, 841, 842Oxypora glabra 827Oxypora lacera 833, 834Pachyseris foliosa 419Pachyseris speciosa 451Palauastrea ramosa 113, 335, 682, 683Pavona bipartita 674, 675, 810, 828SPECIES FIELD REFERENCE NUMBERPavona cactus 339, 449Pavona clavus 814, 846, 866Pavona explanulata 678Pavona frondifera 535Pavona maldivensis 117, 337Pavona varians 800,Pavona venosa 112Pectinia africanus 517Pectinia alcicornis 431Pectinia ayleni 104, 345, 838, 839Pectinia elongata 439Pectinia maxima 344Pectinia pygmaeus 111, 813Platygyra pini 764Platygyra yaeyamaensis 316, 560, 729Plerogyra simplex 423Pocillopora damicornis 521Pocillopora elegans 874Pocillopora kelleheri 867Podabacia motuporensis 407Polyphyllia novaehiberniae 135, 435Porites attenuata 153Porites australiensis 177Porites cylindrica 152, 158Porites deformis 179Porites densa 630, 873, 880Porites flavus 160, 161Porites horizontalata 16862
Coral DiversitySPECIES FIELD REFERENCE NUMBERPorites latistellata 144, 145, 146, 147, 154, 162Porites lichen 163, 164, 165, 168, 870Porites monticulosa 173, 174, 175, 176, 855Porites murrayensis 178, 180Porites nigrescens 150, 151Porites rugosa 148, 149, 157Porites rus 116, 155, 156Porites solida 169Porites sp. 1 182, 183, 184, 185, 186Porites sp. 2 792, 793, 794Porites stephensoni 631Porites tuberculosa 159, 181Porites vaughani 166, 167, 170, 171, 172Psammocora contigua 114, 544Psammocora digitata 334Psammocora explanulata 669Psammocora nierstraszi 625Psammocora profundacella 115, 551, 621, 682, 862Psammocora superficialis 141, 622, 623, 819, 861SPECIES FIELD REFERENCE NUMBERPseudosiderastrea tayami 609Sandalolitha dentata 331, 443Scapophyllia cylindrica 440Scolymia vitiensis 502, 503, 504, 505, 506Seriatopora dendritica 712Seriatopora hystrix 252, 446, 447, 448Seriatopora sp. 125, 795, 796Seriatopora stellata 791Stylocoeniella armata 100Stylocoeniella guentheriStylophora subseriata 549Symphyllia valenciennesi 410Trachyphyllia geoffroyi 679Turbinaria irregularis 720, 721, 766Turbinaria mesenterina 718Turbinaria reniformis 717110, 142, 143, 338, 437, 550, 600,601, 603, 604, 605, 606, 680, 681,81863
June 2006TNC Pacifi c Island CountriesReport No 1/06<strong>Solomon</strong> <strong>Islands</strong>GovernmentChapter 2Coral Communities &Reef Health<strong>Solomon</strong> <strong>Islands</strong> <strong>Marine</strong> <strong>Assessment</strong>Emre Turak65
Published by: The Nature Conservancy, Indo-Pacific Resource CentreAuthor Contact Details:Emre Turak: 1 Rue François Villon, 95000, Cergy, Francee-Mail: emreturak@wanadoo.frSuggested Citation:Turak, E. 2006. Coral Communities and Reef Health. In: Green, A., P. Lokani, W. Atu, P. Ramohia,P. Thomas and J. Almany (eds.) 2006. <strong>Solomon</strong> <strong>Islands</strong> <strong>Marine</strong> <strong>Assessment</strong>: Technical report ofsurvey conducted May 13 to June 17, 2004. TNC Pacific Island Countries Report No. 1/06.© 2006, The Nature ConservancyAll Rights Reserved.Reproduction for any purpose is prohibited without prior permission.Design: Jeanine AlmanyArtwork: Nuovo DesignMaps: Stuart Sheppard & Jeanine AlmanyCover Photo: © Emre TurakAvailable from:Indo-Pacific Resource CentreThe Nature Conservancy51 Edmondstone StreetSouth Brisbane, QLD 4101AustraliaOr via the worldwide web at: www.conserveonline.org66
Coral Communities & Reef HealthCONTENTSExecutive Summary ......................................................................................................................................68Introduction..................................................................................................................................................68Methods..............................................................................................................................................................69Taxonomic Inventories .................................................................................................................................... 69Benthic Cover and Reef Development..........................................................................................................72Community Types...............................................................................................................................................72Coral Injury........................................................................................................................................................... 73Results ..................................................................................................................................................................73Biodiversity and Biogeography ........................................................................................................................ 73Coral Communities ............................................................................................................................................77Reef Condition ....................................................................................................................................................85Artificial reef islands (Sulufou) in Lau’alo Passage................................................................................... 86Discussion .........................................................................................................................................................88Conservation ..................................................................................................................................................88References ........................................................................................................................................................ 90Appendices .........................................................................................................................................................92Appendix 1.............................................................................................................................................................92Appendix 2. ...........................................................................................................................................................97Appendix 3.............................................................................................................................................................97Appendix 4. ........................................................................................................................................................ 10467
<strong>Solomon</strong> <strong>Islands</strong> <strong>Marine</strong> <strong>Assessment</strong> Technical ReportEXECUTIVE SUMMARYCoral diversity and reef status was assessed by SCUBA surveys at 113 sites at 59 locations aroundall the major islands of the main island chain of the <strong>Solomon</strong>s. Very high hard coral speciesrichness with 485 species belonging to 76 genera in 14 families was recorded.Seven coral community types were recognized. Of these, coral communities found in very shelteredinlets in the fjord like coastlines were of particular interest. These communities were unique, hadhigh species richness, usually high living coral cover and were generally in good health.Overall, reefs and coral communities of the <strong>Solomon</strong>s were in good condition. With the exceptionof some localized areas, impacts and reef degradation were low to moderate at most sites.Crown of thorns starfish damage was the most widespread and significant at some locations.Damage from the 2000 coral bleaching event was noted at some locations. Sediment associatedimpact was rarely noted. However such areas were usually avoided for the purpose of this survey.There was evidence of over harvesting of commercially targeted reef species, such as giant clams,Trochus and sea cucumbers.Lau’alo Passage (northeast Malaita) with its extensive shallow reef areas and reticulate channels,seagrass meadows and artificial reef island villages, is an area of great ecological and cultural value,and potential conservation interest.INTRODUCTIONAn extensive survey of the coral reefs of the nine main island and island groups of the <strong>Solomon</strong><strong>Islands</strong> was conducted during a 5 week cruise in May – June 2004. The main chain of the <strong>Solomon</strong><strong>Islands</strong>, form a natural continuation of Bougainville Island in PNG, also forming the north andeastern borders of the <strong>Solomon</strong> Sea. They are islands of volcanic origin with in some areas currentvolcanic and tectonic activity. With the exception of two main atolls, Ontong Java atoll and theIndispensable Reefs (which were not visited during the surveys), <strong>Solomon</strong> Island reefs arepredominantly fringing and barrier type. A few small platform and pinnacle reefs are scatteredthroughout the archipelago.The principal aims of this survey were to map the coral and reef biodiversity and to assess thecurrent status of the reefs of the <strong>Solomon</strong> <strong>Islands</strong>. Work was done closely with coral taxonomicsurveys and this report is complimented by taxonomy report (Coral Diversity, this report).Very little previous knowledge of corals from the <strong>Solomon</strong>s exists. The only published coralspecies count by the 1965 Royal Expedition lists 87 species (Spalding et al., 2001). This curentsurvey is the most comprehensive coral survey conducted to date in the <strong>Solomon</strong> <strong>Islands</strong>.68
Coral Communities & Reef HealthMETHODSRapid Ecological <strong>Assessment</strong> (REA) surveys were conducted using SCUBA at 59 fringing reeflocations (Figure 1, Appendix 1) in May – June 2004. Locations, each of approx. 1 ha in total area,were selected to provide the broadest range of reef habitat types, developed in relation to differentenvironmental conditions (e.g. exposure, slope angle, depth). At most locations, deep and shallowsites (designated as site #.1 and #.2 respectively) were surveyed concurrently, representing thedeeper reef slope (> 10m depth) and the shallow slope, reef crest and flat (< 10m depth). Deep siteswere surveyed first, in accordance with safe diving practice, with the observers swimming initiallyto the maximum survey depth (usually 40-45 m), then working steadily into shallower waters. Intotal, 113 sites at the 59 locations were surveyed (Figure 1). The method was similar to thatemployed during biodiversity assessments in other parts of the Indo-West Pacific, Indonesia andAustralia (see e.g. DeVantier et al. 1998, 2000, DeVantier 2002, 2003, Turak 2002, Turak, 2003,Turak and Fenner 2002, Turak and DeVantier, 2003, Turak and Shouhoko 2003, Turak and Aitsi2003, Turak et al. 2003). It thus provides the opportunity for future comparisons of speciesdiversity, composition and community structure of these different areas in terms of their coralcommunities.At each site, the survey swim covered an area of approx. 5,000m 2 (ca. 50m x 100 m), such that eachsurvey location represented approx. one ha in total. Although 'semi-quantitative', this method hasproven far superior to more traditional quantitative methods (transects, quadrats) in terms ofbiodiversity assessment, allowing for the active searching for new species records at each site,rather than being restricted to a defined quadrat area or transect line (DeVantier et al. 1998, 2000).For example, the present method has regularly returned a two- to three-fold increase in coral speciesrecords in comparison with line transects conducted concurrently at the same sites (e.g. Red Sea,Great Barrier Reef).Two types of information were recorded on water-proof data-sheets during the ca. one and a halfhour SCUBA survey swims at each location:1. an inventory of species, genera and families of sessile benthic taxa (Appendices 2 and 3);and2. an assessment of the percent cover of the substrate by the major benthic groups and statusof various environmental parameters (Appendix 1, after Done 1982, DeVantier et al. 1998,2000).TAXONOMIC INVENTORIESA detailed inventory of sessile benthic taxa was compiled during each swim. Taxa were identifiedin situ to the following levels:• stony (hard) corals were identified to species level wherever possible (based on Veron andPichon 1976, 1980, 1982, Veron, Pichon and Wijsman-Best 1977, Veron and Wallace1984, Veron 1986, 1993, 1995, 2000, Hoeksema 1989, Wallace and Wolstenholme 1998,Wallace 1999, Veron and Stafford-Smith 2002), otherwise genus and growth form (e.g.Porites sp. of massive growth-form).• soft corals, zoanthids, corallimorpharians, anemones and some macro-algae were identifiedto genus, family or broader taxonomic group (Allen and Steene 1995, Colin and Arneson1995, Goslinger et al. 1996, Fabricius and Alderslade 2000);• other sessile macro-benthos, such as sponges, ascidians and most algae were usuallyidentified to phylum plus growth-form (Allen and Steene 1995, Colin and Arneson 1995,Goslinger et al. 1996).69
<strong>Solomon</strong> <strong>Islands</strong> <strong>Marine</strong> <strong>Assessment</strong> Technical ReportAt the end of each survey swim, the inventory was reviewed, and each taxon was categorized interms of its relative abundance in the community (Table 1). The categories reflect relative numbersof individuals in each taxon, rather than its contribution to benthic cover (DeVantier et al. 1998).For each coral taxon present, a visual estimate of the total amount of injury (dead surface area)present on colonies at each site was made, in increments of 0.1, where 0 = no injury and 1 = allcolonies dead. The approximate proportion of colonies of each taxon in each of three size classeswas also estimated. The size classes were 1 - 10 cm diameter, 11 - 50 cm diameter and > 50 cmdiameter (Table 1).Table 1. Categories of relative abundance, injury and sizes (maximum diameter) of each benthic taxon in thebiological inventories.Rank Relative abundance Injury Size frequency distribution0 absent0 - 1 inproportion of corals in each of1 rareincrements of 3 size classes:2 uncommon0.11) 1 - 10 cm3 common2) 11 - 50 cm4 abundant3) > 50 cm5 dominantTaxonomic CertaintyDespite recent advances in field identification and stabilizing of coral taxonomy (e.g. Hoeksema1989, Veron 1986, Wallace 1999, Veron 2000, Veron and Stafford-Smith 2002), substantialtaxonomic uncertainty and disagreement among different workers remains. This is particularly so inthe families Acroporidae and Fungiidae, with different workers each providing different taxonomicclassifications and synonymies for various corals (see e.g. Hoeksema 1989, Wallace 1999, Veron2000). In the present study, extensive use of digital underwater photography and collection ofspecimens of taxonomically difficult reef-building coral species were made to confirm fieldidentifications.Small samples, usually < 10 cm on longest axis, were removed from living coral colonies in situ,leaving the majority of the sampled colony intact. Living tissue was removed from the specimensby bleaching with household bleach. The dried specimens were examined and identified, as far aspossible to species level. Most of these specimens were identified on board the FeBrina, our surveyvessel, using all the above reference materials, resulting in a comprehensive list of reef-buildingcoral taxa for the area. Most specimens were left with the TNC office in Honiara as a basis for areference collection for the local researchers. Some specimens required additional detailed study,and were shipped to the Museum of Tropical Queensland, Australia.70
Coral Communities & Reef HealthFigure 1. Full study area showing all numbered locations. At all locations two sites were surveyed, each corresponding to deep (10m to maximum depth) and shallow.(minimum depth to 8m).71
<strong>Solomon</strong> <strong>Islands</strong> <strong>Marine</strong> <strong>Assessment</strong> Technical ReportBENTHIC COVER AND REEF DEVELOPMENTAt completion of each swim, six ecological and six substratum attributes were assigned to 1 of 6standard categories (Table 2), based on an assessment integrated over the length of the swim (afterDone 1982, DeVantier et al. 1998, 2000).Table 2. Categories of benthic attributes and % cover categoriesAttributeecological physical % coverHard coral Hard substrate not presentDead standing coral Continuous pavement 1 - 10 %Soft coral Large blocks (diam. > 1 m) 11 - 30 %Coralline algae Small blocks (diam. < 1 m) 31 - 50 %Turf algae Rubble 51 - 75 %Macro-algae Sand 76 - 100 %The sites were classified into one of four categories based on the amount of biogenic reefdevelopment (after Hopley 1982, DeVantier et al. 1998):1. Coral communities developed directly on non-biogenic rock, sand or rubble;2. Incipient reefs, with some calcium carbonate accretion but no reef flat;3. Reefs with moderate flats (< 50m wide); and4. Reefs with extensive flats (> 50m wide).The sites were also classified arbitrarily on the degree of exposure to wave energy, where:1. sheltered;2. semi-sheltered;3. semi-exposed; and4. exposed.The depths of the sites (maximum and minimum in m), average angle of reef slope to the horizontal(estimated visually to the nearest 10 degrees), and underwater visibility (to the nearest m) were alsorecorded. The presence of any unique or outstanding biological features, such as particularly largecorals or unusual community composition, and evidence of impacts, were also recorded, such as:• sedimentation;• blast fishing;• poison fishing;• anchoring;• bleaching impact;• crown-of-thorns seastars predation;• Drupella snails predation; and• coral diseases.Digital underwater photos were taken of sampled corals for which field identifications wereuncertain, and of the representative coral community types. All data were input to EXCELspreadsheets for storage and preliminary analysis.COMMUNITY TYPESSite groups defined by community type were generated by hierarchical cluster analysis usingabundance ranks of all corals in the inventories. The analysis used Squared Euclidean Distance as72
Coral Communities & Reef Healththe clustering algorithm and Ward's Method as the fusion strategy to generate site groups of similarcommunity composition and abundance. Analyses were conducted on the raw (untransformed) data.The clustering results were plotted as a dendrogram to illustrate the relationships among sites interms of levels of similarity among the different community groups.CORAL INJURYEach coral species in the sites was assigned a score for its level of injury, from 0 – 1 in incrementsof 0.1 (from 0 for no injury to any colony of that species at that site to 1 where all colonies of thespecies were dead, see Methods above). Sites were compared for the amounts of injury to their coralcommunities, for the proportion of the total number of species present in each site that were injured,and the average injury to those coral species in each site.RESULTSBIODIVERSITY AND BIOGEOGRAPHYHard CoralsHard coral diversity was exceptionally high (Coral Diversity, this report). The two obviousexplanations were, the size of area covered (virtually most of the <strong>Solomon</strong>s) and the high diversityof reef habitats found and surveyed. On the other hand it was expected that species number shoulddiminish as we moved east away from the coral-triangle. But this proved not to be the case, at leastas far as the <strong>Solomon</strong> <strong>Islands</strong> were concerned. Most species had <strong>Solomon</strong>s wide distribution,indicating good connectivity between the islands. Over 90% of the total coral species were recordedin the North and West section only in the first half of the sites (Figure 2). Surveys in the south andeast added less than 10% to the total hard coral species compliment.500Cumulative species count450400Number of species3503002502001501005001 2 3 4 5 6 7 8 9 10 11 12 13 14 15 16 17 18 19 20 21 22 23 24 25 26 27 28 29 30 31 32 33 34 35 36 37 38 39 40 41 42 43 44 45 46 47 48 49 50 51 52 53 54 55 63 64 65 66SitesMost coral genera were well represented, with exception of Alveopora, where only 4 out of 11known species were recorded and of those recorded only a few colonies were seen. In addition anumber of monospecific genera were not found during this survey. These are relatively rare genera73
<strong>Solomon</strong> <strong>Islands</strong> <strong>Marine</strong> <strong>Assessment</strong> Technical Reportand were: Catalaphyllia, Nemenzophyllia, Heterocyathus, Heteropsammia, Oulastrea, Moseleya,Stylaraea and Duncanopsammia. Of these the first 5 have been known to occur in the <strong>Solomon</strong>s.The next two, Moseleya and Stylaraea are found in the area. The closest area that lastDuncanopsammia is known from is Southeast PNG. All these genera have very specific habitatrequirements and unless such specific habitats are not surveyed they will likely to be missed.Therefore it is quite possible for the last three genera to be found in the <strong>Solomon</strong>s.To date, the <strong>Solomon</strong>s survey has yielded the second highest coral species count (485 species) fromone study anywhere in the world. The highest count (487 with a cumulative total of 535) is from theRaja Ampat <strong>Islands</strong> (Turak and Shouhoko, 2003) in Papua province, Indonesia and is found in whathas been traditionally described as the Coral Triangle. Average site diversity was relatively high.However relative site richness was low, which is usually the case in areas of extreme high speciesrichness. Only 12% of all sites had 1/3 rd or more of the total species count for the <strong>Solomon</strong>s. On theother hand, overall mean hard coral cover (32%) was typical for the region (Table 3).Table 3. A comparison of coral diversity in the <strong>Solomon</strong>s and other Indo-West Pacific reef areas. . SOL –<strong>Solomon</strong> <strong>Islands</strong>; MB - Milne Bay, Papua New Guinea; EKB - East Kimbe Bay, Bismarck Sea; GBR - NGreat Barrier Reef, Australia; RA - Rajah Ampat area, Papua; BI - Banda Isl., Banda Sea, Maluku; W -Wakatobi area, S. Sulawesi; BNP - Bunaken National Park; ST - Sangihe-Talaud Isl.; DER – Derewan, EastKalimantan. GBR - Turak, 2001 unpublished data. * Is an estimate based on a combination of values for twodepths per site, ** Incorporates data of two observers. Total number of species data is field records only,except for Milne Bay which incorporates incomplete lab and museum based identification.ThisstudyTurakandFenner,2002Turak& Aitsi, Turak,2003 2001Turak&Souhoka, 2003Turak et Turak,al. 2002 2003Turak &DeVantier Turak,2003** 2002Turak,2004SOL MB EKB GBR RA BI W BNP ST DERTotal number ofspecies 485 393 351 318 487 301 387 380 445 444Average no. ofspecies per site 135 147 124 100* 131 106 124 155 100 164% of sites with over1/3 rd species 12 82 74 18 61 41 85 8 78Number of locationssurveyed 59 28 27 26 51 18 27 20 52 36Area covered(x1000 km 2 ) 120 15 1.1 0.8 30 0.4 10 0.9 23 20Average % hard coralcover 32 33.3 30 34.8 33 40.3 32 41 21.3 36Soft Corals and Other Benthic BiotaOverall soft coral diversity was high. Around half (46) of the known 90 genera of alcyonacea wererecorded. However with the exception of a few reef flat areas, abundance and occurrence was low.In the shallows Sarcophyton and Sinularia were the most common, whereas on the deeper slopesgorgonian fan corals were more common. The other octocoral with a hard skeleton, the organ pipecoral Tubipora musica was one of the more common non-scleractinian hard corals (Table 4).Of the azooxanthellate scleractinia, Tubastrea was uncommonly rare and the non-scleractinianfirecoral Millepora was found at only 2/3 rd of the sites and was never very abundant. The blue coralHeliopora was rarely encountered.74
Coral Communities & Reef HealthSponges were present at all sites and often in considerable abundance. Mostly rope, tube, encrustingand foliose forms were present. However the large barrel sponge Xestospongia, was less commonthan other parts visited in PNG and Indonesia.Giant clams of the family Tridacnidae were relatively rare, especially the largest Tridacna gigaswas seen only at 5 sites. The most common clams were T. maxima and T. squamosa. The crown ofthorns starfish was seen at 12 sites though many more sites showed evidence of their presence.Holothurians were rarely seen, averaging 1-2 animals per site. On none of the sites was macro-algaeabundant and seagrasses were rarely seen.75
<strong>Solomon</strong> <strong>Islands</strong> <strong>Marine</strong> <strong>Assessment</strong> Technical ReportTable 4. Non-scleractinian and azooxanthellate scleractinian hard corals, and soft corals recorded in 113 siteson reefs in the <strong>Solomon</strong> <strong>Islands</strong>. Y: present but number of sites not confirmed.Hard Corals Sites Soft Corals (cont.) Sites Others (cont.) SitesDendrophylliidae Xeniidae ZoanthidaeTubastrea micrantha 10 Anthelia 1 Palythoa 58Tubastrea coccinae 8 Cespitularia 5 Protopalythoa 19Tubastrea folkneri 3 Heteroxenia 3 Zoanthus 1Sensibia 3 Coralimorpharian 23Milleporidae Sympodium 2 Anemon 29Millepora dichotoma 34 Xenia 20 PlumulariidaeMillepora exesa 61 Briareidae Aglophenia 1Millepora intricata 20 Briareum 30Millepora platyphylla 1 Anthothelidae Sponge (other) 63Millepora tenella 16 Alertigorgia 3 Cliona 24Iciligorgia Carterospongia 36Stylastridae Solenocaulon Y Siphonochalina 1Distichopora 17 Supergorgiidae Xestospongia 25Annella Y encrusting 26Helioporidae Supergorgia Y foliose 25Heliopora coerolea 13 MelithaeidaeMelithaea21 AscidianTubiporidae Acanthogorgiidae Lissoclinum 10Tubipora musica 43 Acanthogorgia Y Diademnum 28Muricella Y Polycarpa 55Soft Corals Plexauridae TridacnidaeAlcyonacea Astrogorgia Y Tridacna crocea 22Clavulariidae Echinogorgia Tridacna gigas 5Clavularia 46 Euplexaura Y Tridacna squamosa 25Alcyoniidae Menella 2 Tridacna maxima 33Cladiella 2 Paracis Y Tridacna derasa 6Dampia 7 Paraplexaura Hipopus hipopus 6Klyxum 9 Villogorgia Y Trochus 4Lobophytum 44 Gorgoniidae Linckia 28Sarcophyton 92 Rumphella 27 Diadema 4Sinularia 89 Ellisellidae Culcita 31Sinularia brascica 17 Elisella 15 Acanthaster planci 12Sinularia lamellata 6 Junceella 13 Foraminifera 17Sinularia tree 10 Isididae Sargassum 1Nephtheidae Isis 6 Padina 7Capnella 20 Other gorgonians 26 Halimeda 76Dendronephthya 33 Pennatulacea Caulerpa serrulata 10Lemnalia 17 Virgulariidae Caulerpa racemosa 27Litophyton 2 Virgularia Y Chlorodesmis 10Nephthea 34 Dictyota 12Paralemnalia 56 Others Turbinaria ornata 7Scleronephthya 24 Antipathidae Halymenia floressi 9Stereonepthya 1 Antipathes 14 CRA 85Nidaliidae Cirrhipathes 12 Peyssonnelia 33Chironephthya 3 Halophila ovalis 3Nephthyigorgia 2 Halophila dicipens 1Siphonogorgia 3 Enhalus 476
Coral Communities & Reef HealthCORAL COMMUNITIESA cluster analysis of the hard coral species abundance data identified seven community types in 3 –4 subgroups of the main groups (Figure 3). The two main groups were shallow (two communitytypes) and mixed depth communities. Within the mixed depth group, two subgroups wereidentified, with one having two deep community types and the other of mixed depth communitytypes. Another, fifth community type of mixed depth was also noted.Within each subgrouping the two community types had in general similar characteristics (Figure 4),making sometimes difficult to distinguish between them clearly. Probably the main reasonclustering was not so tight (either along depth, geographic or habitat gradient), is because surveysites were extremely spread out over a large area and sufficient numbers of sites were not surveyedin the main distinct habitats types. However despite this some depth and geography related patternsare apparent (Figure 5).77
<strong>Solomon</strong> <strong>Islands</strong> <strong>Marine</strong> <strong>Assessment</strong> Technical ReportLinkage Distance0 1000 2000 3000 400065.249.254.248.26.241.246.27.25.231.227.224.23.251.250.253.252.22.263.244.217.216.218.211.29.266.235.229.028.239.232.238.236.222.243.21.214.214.112.245.220.226.225.213.217.116.126.145.19.18.247.247.130.040.233.221.240.133.121.125.120.119.16.137.14.115.215.144.154.131.128.127.17.146.122.13.165.124.15.12.153.151.163.152.150.143.135.149.141.136.148.138.139.166.123.118.113.111.110.18.132.134.234.123.210.255.064.237.264.142.242.14.219.21.1ABCMixedDEDeepFG MixedShallowDeep / MixedFigure 3. Hierarchical cluster analysis of 113 sites in 59 locations showing the 2 main groups of shallow anddeep / mixed, and two shallow, three deep and 2 mixed community types.78
Coral Communities & Reef HealthFigure 4. Summary of bottom cover estimates of major biotic groups found in seven community types.Numbers next to community types in legend are average hard coral species counts. Colour codingcorresponds to Figures 3 and 4, and Tables 5 and 6.79
<strong>Solomon</strong> <strong>Islands</strong> <strong>Marine</strong> <strong>Assessment</strong> Technical ReportFigure 5. Map of <strong>Solomon</strong> <strong>Islands</strong> survey sites and community types. For colour coding of community types refer to Figure 4, and Tables 5 and 6.80
Coral Communities & Reef HealthType A – Acropora, Pocilloporid, Massive Favids and Millepora Exposed Shallow WaterCommunity.This community was found on shallow reef flats exposed to strong wave action. Slope wasminimum and consolidated substrate was the highest (Table 5). There was highest hard substrate(94%) and turf algae (14%) cover and exposure rating. On the other hand, soft coral cover (1%) andunconsolidated substrate cover was the lowest (6%). Acropora, pocilloporids, favids and Milleporawere the most common hard corals, and Sinularia was the most common soft coral (Appendix 4, Iand II, Table 6). Encrusting coralline red algae were common and cover was among the highest ofall community types. This shallow water community was usually associated with deep communitytypes E and F (Figure 5). With type E it was usually found between Guadalcanal and south half ofIsabel, and far western <strong>Solomon</strong>s. With type F, was usually found at the far Southeast of <strong>Solomon</strong>s,in the east and north of Makira on reefs exposed to open Pacific Ocean waters and swells.Table 5. Site habitat and physical characteristics of seven community types identified in the cluster analysisin Figure 3.ShallowDeep / mixedMixed Deep MixedCommunity type A B C D E F GNumber of sites 18 18 14 15 15 20 14SiteMax. depth (m) 8 9 17 19 33 36 18Min. depth (m) 2 1 5 7 9 10 4Slope (degrees) 11 12 13 31 24 44 21Hard Substratum (%) 94 88 79 79 82 64 81BenthosHard coral (%) 34 47 38 36 22 13 38Soft Coral (%) 1 3 6 1 2 3 5Macro-algae (%) 4 3 3 7 3 3 3Turf-algae (%) 14 11 9 9 10 13 13Coralline algae (%) 15 13 8 4 10 15 7Dead coral (%) 1 4 1 1 1 1 9SubstratumContinuous pavement (%) 84 74 52 48 66 40 64Large blocks (%) 6 8 16 22 7 14 9Small blocks (%) 3 6 10 9 9 11 9Rubble (%) 3 8 6 6 10 21 10Sand (%) 3 3 15 15 7 16 9Visibility (m) 17 17 28.9 5 22 19 12Water temperature 3.3 2.7 2 1.3 2.1 1.5 1.9Reef development (1-4) 3.7 3.7 3 3.2 3.9 3.5 3.4Average no. of species 86 96 108 82 98 79 7181
<strong>Solomon</strong> <strong>Islands</strong> <strong>Marine</strong> <strong>Assessment</strong> Technical ReportType B – Table Acropora, Massive Favid, Millepora and Alcyonacea Shallow Water Communities.This community type was typical of shallow reef flats with an exposure rating somewhat less thantype A, minimal slope and highest hard coral (and dead coral) cover (Table 5). Coral speciesrichness was high and unconsolidated substrate cover low. Table and digitate Acropora, massivefavids and pocilloporids were the most common corals (Appendix 4, III). Also Millepora,alcyonacean soft corals, macro-algae Halimeda and crustose red algae were common (Table 6).Some sites with this type showed damage to table corals in the shallows from crown of thornsstarfish (COTS) infestations (Appendix 4, IV). This community was usually associated with deepcommunity type F (Figure 5), but also to some extent with mixed community C and deepcommunity E. This community associated with type F was mostly found around Morova Lagoonand around north Guadalcanal. Associated with type C, it was found only around Arnavon andNorthwest Isabel (Figure 5).Type C – Mixed Merulinid, Fungid, and Sponge and Alcynoacean Communities with Very HighSpecies Richness.This community type found sheltered and semi sheltered reefs in waters of moderate clarity. Hardcoral species richness was the highest, as well as soft coral cover (Table 5). Mixed speciesassemblages with merulinids and fungids were typical, with sponge and alcyonacean (Appendix 4,V) being also common (Table 6). When in deep this community was usually associated with type B,and when in shallow water, it was usually associated with the same, or F and D. It was mainlyfound around the northwest of Isabel and the Arnavon <strong>Islands</strong> (Figure 5).Type D – Mixed Astreopora, Lobophyllia, Alcyonacea and Sponge Sheltered Water Communities.This community was mostly found on the deeper reef slopes of highly protected bays and inletswith low underwater visibility. Reefs with this community type had lowest reef development valueand highest macro-algae cover (Table 5). Hard coral assemblages were mixed (Appendix 4, VI)with Astropora and Lobophyllia being the most common genera. Alcyonacean soft corals andsponges were also common (Table 6). This community type in deep water was usually associatedwith the same, or type G and D in shallow water (Figure 5). It was mostly found in the western halfof the <strong>Solomon</strong> <strong>Islands</strong> where higher number of very protected sites existed.Type E – Massive favid, pocilloporid, Acropora and alcyonacea clear deep water communities.This community was found on deep reef slopes with highest reef development and best underwatervisibility (Table 5). Hard coral species richness was relatively high, though hard coral cover waslow. Massive favids, pocilloporids and Acropora were the most common corals (Appendix 4, VIIand VIII). Alcyonacean corals as well as sponges and Millepora were also common (Table 6). Thisdeep community was predominantly associated with shallow community type A (Figure 5), but alsoto some extend with type B. It was mostly found around the southern half of Isabel, though somesites at the far west and east also had this community type.Type F – Agaricid, Massive Favid, Plating Pectinid and Gorgonian Communities on Steep DeepReef Slopes.This community type was found on the steepest and deepest slopes mostly in open and clear water.Hard substrate as well as hard coral cover was the lowest and unconsolidated substrate cover wasthe highest (Table 5). Hard coral species diversity was also low. Agaricids (Appendix 4, X),massive favids and plating pectinids, particularly Oxypora (Appendix 4, IX) were the most commoncorals. In addition gorgonian fans, alcyonaceas and sponges were common (Table 6). Thiscommunity was usually associated with shallow community types B and A, but also a few timeswith types C and G. Community F was wide spread throughout the <strong>Solomon</strong> <strong>Islands</strong>, but to a lesser82
Coral Communities & Reef Healthextent in the west. In association with type A, it was found mostly around Makira and in associationwith B, it was found mostly around the central area, particularly Morova (Figure 5).Table 6. Species attributes of the seven coral community types in the <strong>Solomon</strong> <strong>Islands</strong>, May-June 2004. Thetop ten hard coral species and top ten other benthic taxa recorded are listed. sites: number of sites where taxawas found, abn: accumulated abundance for all sites. Species showing relatively high fidelity to particularcommunities are bolded. CRA: Coralline Red AlgaeA (18 sites) sites abn B (18 sites) sites abnPocillopora verrucosa 18 40 Acropora hyacinthus 18 38Acropora digitifera 18 37 Acropora millepora 18 36Hydnophora microconos 18 36 Acropora gemmifera 18 34Leptoria phrygia 18 35 Goniasatrea edwardsi 18 34Acropora humilis 18 34 Porites massive 17 39Platygyra verweyi 18 28 Stylophora pistillata 17 35Acropora palifera 17 37 Pocillopora verrucosa 17 33Pocillopora eydouxi 17 34 Fungia fungites 17 32Galaxea fasicularis 17 34 Hydnophora microconos 17 32Acropora robusta 17 33 Platygyra ryukyuensis 17 31CRA 16 47 Halimeda 14 34Millepora exesa 14 28 Sinularia 14 28Sinularia 14 22 Millepora exesa 14 27Palythoa 13 22 CRA 13 37Tridacna maxima 13 13 Sarcophyton 13 26Sarcophyton 12 21 Millepora dichotoma 12 20Halimeda 11 24 Tridacna maxima 12 17Lobophytum 11 18 Nephthea 11 23Polycarpa 8 14 Palythoa 10 17Distichopora 7 11 Diademnum 9 17C (14 sites) sites abn D (15 sites) sites abnGoniasatrea pectinata 14 28 Pachyseris speciosa 15 28Hydnophora rigida 14 24 Porites massive 14 34Ctenactis crassa 14 22 Astreopora myriophthalma 14 28Porites massive 13 27 Scolymia vitiensis 13 28Merulina ampliata 13 25 Pectinia alcicornis 13 25Pocillopora damicornis 13 23 Leptastrea transversa 13 25Lobophyllia hemprichii 13 21 Merulina ampliata 13 23Echinopora mammiformis 13 21 Lobophyllia hemprichii 13 22Fungia paumotensis 13 20 Cyphastrea serailia 13 21Herpolitha limax 13 20 Physogyra lichtensteini 13 19Halimeda 13 27 Sarcophyton 11 17Sponge 11 24 Sinularia 10 17Sarcophyton 10 20 CRA 9 20Sinularia 9 19 Sponge 9 18Lobophytum 9 16 Halimeda 9 16Caulerpa racemosa 8 17 Culcita 9 11Millepora exesa 8 15 Peyssonnelia 7 18Carterospongia 7 16 Sinularia brascica 6 13CRA 7 16 Xestospongia 6 7Clavularia 7 14 Caulerpa racemosa 5 1083
<strong>Solomon</strong> <strong>Islands</strong> <strong>Marine</strong> <strong>Assessment</strong> Technical ReportTable 6 (cont.). . Species attributes of the seven coral community types in the <strong>Solomon</strong> <strong>Islands</strong>, May-June2004. The top ten hard coral species and top ten other benthic taxa recorded are listed. sites: number of siteswhere taxa was found, abn: accumulated abundance for all sites. Species showing relatively high fidelity toparticular communities are bolded. CRA: Coralline Red AlgaeE (15 sites) sites abn F (20 sites) sites abnStylophora pistillata 15 30 Pavona varians 20 34Pocillopora verrucosa 15 28 Goniasatrea pectinata 19 35Platygyra daedelea 15 28 Pachyseris speciosa 19 31Favia matthai 15 27 Favites russelli 19 25Fungia paumotensis 15 22 Porites massive 18 34Porites vaughani 14 28 Merulina ampliata 18 26Goniasatrea pectinata 14 25 Porites vaughani 17 32Acropora palifera 14 24 Cyphastrea microphthalma 17 28Montastrea curta 14 24 Oxypora lacera 17 24Acropora divaricata 14 23 Physogyra lichtensteini 17 20Sarcophyton 15 27 Sarcophyton 19 31Sinularia 14 26 CRA 18 47Millepora exesa 13 25 Sponge 16 32Paralemnalia 13 24 Sinularia 16 26CRA 12 34 Paralemnalia 15 28Halimeda 12 26 Gorgonian 13 28Dendronephthya 12 18 Peyssonnelia 13 26Polycarpa 10 19 Clavularia 13 25Palythoa 10 15 Tubipora musica 12 21Clavularia 9 18 Halimeda 10 22G (14 sites)sites abnPorites cylindrica 12 27Diploastrea heliopora 12 17Porites massive 11 29Porites rus 11 20Porites vaughani 11 20Pavona varians 11 18Herpolitha limax 11 14Acropora millepora 10 19Acropora formosa 10 18Favia favus 10 16Sarcophyton 12 22Sinularia 11 21Sponge 11 21CRA 10 22Palythoa 10 14Polycarpa 9 15Linckia 8 14Paralemnalia 8 12Sponge foliose 7 15Millepora dichotoma 7 1484
Coral Communities & Reef HealthType G – Porites, Massive Favid, Fungid, Agaricid, Alcyonacea and Sponge Communites of MixedDepth and Low Species Richness.Type G was a loosely defined community with a mixture of characteristics and coral assemblages,and was found in both shallow and deeper waters. Although generally found on reefs in veryprotected locations with low underwater visibility, a number of sites with this community type wasfound in relatively clearer waters. The common characteristic of sites with this community type isthat they had the most significant amount of coral damage, mostly due to crown of thornsinfestations. Overall hard coral species richness was the lowest and dead coral cover (Appendix 4,XI) the highest (Table 5). Most common corals were Porites (mostly massive and encrusting forms,but also some branching), massive favids, fungids and agaricids (Appendix 4, XII). In additionalcyonacean soft corals, sponges and Millepora were common (Table 6). This community wasfound usually in association with deep communities of the same type or types D and F (Figure 5).REEF CONDITIONOverall reef health in the <strong>Solomon</strong>s was good. Most reefs visited were not impacted by humanactivities, which are usually of concern in other areas of the region. The main cause of reef damagewas from crown of thorns starfish (COTS) infestations. The coral eating snail Drupella, whichwhen in full outbreak can cause serious damage to reefs, was seen at most locations. Howevernumbers were always very low and damage very limited. In addition some evidence of damagefollowing bleaching events in 2000-2001 was observed, as well as some minor current bleachingdamage. Clear evidence of blast fishing damage was only seen at one site (Site 19.2). However atseveral other locations there was evidence of possible old damage from destructive fishing practices(SE Choisel, NE Guadalcanal, and Florida <strong>Islands</strong>, particularly at Nughu Island).During surveys we generally avoided sampling reefs and areas that were potentially known to beimpacted by sedimentation, in particular due to land based activities such as logging and clearfelling for oil-palm plantation development. However at some locations terrigenous sediment onreefs was seen and some impact was observed. This was strongest in Morova lagoon especially atthe near coast site (site 37).Evidence of coral disease was occasionally seen though without widespread effect. However at onesite (site 36), which is one of the popular tourist dive sites, significant mortality was seen with somediseased corals. Anecdotal information from locals indicated that a gradual spread of mortality wasnoted in the area over the last two years, which could possibly be the result of a coral pathogen.With the few exceptions of COTS damage most mortality was old and therefore it was not possibleto identify detailed taxonomic level impact. The few sites that showed moderate to high levels ofdamage were mostly COTS affected and involved limited number of taxa (Figure 6).Coral BleachingSome damage from the Pacific bleaching events in 2000-2001, was reported for the <strong>Solomon</strong><strong>Islands</strong> (Spalding et al., 2001, Wilkinson, 2002). It has been reported that damage was patchy,mostly on the western islands and that in some areas Acropora corals were particularly affected.The 2000-2001 bleaching event is known to have caused wide spread in some areas (Fiji) extensivedamage to coral reefs in the south and west Pacific (Wilkinson, 2000 and 2002). However it appearsthat reefs closer to the equator, such as in PNG and the <strong>Solomon</strong>s, were spared the worst. Althoughinformation from the <strong>Solomon</strong>s about the bleaching event is limited, this survey confirmed thatdamage from the 2000-2001 bleaching was overall limited and patchy and less extensive incomparison to places like Fiji. It is possible that Malaita, in particular the east coast and northern tipsuffered the most from the bleaching.85
<strong>Solomon</strong> <strong>Islands</strong> <strong>Marine</strong> <strong>Assessment</strong> Technical ReportFigure 6. Scatterplot of the average injury per species versus proportion of injured species in each of 113sites, <strong>Solomon</strong> <strong>Islands</strong>, May – June 2004. 71 sites (in circle, 62 % of total) recorded no damage. Sites withmoderate or serious damage are numbered. Red lozenges and numbers are sites with COTS damage. Bluelozenges are non-specified other damage.Crown of Thorns StarfishThere was evidence of above natural densities of COTS at most survey sites. On 1/3 rd of the sites atleast several COTS and related coral mortality was seen. At eight sites (sites: 23.2, 32.2, 34.1, 34.2,53.2, 55, 63.2 and 66.2) over 40 COTS were counted during one dive and damage to corals wassevere. Highest numbers of COTS and associated damage was seen at sites on reefs where otherstresses were present. Such as near human habitation, pollution (rubbish), high sediment levels, divesites. Although at this stage there is not a severe widespread outbreak killing wide tracks of reef, thepotential is there for this to happen. Current low levels are nevertheless causing significantmortality and stress to reefs, reducing their fattiness. One particular site (Site 66, Appendix 4, IV)on Mary Shoal in NW Guadalcanal, which would have been one of the most beautiful reef flat sites,was severely damaged by an active COTS outbreak. This site with one hundred percent cover ofmainly diverse Acropora corals will most likely be totally dead in the coming months / year.ARTIFICIAL REEF ISLANDS (SULUFOU) IN LAU’ALO PASSAGEHuman settlements on artificial islands built on shallow reef flat are relatively common on MalaitaIsland, particularly in Lau’ola Passage at the north. The main foundation material for these islandsis reef rock, which is collected as dead or live coral blocks / colonies. Most collection is done onpatch reefs where islands are built. There were many islands of various stages of building. Whilesome were in the first stages of building, others appeared to be many decades and perhaps a 100 ormore years old (Figure 7). They were very large and covered in vegetation, with some very largetrees. These villages will often start with one hut built by one family and over the years as the86
Coral Communities & Reef Healthfamily grows, can expand to large islands with many dozens of houses and other usual villageconstruction and amenities, such as a church, cemetery, etc.Figure 7. Taoliabu Village / Island, one of the many artificial reef islands called “Sulufou”, in Lau’olaPassage, north Malaita.With the current level of information it was difficult to estimate the impact of the collection of reefmaterial, particularly live coral colonies, might have on the health of reef communities and theintegrity of reef structure. The Lau’ola Passage is an area of extensive and very shallow reef flats,well protected from potentially destructive oceanic swells. In general, reefs in this area appear to behealthy and flourishing, and most reef tops have possibly attained their maximum height relative tosea level. Therefore, as long as removal of reef material does not exceed accretion rate, the impacton reef health may be at the worst limited, if not somewhat positive (by stimulating new growththrough the lowering of reef flat level). However, anecdotal information suggests that in the last 10-20 years there has been a significant increase in the rate of new reef island building and theexpansion of the older ones, which may lead to problems in the future.In other areas of Malaita, coral rock (collected both living and dead) is used extensively as buildingmaterial, especially around the sea side of coastal constructions as foundation and protection walls.Such constructions were seen in at many coastal settlements around Malaita, particularly thosefound in lagoons and not on exposed coastland, like Langalanga lagoon and Auki town on the westside of Malaita.87
<strong>Solomon</strong> <strong>Islands</strong> <strong>Marine</strong> <strong>Assessment</strong> Technical ReportDISCUSSIONReefs of the <strong>Solomon</strong> <strong>Islands</strong> were diverse with rich and relatively healthy communities. The mostunusual reef communities were found in the many fjord like coastal formations typical of thesouthern coasts of Isabel and Choiseul <strong>Islands</strong>. Overall coral diversity was very high, which makesthe <strong>Solomon</strong> <strong>Islands</strong> comparable to countries in the ‘Coral Triangle’. The high species number forhard corals is partly due to the fact that the coral list was compiled by two workers working on thetaxonomy jointly. This would have added about 10% additional species to the overall list. Howeverthe major reasons for this high diversity was primarily high habitat diversity and the large area ofsampling. Most corals found in the central Indo-Pacific were also recorded in the <strong>Solomon</strong>s. Thisincludes around 120 species with range extensions from the central Indo-Pacific and PNG (CoralDiversity, this report).Coral communities found in very sheltered inlets were of particular interest. These communities hadhigh species richness with diverse assemblages, large stands and /or high abundance of someunusual or rare species (such as Acropora multiacuta at Site 14). However, despite the presence ofsome extensive monospecific stands, very large (old age) coral colonies were not very common.This may be an indication of the high turnover of the reef ecosystem in the <strong>Solomon</strong>s. Howeveradequate numbers of small coral recruits were seen at all sites, including those that were damaged.This would indicate good replenishment (good connectivity) and good recovery capacity, thereforegood health.Some of the targeted reef fisheries species were low in abundance or virtually absent. The mainones were; the giant clams, in particular the largest Tridacna, gigas (only 5 individuals were seenduring the whole survey), Trochus, sea cucumbers, and the ‘Green Snail’ (Fisheries Resources:Commercially Important Macroinvertebrates, this report).CONSERVATIONThere are a number of current and potential future threats to reef ecosystems in the <strong>Solomon</strong>s. Mosttypes of impacts seen on <strong>Solomon</strong> reefs, are the types that have and are causing serious damage toreefs elsewhere in the world, including in the central Indo-Pacific countries, such as Philippines,Indonesia, Malaysia, Thailand and to some extent PNG. However the reason reefs are in relativelybetter condition here is that the level of impact is much less as a result of lower population densitiesand relatively simpler life styles. But <strong>Solomon</strong>s have one of the highest population growth rates(Spalding et al., 2001) in the region. So, pressure on reef resources will increase rapidly.Destructive fishing methods, over harvesting of major target reef species, collection of live coral forlime production, clear felling for oil-palm plantations will all begin to have a serious negativeimpact on the reef ecosystems of the <strong>Solomon</strong>s in the future. A rough estimate four years ago givesa potential total of live Acropora collection for lime production (needed for betel nut chewing) ataround 10 thousand tons per year (Spalding et al., 2001). With the current population growth ratesthis figure will be expected to grow significantly, perhaps making this practice one of the largestthreats to reefs of the <strong>Solomon</strong> <strong>Islands</strong>. The same concern applies to the usage of reef rock forconstruction material. Currently we do not have sufficient information to make estimates ofpossible loads and significance to the reef habitat and structure. It is important to carry out researchin this area to measure the significance of the potential impact and what future projections may be.From an ecological and biodiversity perspective, the fjord like coastline on the south coast of Isabeland Choiseul, and the islands of the Shortlands group are of great interest and worth highconsideration for conservation. In addition, the Russell <strong>Islands</strong> were of interest to a second degree.88
Coral Communities & Reef HealthAn area of particular interest is the northeast tip of Malaita Island. More precisely, Lau’alo Passageand Maana’oba Island, Northeast Malaita. I was not able to dive in this area, but visited the passageand island, particularly the artificial reef island villages. These structures reflect a unique culture inMalaita, and the habitants livelihood is strongly linked with the reef and its resources. I suspect thepassage to the harbour supports unique coral community types. This was also an area of extremelylarge seagrass beds, perhaps the largest in the <strong>Solomon</strong>s (Seagrasses, this report). I recommend thatin the future comprehensive studies be carried out on the reefs and their ‘occupants’ of Lau’aloPassage and Maana’oba Island, as this area may prove to be one of the special spots in the<strong>Solomon</strong>s.We did not visit the far off islands and atolls of the <strong>Solomon</strong>s: Ontong Java atoll, Rennel Island,Indispensable reefs and Santa Cruz <strong>Islands</strong>. These areas are geologically, oceanographically andclimatologically different from the rest of the <strong>Solomon</strong>s, and are therefore expected to supportdifferent coral communities. The biodiversity of the <strong>Solomon</strong> <strong>Islands</strong> will not be complete withoutsurveys of these areas.89
<strong>Solomon</strong> <strong>Islands</strong> <strong>Marine</strong> <strong>Assessment</strong> Technical ReportREFERENCESAllen, G.R., and R. Steene. 1994. Indo-Pacific Coral Reef Field Guide. Tropical Reef Research378pp.Brodie, J and E. Turak. 2004. Land use practices in the Stettin Bay catchment area and their relationto the status of the coral reefs in the Bay. Australian Canter for Tropical FreshwaterResearch Report No. 04/01.Colin, P.and C. Arneson. 1995. Tropical Pacific Invertebrates. Coral Reef Press, California, USA,296pp.DeVantier, L.M., G. De’Ath, T.J. Done, and E. Turak. 1998. Ecological <strong>Assessment</strong> of a complexnatural system: A case study from the Great Barrier Reef. Ecological Applications 8: 480-496.DeVantier, L.M., Turak, E., Al-Shaikh, K.A. and G. De’Ath. 2000. Coral communities of thecentral-northern Saudi Arabian Red Sea. Fauna of Arabia 18: 23-66.Done, T. J. 1982. Patterns in the distribution of coral communities across the central Great BarrierReef. Coral Reefs 1: 95-107.Fabricius, K. and P. Alderslade. 2000. Soft Corals and Sea Fans A comprehensive guide to thetropical shallow-water genera of the Central-West Pacific, the Indian Ocean and the RedSea. Australian Institute of <strong>Marine</strong> Science, Townsville, Australia, 264pp.Goslinger, T.M., Behrens, D.W. and G.C. Williams. 1996. Coral Reef Animals of the Indo-Pacific.Sea Challengers publ., Monteray, California, 314pp.Hoeksema, B.W. 1989. Taxonomy, phylogeny and biogeography of mushroom corals (Scleractinia:Fungiidae). Zoologische Verhandelingen 254, 295pp.Hopley, D. 1982. The Geomorphology of the Great Barrier Reef: Quaternary Development of CoralReefs. John Wiley-InterScience, New York, 453p.Spalding, M.D., Ravilious, C. & Green, E.P. 2001. World Atlas of Coral Reefs. Prepared at theUNEP World Conservation Monitoring Centre. University of California Press, Berkeley,USA.Turak, E. and Fenner, D. 2002. Hard Corals of Milne Bay Province, Papua New Guinea. In, RAPworking papers, Conservation International, Washington, DC.Turak, E. 2002. <strong>Assessment</strong> of coral biodiversity and coral reef health of the Snagihe-Talaud<strong>Islands</strong>, North Sulawesi, Indonesia, 2002. Final Report to The Nature Conservancy.Turak, E. 2003. Coral Reef Surveys During TNC SEACMPA RAP of Wakatobi National Park,Southeast Sulawesi, Indonesia, May 2003. Final Report to The Nature Conservancy.Turak, E. and Aitsi, J. 2003. <strong>Assessment</strong> of coral biodiversity and status of coral reefs of EastKimbe Bay, New Britain, Papua New Guinea, 2002. Final Report to The NatureConservancy.Turak, E. and L.M. DeVantier. 2003. Corals and coral communities of Bunaken National Park andnearby reefs, North Sulawesi, Indonesia: Rapid ecological assessment of biodiversity andstatus. Final Report to the International Ocean Institute Regional centre for Australia andwestern Pacific.Turak, E. and J. Shouhoka. 2003. Coral diversity and status of the coral reefs in the Raja Ampatislands, Papua province, Indonesia, November 2002. Final Report to The NatureConservancy.Turak, E., Wakeford, M. and Done, T.J. 2003. Banda <strong>Islands</strong> rapid ecological assessment, May2002: <strong>Assessment</strong> of coral biodiversity and coral reef health. In, Mous PJ (ed), Report on arapid ecological assessment of the Banda <strong>Islands</strong>, Maluku, Eastern Indonesia, held April 28– May 5 2002, TNC and UNESCO publication, 150pp.Turak, E. and L.M DeVantier. 2003. Capacity Building in coral biodiversity surveys and coralidentification. Final Report to the International Ocean Institute (Australia).Veron, J.E.N. 1986. Corals of Australia and the Indo-Pacific. Sydney and London: Angus andRobertson, Australia, 644pp.Veron, J.E.N. 2000. Corals of the World. 3 Vols. Australian Institute of <strong>Marine</strong> Science.90
Coral Communities & Reef HealthVeron, J.E.N. and M. Pichon. 1976. Scleractinia of Eastern Australia. Part I. FamiliesThamnasteriidae, Astrocoeniidae, Pocilloporidae. Australian Institute of <strong>Marine</strong> ScienceMonograph Series 1, 86pp.Veron, J.E.N. and M. Pichon. 1980. Scleractinia of Eastern Australia. Part III. FamiliesAgaraciidae, Siderastreidae, Fungiidae, Oculinidae, Merulinidae, Mussidae, Pectiniidae,Caryophylliidae, Dendrophylliidae. Australian Institute of <strong>Marine</strong> Science MonographSeries IV, 471pp.Veron, J.E.N. and M. Pichon. 1982. Scleractinia of Eastern Australia. Part IV. Family Poritidae.Australian Institute of <strong>Marine</strong> Science Monograph Series V, 210pp.Veron, J.E.N. and C.C. Wallace. 1984. Scleractinia of Eastern Australia. Part V FamilyAcroporidae. Australian Institute of <strong>Marine</strong> Science Monograph Series VI, 483pp.Veron, J.E.N., Pichon, M., and M. Wijsman-Best. 1977. Scleractinia of Eastern Australia. Part II.Families Faviidae, Trachyphyllidae. Australian Institute of <strong>Marine</strong> Science MonographSeries III, 233.Veron, J.E.N. and Stafford-Smith, M 2002. Coral ID An electronic key to the zooxanthellatescleractinian corals of the World Australian Institute of <strong>Marine</strong> Science.Wallace, C.C. 1999. Staghorn Corals of the World. CSIRO publ., Australia, 421pp.Wallace, C.C. 1999. Staghorn Corals of the World An electronic key to the genus Acropora.Museum of Tropical Queensland.Wilkinson, C. 2000. Status of Coral Reefs of the World: 2000. Australian Institute of <strong>Marine</strong>Science. Australia. 364 pp.Wilkinson, C. 2002. Status of Coral Reefs of the World: 2002. Australian Institute of <strong>Marine</strong>Science. Australia. 378 pp.91
<strong>Solomon</strong> <strong>Islands</strong> <strong>Marine</strong> <strong>Assessment</strong> Technical ReportAPPENDICESAppendix 1. Details of sites surveyed in the <strong>Solomon</strong> <strong>Islands</strong>, May-June 2004. GPS locations using WGS 84 datum. Site #.1 - deep. Site #.2- shallow.LocationSite NameSite NumberMaximumMinimumSlopeHard substrateHard coralSoft coralMacro algaeTurf algaeCoralline algaeDead coralContinuous pavementLarge blocksSmall blocksRubbleSandExposureReef develop.AspectVisibilityWater temp.Distance (m)LatitudeLongtitudeTOTAL SPECIESFlorida Sandfly FL 1.1 30 10 30 70 20 2 5 10 10 5 40 20 10 15 15 2 4 N 10 30 100 9°2.138 160°6.323 77<strong>Islands</strong>Florida Sandfly FL 1.2 8 1 10 90 40 2 10 10 20 20 70 10 10 5 5 2 4 N 10 30 150 9°2.138 160°6.323 92<strong>Islands</strong>Florida Kombuana 2.1 30 10 20 90 20 1 1 5 10 2 80 0 10 10 0 2 4 N 25 30 100 8°50.58 160°2.027 102<strong>Islands</strong>Florida Kombuana 2.2 8 2 5 95 30 2 1 10 10 2 95 0 0 0 5 3 4 N 20 30 150 8°50.58 160°2.027 64<strong>Islands</strong>Isabel Buala 3.1 30 10 20 60 20 1 3 10 5 1 30 10 20 20 20 3 4 N 8 29 100 8°8.732 159°38.085 96Isabel Buala 3.2 10 3 5 95 70 2 5 10 10 5 95 0 0 5 0 4 4 N 8 29 150 8°8.732 159°38.085 55Isabel Tatamba 4.1 27 10 40 90 10 1 40 10 10 2 70 20 0 5 5 1 4 S 3 29 50 8°25 159°47 60Isabel Tatamba 4.2 8 1 10 100 70 1 20 5 5 2 100 0 0 0 0 2 4 S 5 29 50 8°25 159°47 48Isabel Tanabafe 5.1 38 10 30 70 20 1 1 5 10 0 30 20 20 30 0 2 4 S 18 29 100 8°21.101 159°26.461 94Isabel Tanabafe 5.2 8 3 5 100 30 1 1 10 10 0 100 0 0 0 0 4 4 S 15 29 100 8°21.101 159°26.461 75Isabel Popongori 6.1 26 10 40 80 30 2 1 5 5 2 40 25 5 15 5 1 4 SW 3 29 50 8°12.306 159°13.835 82Isabel Popongori 6.2 8 1 5 100 70 1 3 10 5 1 100 0 0 0 0 3 4 SW 4 29 100 8°12.306 159°13.835 114Isabel Sarao 7.1 43 10 30 90 20 1 0 5 10 0 80 5 5 10 0 2 4 S 15 29 100 8°0.37 158°54.758 83Isabel Sarao 7.2 8 2 5 100 20 1 0 10 10 0 100 0 0 0 0 4 4 S 15 29 150 8°0.37 158°54.758 76Isabel Palunuhukura 8.1 26 10 40 80 30 2 1 10 5 1 30 40 10 0 20 1 4 SW 8 29 50 7°50.789 158°43.319 71Isabel Palunuhukura 8.2 10 2 20 90 50 1 2 10 10 2 30 50 10 10 0 2 4 SW 5 29 150 7°50.789 158°43.319 141Isabel Isabel 9.1 19 10 10 70 30 5 2 10 10 0 30 20 20 5 25 2 4 SW 4 29 100 7°33.762 158°19.048 112Isabel Isabel 9.2 8 1 5 90 60 5 2 10 10 0 80 5 5 10 0 2 4 SW 6 29 100 7°33.762 158°19.048 101Isabel Kia 10.1 17 10 30 60 20 2 2 10 10 2 30 20 10 20 20 1 3 E 6 29 100 7°33.401 158°25.546 80Isabel Kia 10.2 8 1 5 70 30 2 3 5 5 2 60 5 5 20 10 2 3 E 7 29 100 7°33.401 158°25.546 72Isabel Barora Fa 11.1 17 10 30 80 10 5 2 10 10 0 50 30 10 5 15 2 3 N 4 29 100 7°29.931 158°23.756 89Isabel Barora Fa 11.2 8 2 5 90 30 5 5 10 10 2 80 0 10 10 0 3 3 N 6 29 100 7°29.931 158°23.756 98Isabel Ghaghe 12.2 11 1 20 70 20 5 10 10 5 0 30 20 20 5 25 1 3 S 5 29 150 7°25.078 158°12.658 129Isabel Pt Praslin 13.1 37 10 30 95 10 1 1 5 15 0 30 50 15 0 5 1 3 SW 8 29 100 7°23.734 158°14.458 73Isabel Pt Praslin 13.2 8 1 5 100 20 20 2 5 5 0 100 0 0 0 0 2 3 SW 7 29 100 7°23.734 158°14.458 97Isabel Malaghara 14.1 17 8 5 30 30 1 2 5 5 0 20 0 10 10 60 1 2 NW 8 29 200 7°23.627 158°7.915 70Isabel Malaghara 14.2 8 2 5 80 60 1 2 5 5 0 70 5 5 10 10 2 2 NW 7 29 200 7°23.627 158°7.915 94Isabel Malakobi 15.1 23 10 30 100 20 1 2 10 10 0 90 5 5 0 0 2 4 W 25 29 100 7°21.289 158°3.266 8692
Coral Communities & Reef HealthLocationSite NameSite NumberMaximumMinimumSlopeHard substrateHard coralSoft coralMacro algaeTurf algaeCoralline algaeDead coralContinuous pavementLarge blocksSmall blocksRubbleSandExposureReef develop.AspectVisibilityWater temp.Distance (m)LatitudeLongtitudeTOTAL SPECIESIsabel Malakobi 15.2 8 2 5 100 20 1 1 10 10 0 100 0 0 0 0 3 4 W 25 29 100 7°21.289 158°3.266 93Arnavon Kerehikapa 1 16.1 26 10 20 80 30 1 5 10 10 1 50 20 10 5 15 1 4 SW 25 29 100 7°27.656 158°2.594 95<strong>Islands</strong>Arnavon Kerehikapa 2 16.2 8 1 10 90 40 1 5 10 10 1 80 5 5 10 0 2 4 SW 25 29 100 7°27.656 158°2.594 78<strong>Islands</strong>Arnavon Kerehikapa 2 17.1 29 10 20 60 20 40 10 10 10 0 30 25 5 5 35 2 4 W 25 29 100 7°28.48 158°2.874 101<strong>Islands</strong>Arnavon Kerehikapa 3 17.2 8 1 10 80 60 1 10 10 10 2 60 10 10 20 0 3 4 W 25 29 100 7°28.48 158°2.874 85<strong>Islands</strong>Choiseul Raverave 18.1 22 10 30 70 20 5 2 10 10 0 40 20 10 0 30 2 4 N 12 29 100 7°32.432 157°47.386 71Choiseul Raverave 18.2 8 1 5 90 60 10 5 10 10 0 50 30 10 5 5 3 4 N 12 29 100 7°32.432 157°47.386 87Choiseul Vealaviru 19.1 20 10 70 90 20 1 2 10 5 3 50 35 5 5 5 1 3 W 1 29 100 7°25.548 157°32.295 74Choiseul Vealaviru 19.2 8 2 5 90 50 1 1 10 5 5 70 15 5 10 0 2 3 W 5 29 100 7°25.548 157°32.295 89Choiseul Ndolola 20.1 26 10 60 80 10 2 1 10 5 1 40 35 5 5 15 1 3 E 5 29 100 7°24.862 157°25.041 83Choiseul Ndolola 20.2 8 1 5 95 50 5 5 10 10 2 60 20 15 5 0 2 3 E 8 29 100 7°24.862 157°25.041 108Choiseul Poro 21.1 23 10 40 80 20 5 8 10 5 0 40 35 5 10 10 1 3 N 5 29 100 7°21.388 157°16.713 99Choiseul Poro 21.2 8 1 10 90 60 3 3 10 5 1 70 15 5 10 0 2 3 N 5 29 100 7°21.388 157°16.713 86Choiseul Emerald 22.1 32 10 20 90 10 1 2 10 10 0 70 10 10 10 0 2 4 N 30 29 100 6°41.556 156°23.454 73Choiseul Emerald 22.2 8 1 5 100 80 2 3 5 5 1 100 0 0 0 0 3 4 N 25 29 100 6°41.556 156°23.454 91Choiseul Taro 23.1 30 10 70 80 10 2 1 10 10 3 70 5 5 20 0 1 4 E 15 29 100 6°41.684 156°24.052 63Choiseul Taro 23.2 8 1 5 80 60 2 5 10 10 5 70 5 5 10 10 2 4 E 15 29 100 6°41.684 156°24.052 74Choiseul Chirovanga 24.1 42 10 30 90 20 1 2 10 20 0 90 0 0 10 0 2 4 N 25 29 100 6°36.924 156°33.985 98Choiseul Chirovanga 24.2 8 2 5 100 10 1 1 30 20 0 100 0 0 0 0 4 4 N 20 29 100 6°36.924 156°33.985 58Choiseul Vurango 25.1 19 10 40 80 30 1 0 10 5 1 40 30 10 0 20 1 4 S 2 29 100 6°38.298 156°34.617 67Choiseul Vurango 25.2 8 1 5 95 60 1 0 10 5 2 80 10 5 0 5 2 4 S 5 29 100 6°38.298 156°34.617 100Shortland Haliuna 26.1 32 10 30 70 20 2 1 10 10 0 40 20 10 20 10 1 3 SW 5 29 100 6°55.266 156°6.263 132<strong>Islands</strong>Shortland Haliuna 26.2 8 1 5 95 70 2 1 10 5 0 80 10 5 5 0 2 3 SW 8 29 100 6°55.266 156°6.263 116<strong>Islands</strong>Shortland Rohae 27.1 10 30 70 20 1 0 10 10 0 70 0 0 30 0 2 4 E 35 29 100 7°0.568 156°4.118 87<strong>Islands</strong>Shortland Rohae 27.2 8 2 2 100 20 1 1 20 20 0 100 0 0 0 0 4 4 E 12 29 100 7°0.568 156°4.118 88<strong>Islands</strong>Shortland Tua 28.1 21 10 10 60 30 3 2 10 10 2 55 0 5 0 40 2 4 N 20 29 100 7°4.27 155°53.764 102<strong>Islands</strong>Shortland Tua 28.2 8 1 5 100 50 2 1 10 10 0 100 0 0 0 0 3 4 N 15 29 100 7°4.27 155°53.764 102<strong>Islands</strong>93
<strong>Solomon</strong> <strong>Islands</strong> <strong>Marine</strong> <strong>Assessment</strong> Technical ReportLocationSite NameSite NumberMaximumMinimumSlopeHard substrateHard coralSoft coralMacro algaeTurf algaeCoralline algaeDead coralContinuous pavementLarge blocksSmall blocksRubbleSandExposureReef develop.AspectVisibilityWater temp.Distance (m)LatitudeLongtitudeTOTAL SPECIESShortland Stirling 1 29 26 1 40 90 20 2 1 10 10 0 70 15 5 10 0 2 4 N 30 29 100 7°24.474 155°32.625 118<strong>Islands</strong>Shortland Stirling 2 30 16 1 30 60 30 1 3 10 0 2 0 40 20 10 30 1 2 N 2 29 100 7°24.68 155°32.843 67<strong>Islands</strong>New Georgia Vella Lavella 31.1 43 10 30 90 20 1 0 20 20 0 80 5 5 10 0 2 4 W 30 29 100 7°44.307 156°30.849 112New Georgia Vella Lavella 31.2 8 1 10 100 30 2 1 20 10 0 100 0 0 0 0 3 4 W 20 29 100 7°44.307 156°30.849 74New Georgia Njari 32.1 35 10 60 90 30 10 1 10 10 3 80 5 5 5 5 2 4 N 25 29 100 8°0.816 156°45.418 118New Georgia Njari 32.2 8 1 5 95 80 2 1 5 5 5 95 0 0 0 0 3 4 N 15 29 100 8°0.816 156°45.418 97New Georgia Nusazango 33.1 17 8 40 80 40 1 0 10 2 1 50 20 10 0 20 1 3 SW 3 29 100 8°18.893 157°13.365 99New Georgia Nusazango 33.2 8 1 5 90 70 0 0 10 0 2 70 15 5 5 5 2 3 SW 5 29 100 8°18.893 157°13.365 86New Georgia Roviana 34.1 35 10 20 80 30 30 0 10 5 5 60 10 10 15 5 2 3 NE 8 29 100 8°23.701 157°19.949 73New Georgia Roviana 34.2 8 1 5 95 5 1 0 60 10 70 95 0 0 5 0 3 3 NE 10 29 100 8°23.701 157°19.949 44New Georgia Penguin 35.1 45 10 90 100 10 1 0 10 20 0 100 0 0 0 0 2 3 W 30 29 100 8°38.711 157°48.207 94New Georgia Penguin 35.2 8 1 5 95 70 1 1 5 20 0 90 0 5 0 5 3 3 W 25 29 100 8°38.711 157°48.207 101New Georgia Uepi 36.1 43 10 80 100 5 10 1 20 20 2 100 0 0 0 0 2 3 N 20 29 100 8°25.557 157°57.128 79New Georgia Uepi 36.2 8 1 20 95 30 1 1 20 20 5 80 10 5 5 0 3 3 N 15 29 100 8°25.557 157°57.128 72New Georgia Vangunu 37.1 21 10 50 70 40 0 0 10 5 0 50 10 10 10 20 1 4 E 3 29 100 8°32.249 158°1.501 85New Georgia Vangunu 37.2 8 1 5 80 60 1 0 10 5 0 60 10 10 10 10 2 4 E 5 29 100 8°32.249 158°1.501 82New Georgia Minjanga 38.1 43 10 30 40 5 0 0 10 20 0 20 10 10 10 60 1 3 W 25 28 100 8°42.26 158°12.871 66New Georgia Minjanga 38.2 8 1 5 90 50 1 0 5 10 0 80 5 5 10 0 2 3 W 20 29 100 8°42.26 158°12.871 98New Georgia Mbili 39.1 30 10 90 80 5 2 0 20 20 0 65 5 10 10 10 1 3 NW 30 29 100 8°39.695 158°12.233 56New Georgia Mbili 39.2 8 1 60 80 40 2 0 10 20 3 70 5 5 15 5 2 3 NW 20 29 100 8°39.695 158°12.233 108Russell<strong>Islands</strong>Mbaisen 40.1 40 10 40 90 30 1 30 10 10 0 70 15 5 5 5 1 4 S 12 29 100 8°59.588 159°5.805 10294
Coral Communities & Reef HealthLocationSite NameSite NumberMaximumMinimumSlopeHard substrateHard coralSoft coralMacro algaeTurf algaeCoralline algaeDead coralContinuous pavementLarge blocksSmall blocksRubbleSandExposureReef develop.AspectVisibilityWater temp.Distance (m)LatitudeLongtitudeTOTAL SPECIESRussell Mbaisen 40.2 8 1 5 70 70 0 5 5 5 2 40 10 20 5 25 2 4 S 15 29 100 8°59.588 159°5.805 78<strong>Islands</strong>Russell Kovilok 41.1 40 10 90 100 5 5 0 20 30 0 100 0 0 0 0 2 2 NW 25 29 100 8°58.251 159°7.453 74<strong>Islands</strong>Russell Kovilok 41.2 8 1 70 100 10 2 0 10 40 0 100 0 0 0 0 3 2 NW 20 29 100 8°58.251 159°7.453 83<strong>Islands</strong>Russell Sunlight 42.1 41 10 30 70 5 2 0 20 10 5 40 10 20 30 0 1 3 N 30 28 100 9°7.248 159°9.409 59<strong>Islands</strong>Russell Sunlight 42.2 8 1 40 80 20 5 0 10 5 10 30 20 30 10 10 2 3 N 15 29 100 9°7.248 159°9.409 38<strong>Islands</strong>Russell Taina 43.1 44 10 30 60 20 1 0 10 20 0 20 20 20 35 5 2 4 N 30 29 100 9°8.003 159°8.188 88<strong>Islands</strong>Russell Taina 43.2 8 1 10 70 40 2 0 10 10 0 20 30 20 10 20 3 4 N 20 29 100 9°8.003 159°8.188 86<strong>Islands</strong>Guadalcanal Cormorant 44.1 44 10 30 90 30 3 10 10 10 1 40 10 40 10 0 2 4 S 15 28 100 9°50.262 160°54.229 134Guadalcanal Cormorant 44.2 8 2 5 95 5 1 3 30 20 5 80 10 5 0 5 3 4 S 12 28 100 9°50.262 160°54.229 112Guadalcanal Marapa 45.1 40 10 30 90 30 1 3 10 10 0 70 10 10 5 5 1 4 W 8 28 100 9°48.883 160°51.806 115Guadalcanal Marapa 45.2 8 1 5 80 40 1 2 10 10 5 40 20 20 5 15 2 4 W 8 29 100 9°48.883 160°51.806 108Makira Anuta 46.1 37 10 30 60 5 1 20 10 5 2 40 10 10 5 35 2 4 W 10 29 100 10°21.109 161°21.499 85Makira Anuta 46.2 8 1 5 90 10 1 30 20 10 3 50 30 10 5 5 3 4 W 10 29 100 10°21.109 161°21.499 74Makira Makira 47.1 21 10 20 50 10 1 5 10 0 0 10 20 20 5 45 1 2 W 6 29 100 10°28.497 161°30.605 75Makira Makira 47.2 8 1 5 70 40 1 5 10 0 0 40 20 10 5 25 2 2 W 6 29 100 10°28.497 161°30.605 47Makira Star 1 48.1 40 10 30 40 10 1 20 20 0 0 10 10 20 5 55 2 4 E 12 28 100 10°46.976 162°16.325 67Makira Star 1 48.2 8 1.5 3 95 30 1 20 20 5 0 90 0 5 0 5 3 4 E 10 28 100 10°46.976 162°16.325 104Makira Star 2 49.1 30 10 30 30 10 1 2 20 0 0 0 10 20 5 65 1 3 E 10 28 100 10°48.905 162°16.619 86Makira Star 2 49.2 8 0.5 5 80 60 2 5 10 5 0 40 15 5 15 5 3 3 E 6 28 100 10°48.905 162°16.619 102Makira Malaupaina 1 50.1 46 10 30 60 30 1 2 20 30 0 50 0 10 40 0 2 4 S 35 28 100 10°14.846 161°57.282 81Makira Malaupaina 1 50.2 8 3 5 90 60 2 2 5 30 0 70 10 10 10 0 3 4 S 35 28 100 10°14.846 161°57.282 93Makira Malaupaina 2 51.1 42 10 30 60 10 1 3 20 20 0 20 20 20 40 0 2 4 N 20 29 100 10°16.295 161°58.227 93Makira Malaupaina 2 51.2 8 1 5 95 30 1 3 10 20 0 80 10 5 5 0 3 4 N 20 28 100 10°16.295 161°58.227 119Makira Bio 52.1 50 10 40 50 20 1 3 10 20 0 20 20 10 50 0 1 4 W 35 28 100 10°11.198 161°40.615 108Makira Bio 52.2 8 1 5 95 60 1 2 5 20 0 90 0 5 0 5 3 4 W 30 28 100 10°11.198 161°40.615 89Makira Ugi 53.1 43 10 20 30 10 5 0 10 5 2 0 10 20 70 0 1 4 NW 20 28 100 10°17.389 161°43.178 85Makira Ugi 53.2 8 1 5 90 30 2 0 5 20 5 70 15 5 5 5 3 4 NW 20 28 100 10°17.389 161°43.178 90Malaita Komusupa 54.1 44 10 30 90 40 5 1 10 10 1 80 5 5 5 5 2 4 NW 20 29 100 9°24.37 161°11.378 10995
<strong>Solomon</strong> <strong>Islands</strong> <strong>Marine</strong> <strong>Assessment</strong> Technical ReportLocationSite NameSite NumberMaximumMinimumSlopeHard substrateHard coralSoft coralMacro algaeTurf algaeCoralline algaeDead coralContinuous pavementLarge blocksSmall blocksRubbleSandExposureReef develop.AspectVisibilityWater temp.Distance (m)LatitudeLongtitudeTOTAL SPECIESMalaita Komusupa 54.2 8 1 40 95 20 1 1 20 20 3 90 0 5 0 5 3 4 NW 15 29 100 9°24.37 161°11.378 105Malaita Umu 55 17 0.5 20 40 20 2 1 10 2 5 10 10 20 5 55 1 2 NW 6 29 100 9°29.224 161°15.13 84Florida Nughu 63.1 36 10 30 60 20 5 10 10 10 2 40 10 10 35 5 2 4 W 20 28 100 9°17.309 160°20.231 104<strong>Islands</strong>Florida Nughu 63.2 8 1 5 85 20 10 5 10 10 5 75 5 5 10 5 3 4 W 12 28 100 9°17.309 160°20.231 105<strong>Islands</strong>Florida Tulaghi 64.1 26 10 50 95 50 5 10 10 5 2 85 5 5 0 5 1 4 SW 12 29 100 9°5.864 160°11.534 64<strong>Islands</strong>Florida Tulaghi 64.2 8 0.5 10 100 80 2 2 5 5 5 90 5 5 0 0 2 4 SW 8 29 100 9°5.864 160°11.534 74<strong>Islands</strong>Guadalcanal Savo 65.1 28 10 10 85 30 2 1 10 5 1 50 30 5 5 10 2 2 W 25 28 100 9°7.074 159°47.123 119Guadalcanal Savo 65.2 8 0.5 5 80 30 2 2 20 5 1 50 25 5 5 15 3 2 E 20 28 100 9°7.074 159°47.123 83Guadalcanal Tambea 66.1 36 10 30 5 2 1 2 10 30 0 0 0 5 75 20 1 4 SE 20 28 100 9°15.09 159°40.596 49Guadalcanal Tambea 66.2 8 2 2 60 70 5 0 10 20 20 50 5 5 30 10 3 4 SE 20 28 200 9°15.09 159°40.596 8896
Coral Communities & Reef HealthAppendix 2. Detailed species records and abundance data for all survey sites. (Raw data, available inelectronic format only)Appendix 3. List of zooxenthelate scleractinian coral species recorded during <strong>Solomon</strong> REA in May-June,2004Family Astrocoeniidae Koby, 1890Genus Stylocoeniella Yabe and Sugiyama,1935Stylocoeniella armata (Ehrenberg, 1834)Stylocoeniella guentheri Bassett-Smith,1890Genus Palauastrea Yabe and Sugiyama, 1941Palauastrea ramosa Yabe and Sugiyama,1941Genus Madracis Milne Edwards and Haime,1849Madracis kirbyi Veron and Pichon, 1976Family Pocilloporidae Gray, 1842Genus Pocillopora Lamarck, 1816Pocillopora ankeli Scheer and Pillai, 1974Pocillopora damicornis (Linnaeus, 1758)Pocillopora danae Verrill, 1864Pocillopora elegans Dana, 1846Pocillopora eydouxi Milne Edwards andHaime, 1860Pocillopora kelleheri Veron, 2000Pocillopora meandrina Dana, 1846Pocillopora verrucosa (Ellis and Solander,1786)Pocillopora woodjonesi Vaughan, 1918Genus Seriatopora Lamarck, 1816Seriatopora aculeata Quelch, 1886Seriatopora caliendrum Ehrenberg, 1834Seriatopora dendritica Veron, 2000Seriatopora hystrix Dana, 1846Seriatopora stellata Quelch, 1886Genus Stylophora Schweigger, 1819Stylophora pistillata Esper, 1797Stylophora subseriata (Ehrenberg, 1834)Family Acroporidae Verrill, 1902Genus Montipora Blainville, 1830Montipora aequituberculata Bernard, 1897Montipora altasepta Nemenzo, 1967Montipora calcarea Bernard, 1897Montipora caliculata (Dana, 1846)Montipora capitata Dana, 1846Montipora capricornis Veron, 1985Montipora cebuensis Nemenzo, 1976Montipora confusa Nemenzo, 1967Montipora corbetensis Veron and Wallace,1984Montipora crassituberculata Bernard, 1897Montipora danae (Milne Edwards andHaime, 1851)Montipora deliculata Veron, 2000Montipora digitata (Dana, 1846)Montipora efflorescens Bernard, 1897Montipora floweri Wells, 1954Montipora foliosa (Pallas, 1766)Montipora foveolata (Dana, 1846)Montipora friabilis Bernard, 1897Montipora grisea Bernard, 1897Montipora hirsuta Nemenzo, 1967Montipora hispida (Dana, 1846)Montipora hodgsoni Veron, 2000Montipora hoffmeisteri Wells, 1954Montipora incrassata (Dana, 1846)Montipora informis Bernard, 1897Montipora mactanensis Nemenzo, 1979Montipora malampaya Nemenzo, 1967Montipora millepora Crossland, 1952Montipora mollis Bernard, 1897Montipora monasteriata (Forskäl, 1775)Montipora niugini Veron, 2000Montipora nodosa (Dana, 1846)Montipora plawanensis Veron, 2000Montipora peltiformis Bernard, 1897Montipora samarensis Nemenzo, 1967Montipora spongodes Bernard, 1897Montipora spumosa (Lamarck, 1816)Montipora stellata Bernard, 1897Montipora tuberculosa (Lamarck, 1816)Montipora turgescens Bernard, 1897Montipora turtlensis Veron and Wallace,198497
<strong>Solomon</strong> <strong>Islands</strong> <strong>Marine</strong> <strong>Assessment</strong> Technical ReportMontipora undata Bernard, 1897Montipora verriculosa Veron, 2000Montipora verrucosa (Lamarck, 1816)Montipora vietnamensis Veron, 2000Genus Anacropora Ridley, 1884Anacropora forbesi Ridley, 1884Anacropora matthai Pillai, 1973Anacropora pillai Veron, 2000Anacropora puertogalerae Nemenzo, 1964Anacropora reticulata Veron and Wallace,1984Anacropora spinosa Rehberg, 1892Genus Acropora Oken, 1815Acropora abrolhosensisVeron, 1985Acropora abrotanoides (Lamarck, 1816)Acropora aculeus (Dana, 1846)Acropora acuminata (Verrill, 1864)Acropora anthocercis (Brook, 1893)Acropora aspera (Dana, 1846)Acropora austera (Dana, 1846)Acropora awi Wallace and Wolstenholme,1998Acropora batunai Wallace, 1997Acropora bifurcata Nemenzo, 1971Acropora brueggemanni (Brook, 1893)Acropora carduus (Dana, 1846)Acropora caroliniana Nemenzo, 1976Acropora cerealis (Dana, 1846)Acropora chesterfieldensis Veron andWallace, 1984Acropora clathrata (Brook, 1891)Acropora convexa (Dana, 1846)Acropora cophodactyla (Brook, 1892)Acropora crateriformis (Gardiner, 1898)Acropora cuneata (Dana, 1846)Acropora cylindrica Veron and Fenner,2000Acropora cytherea (Dana, 1846)Acropora dendrum (Bassett-Smith, 1890)Acropora digitifera (Dana, 1846)Acropora divaricata (Dana, 1846)Acropora donei Veron and Wallace, 1984Acropora echinata (Dana, 1846)Acropora efflorescens (Dana, 1846)Acropora elseyi (Brook, 1892)Acropora exquisita Nemenzo, 1971Acropora florida (Dana, 1846)Acropora formosa (Dana, 1846)Acropora gemmifera (Brook, 1892)Acropora globiceps (Dana, 1846)Acropora grandis (Brook, 1892)Acropora granulosa (Milne Edwards andHaime, 1860)Acropora hoeksemai Wallace, 1997Acropora horrida (Dana, 1846)Acropora humilis (Dana, 1846)Acropora hyacinthus (Dana, 1846)Acropora indonesia Wallace, 1997Acropora inermis (Brook, 1891)Acropora insignis Nemenzo, 1967Acropora irregularis (Brook, 1892)Acropora jacquelineae Wallacew, 1994Acropora kimbeensis Wallace, 1999Acropora latistella (Brook, 1891)Acropora listeri (Brook, 1893)Acropora lokani Wallace, 1994Acropora longicyathus (Milne Edwards andHaime, 1860)Acropora loripes (Brook, 1892)Acropora lutkeni Crossland, 1952Acropora microclados (Ehrenberg, 1834)Acropora meridiana Nemenzo, 1971Acropora microphthalma (Verrill, 1859)Acropora millepora (Ehrenberg, 1834)Acropora monticulosa (Brüggemann, 1879)Acropora multiacuta Nemenzo, 1967Acropora nana (Studer, 1878)Acropora nasuta (Dana, 1846)Acropora nobilis (Dana, 1846)Acropora palifera (Lamarck, 1816)Acropora palmerae Wells, 1954Acropora paniculata Verrill, 1902Acropora pinguis Wells, 1950Acropora pichoni Wallace, 1999Acropora plana Nemenzo, 1967Acropora plumosa Wallace andWolstenholme, 1998Acropora polystoma (Brook, 1891)Acropora prostrata (Dana, 1846)Acropora pulchra (Brook, 1891)Acropora rambleri (Bassett-Smith, 1890)Acropora robusta (Dana, 1846)Acropora rosaria (Dana, 1846)Acropora samoensis (Brook, 1891)98
Coral Communities & Reef HealthAcropora sarmentosa (Brook, 1892)Acropora secale (Studer, 1878)Acropora selago (Studer, 1878)Acropora solitaryensis Veron and Wallace,1984Acropora spathulata (Brook, 1891)Acropora speciosa (Quelch, 1886)Acropora spicifera (Dana, 1846)Acropora subglabra (Brook, 1891)Acropora subulata (Dana, 1846)Acropora tenuis (Dana, 1846)Acropora teres (Verrill, 1866)Acropora turaki Wallace, 1994Acropora valenciennesi (Milne Edwardsand Haime, 1860)Acropora valida (Dana, 1846)Acropora vaughaniWells, 1954Acropora verweyi Veron and Wallace,1984Acropora willisae Veron and Wallace,1984Acropora yongei Veron and Wallace, 1984Genus Astreopora Blainville, 1830Astreopora cuculata Lamberts, 1980Astreopora expansa Brüggemann, 1877Astreopora gracilis Bernard, 1896Astreopora incrustans Bernard, 1896Astreopora listeri Bernard, 1896Astreopora myriophthalma (Lamarck,1816)Astreopora randalli Lamberts, 1980Astreopora suggesta Wells, 1954Family Euphilliidae Veron, 2000Genus EuphylliaEuphyllia ancora Veron and Pichon, 1979Euphyllia cristata Chevalier, 1971Euphyllia divisa Veron and Pichon, 1980Euphyllia glabrescens (Chamisso andEysenhardt, 1821)Euphyllia paraancora Veron, 1990Euphyllia yaeyamensis (Shirai, 1980)Genus Plerogyra Milne Edwards and Haime,1848Plerogyra simplex Rehberg, 1892Plerogyra sinuosa (Dana, 1846)Genus Physogyra Quelch, 1884Physogyra lichtensteini (Milne Edwardsand Haime, 1851)Family Oculinidae Gray, 1847Genus Galaxea Oken, 1815Galaxea acrhelia Veron, 2000Galaxea astreata (Lamarck, 1816)Galaxea fascicularis (Linnaeus, 1767)Galaxea horrescens (Dana, 1846)Galaxea longisepta Fenner & Veron, 2000Galaxea paucisepta Claereboudt, 1990Family Siderasteridae Vaughan and Wells, 1943Genus Pseudosiderastrea Yabe and Sugiyama,1935Pseudosiderastrea tayami Yabe andSugiyama, 1935Genus Psammocora Dana, 1846Psammocora contigua (Esper, 1797)Psammocora digitata Milne Edwards andHaime, 1851Psammocora explanulata Horst, 1922Psammocora haimeana Milne Edwards andHaime, 1851Psammocora nierstraszi Horst, 1921Psammocora obtusangula (Lamarck, 1816)Psammocora profundacella Gardiner, 1898Psammocora superficialis Gardiner, 1898Genus Coscinaraea Milne Edwards andHaime, 1848Coscinaraea columna (Dana, 1846)Coscinaraea crassa Veron and Pichon,1980Coscinaraea exesa (Dana, 1846)Coscinaraea wellsi Veron and Pichon,1980Family Agariciidae Gray, 1847Genus Pavona Lamarck, 1801Pavona bipartita Nemenzo, 1980Pavona cactus (Forskål, 1775)Pavona clavus (Dana, 1846)Pavona decussata (Dana, 1846)Pavona duerdeni Vaughan, 1907Pavona explanulata (Lamarck, 1816)Pavona frondifera (Lamarck, 1816)Pavona maldivensis (Gardiner, 1905)Pavona minuta Wells, 1954Pavona varians Verrill, 1864Pavona venosa (Ehrenberg, 1834)Genus Leptoseris Milne Edwards and Haime,1849Leptoseris explanata Yabe and Sugiyama,194199
<strong>Solomon</strong> <strong>Islands</strong> <strong>Marine</strong> <strong>Assessment</strong> Technical ReportLeptoseris foliosa Dineson, 1980Leptoseris gardineri Horst, 1921Leptoseris hawaiiensis Vaughan, 1907Leptoseris incrustans (Quelch, 1886)Leptoseris mycetoseroides Wells, 1954Leptoseris papyracea (Dana, 1846)Leptoseris scabra Vaughan, 1907Leptoseris solida (Quelch, 1886)Leptoseris striata (Fenner & Veron 2000)Leptoseris tubulifera Vaughan, 1907Leptoseris yabei (Pillai and Scheer, 1976)Genus Gardineroseris Scheer and Pillai, 1974Gardineroseris planulata Dana, 1846Genus Coeloseris Vaughan, 1918Coeloseris mayeri Vaughan, 1918Genus Pachyseris Milne Edwards and Haime,1849Pachyseris foliosa Veron, 1990Pachyseris gemmae Nemenzo, 1955Pachyseris rugosa (Lamarck, 1801)Pachyseris speciosa (Dana, 1846)Family Fungiidae Dana, 1846Genus Cycloseris Milne Edwards and Haime,1849Cycloseris colini Veron, 2000Cycloseris cyclolites Lamarck, 1801Cycloseris erosa (Döderlein, 1901)Cycloseris sinensis Milne Edwards andHaime, 1851)Cycloseris somervillei (Gardiner, 1909)Cycloseris tenuis (Dana, 1846)Genus DiaserisDiaseris distorta(Michelin, 1843)Diaseris fragilis Alcock, 1893Genus Cantharellus Hoeksema and Best, 1984Cantharellus jebbi Hoeksema, 1993Genus Helliofungia Wells, 1966Heliofungia actiniformis Quoy andGaimard, 1833Genus Fungia Lamarck, 1801Fungia concinna Verrill, 1864Fungia danai Milne Edwards and Haime,1851Fungia fralinae Nemenzo, 1955Fungia fungites (Linneaus, 1758)Fungia granulosa Klunzinger, 1879Fungia gravisNemenzo, 1955Fungia horrida Dana, 1846Fungia klunzingeri Döderlein, 1901Fungia moluccensis Horst, 1919Fungia paumotensis Stutchbury, 1833Fungia repanda Dana, 1846Fungia scruposa Klunzinger, 1879Fungia scutaria Lamarck, 1801Fungia spinifer Claereboudt andHoeksema, 1987Genus Ctenactis Verrill, 1864Ctenactis albitentaculata Hoeksema, 1989Ctenactis crassa (Dana, 1846)Ctenactis echinata (Pallas, 1766)Genus Herpolitha Eschscholtz, 1825Herpolitha limax (Houttuyn, 1772)Herpolitha weberi Horst, 1921Genus Polyphyllia Quoy and Gaimard, 1833Polyphyllia novaehiberniae (Lesson, 1831)Polyphyllia talpina (Lamarck, 1801)Genus Sandalolitha Quelch, 1884Sandalolitha dentata (Quelch, 1886)Sandalolitha robusta Quelch, 1886Genus Halomitra Dana, 1846Halomitra clavator Hoeksema, 1989Halomitra pileus (Linnaeus, 1758)Genus Zoopilus Dana, 1864Zoopilus echinatus Dana, 1846Genus Lithophyllum Rehberg, 1892Lithophyllon lobata Horst, 1921Lithophyllon mokai Hoeksema, 1989Genus Podabacia Milne Edwards and Haime,1849Podabacia crustacea (Pallas, 1766)Podabacia motuporensis Veron, 1990Family Pectinidae Vaughan and Wells, 1943Genus Echinophyllia Klunzinger, 1879Echinophyllia aspera (Ellis and Solander,1788)Echinophyllia echinata (Saville-Kent,1871)Echinophyllia echinoporoides Veron andPichon, 1979Echinophyllia orpheensis Veron andPichon, 1980Genus Echinomorpha Veron, 2000Echinomorpha nishihirea (Veron, 1990)Genus Oxypora Saville-Kent, 1871Oxypora crassispinosa Nemenzo, 1979Oxypora glabra Nemenzo, 1959Oxypora lacera Verrill, 1864Genus Mycedium Oken, 1815100
Coral Communities & Reef HealthMycedium elephatotus (Pallas, 1766)Mycedium robokaki Moll and Best, 1984Mycedium mancaoi Nemenzo, 1979Genus Pectinia Oken, 1815Pectinia africanus Veron, 2000Pectinia alcicornis (Saville-Kent, 1871)Pectinia ayleni (Wells, 1935)Pectinia elongata Rehberg, 1892Pectinia lactuca (Pallas, 1766)Pectinia paeonia (Dana, 1846)Pectinia pygmaeus Veron, 2000Pectinia teres Nemenzo and montecillo,1981Pectinia maxima (Moll and Borel Best,1984)Family Merulinidae Verrill, 1866Genus Hydnophora Fischer de Waldheim,1807Hydnophora exesa (Pallas, 1766)Hydnophora grandis Gardiner, 1904Hydnophora microconos (Lamarck, 1816)Hydnophora pilosa Veron, 1985Hydnophora rigida (Dana, 1846)Genus Paraclavarina Veron, 1985Paraclavarina triangularis (Veron &Pichon, 1980)Genus Merulina Ehrenberg, 1834Merulina ampliata (Ellis and Solander,1786)Merulina scabricula Dana, 1846Genus Scapophyllia Milne Edwards andHaime, 1848Scapophyllia cylindrica Milne Edwards andHaime, 1848Family Dendrophylliidae Gray, 1847Genus Turbinaria Oken, 1815Turbinaria frondens (Dana, 1846)Turbinaria irregularis, Bernard, 1896Turbinaria mesenterina (Lamarck, 1816)Turbinaria patula (Dana, 1846)Turbinaria peltata (Esper, 1794)Turbinaria reniformis Bernard, 1896Turbinaria stellulata (Lamarck, 1816)Turbinaria sp.Family Mussidae Ortmann, 1890Genus Blastomussa Wells, 1961Blastomussa wellsi Wijsmann-Best, 1973Genus Micromussa Veron, 2000Micromussa amakusensis (Veron, 1990)Micromussa minuta (Moll and Borel-Best,1984)Genus Acanthastrea Milne Edwards andHaime, 1848Acanthastrea bowerbankiMilne Edwardsand Haime, 1851Acanthastrea brevis Milne Edwards andHaime, 1849Acanthastrea echinata (Dana, 1846)Acanthastrea faviaformis Veron, 2000Acanthastrea hemprichii (Ehrenberg, 1834)Acanthastrea ishigakiensis Veron, 1990Acanthastrea lordhowensis Veron &Pichon, 1982Acanthastrea rotundoflora Chevalier, 1975Acanthastrea subechinata Veron, 2000Acanthastrea sp. 1Genus Lobophyllia Blainville, 1830Lobophyllia corymbosa (Forskål, 1775)Lobophyllia dentatus Veron, 2000Lobophyllia diminuta Veron, 1985Lobophyllia flabelliformis Veron, 2000Lobophyllia hataii Yabe and Sugiyama,1936Lobophyllia hemprichii (Ehrenberg, 1834)Lobophyllia pachysepta Chevalier, 1975Lobophyllia robusta Yabe and Sugiyama,1936Lobophyllia serratus Veron, 2000Genus Symphyllia Milne Edwards and Haime,1848Symphyllia agaricia Milne Edwards andHaime, 1849Symphyllia hassi Pillai and Scheer, 1976Symphyllia radians Milne Edwards andHaime, 1849Symphyllia recta (Dana, 1846)Symphyllia valenciennesii Milne Edwardsand Haime, 1849Genus Scolymia Haime, 1852Scolymia vitiensis Brüggemann, 1878Genus Australomussa Veron, 1985Australomussa rowleyensis Veron, 1985Genus Cynarina Brüggemann, 1877101
<strong>Solomon</strong> <strong>Islands</strong> <strong>Marine</strong> <strong>Assessment</strong> Technical ReportCynarina lacrymalis (Milne Edwards andHaime, 1848)Family Faviidae Gregory, 1900Genus Caulastrea Dana, 1846Caulastrea curvata Wijsmann-Best, 1972Caulastrea echinulata (Milne Edwards andHaime, 1849)Caulastrea furcata Dana, 1846Caulastrea tumida Matthai, 1928Genus Favia Oken, 1815Favia danae Verrill, 1872Favia favus (Forskål, 1775)Favia helianthoides Wells, 1954Favia laxa (Klunzinger, 1879)Favia lizardensis Veron and Pichon, 1977Favia maritima (Nemenzo, 1971)Favia marshae Veron, 2000Favia matthai Vaughan, 1918Favia maxima Veron, Pichon & Wijsman-Best, 1972Favia pallida (Dana, 1846)Favia rosaria Veron, 2000Favia rotumana (Gardiner, 1899)Favia rotundata Veron, Pichon &Wijsman-Best, 1972Favia speciosa Dana, 1846Favia stelligera (Dana, 1846)Favia truncatus Veron, 2000Favia veroni Moll and Borel-Best, 1984Favia vietnamensis Veron, 2000Genus Barabattoia Yabe and Sugiyama, 1941Barabattoia amicorum (Milne Edwards andHaime, 1850)Barabattoia laddi (Wells, 1954)Genus Favites Link, 1807Favites acuticulis (Ortmann, 1889)Favites abdita (Ellis and Solander, 1786)Favites bestae Veron, 2000Favites chinensis (Verrill, 1866)Favites complanata (Ehrenberg, 1834)Favites flexuosa (Dana, 1846)Favites halicora (Ehrenberg, 1834)Favites micropentagona Veron, 2000Favites pentagona (Esper, 1794)Favites russelli (Wells, 1954)Favites stylifera (Yabe and Sugiyama,1937)Favites vasta (Klunzinger, 1879)Genus Goniastrea Milne Edwards and Haime,1848Goniastrea aspera Verrill, 1905Goniastrea australensis (Milne Edwardsand Haime, 1857)Goniastrea edwardsi Chevalier, 1971Goniastrea favulus (Dana, 1846)Goniastrea palauensis Yabe and Sugiyama,1936Goniastrea pectinata (Ehrenberg, 1834)Goniastrea ramosa Veron, 2000Goniastrea retiformis (Lamarck, 1816)Genus Platygyra Ehrenberg, 1834Platygyra acuta Veron, 2000Platygyra contorta Veron, 1990Platygyra daedalea (Ellis and Solander,1786)Platygyra lamellina (Ehrenberg, 1834)Platygyra pini Chevalier, 1975Platygyra ryukyuensis Yabe and Sugiyama,1936Platygyra sinensis (Milne Edwards andHaime, 1849)Platygyra verweyi Wijsman-Best, 1976Platygyra yaeyemaensis Eguchi and Shirai,1977Genus Australogyra Veron & Pichon, 1982Australogyra zelli (Veron & Pichon, 1977)Genus Oulophyllia Milne Edwards andHaime, 1848Oulophyllia bennettae (Veron & Pichon,1977)Oulophyllia crispa (Lamarck, 1816)Oulophyllia levis Nemenzo, 1959Genus Leptoria Milne Edwards and Haime,1848Leptoria irregularis Veron, 1990Leptoria phrygia (Ellis and Solander, 1786)Genus Montastrea Blainville, 1830Montastrea annuligera (Milne Edwardsand Haime, 1849)Montastrea colemani Veron, 2000Montastrea curta (Dana, 1846)Montastrea magnistellata Chevalier, 1971Montastrea multipunctata Hodgson, 1985Montastrea salebrosa (Nemenzo, 1959)Montastrea valenciennesi (Milne Edwardsand Haime, 1848)Genus Plesiastrea Milne Edwards and Haime,1848Plesiastrea versipora (Lamarck, 1816)Genus Oulastrea Milne Edwards and Haime,1848102
Coral Communities & Reef HealthOulastrea crispata (Lamarck, 1816)Genus Diploastrea Matthai, 1914Diploastrea heliopora (Lamarck, 1816)Genus Leptastrea Milne Edwards and Haime,1848Leptastrea inaequalis Klunzinger, 1879Leptastrea pruinosa Crossland, 1952Leptastrea purpurea (Dana, 1846)Leptastrea transversa Klunzinger, 1879Genus Cyphastrea Milne Edwards and Haime,1848Cyphastrea agassizi (Vaughan, 1907)Cyphastrea chalcidium (Forskål, 1775)Cyphastrea decadia Moll and Best, 1984Cyphastrea microphthalma (Lamarck,1816)Cyphastrea ocellina (Dana, 1864)Cyphastrea serailia (Forskål, 1775)Genus Echinopora Lamarck, 1816Echinopora gemmacea Lamarck, 1816Echinopora horrida Dana, 1846Echinopora lamellosa (Esper, 1795)Echinopora mammiformis (Nemenzo,1959)Echinopora pacificus Veron, 1990Echinopora taylorae (Veron, 2000)Family Trachyphyllidae Verrill, 1901Genus Trachyphyllia Milne Edwards andHaime, 1848Trachyphyllia geoffroyi (Audouin, 1826)Family Poritidae Gray, 1842Genus Porites Link, 1807Porites annae Crossland, 1952Porites attenuata Nemenzo 1955Porites australiensisVaughan, 1918Porites cylindrica Dana, 1846Porites deformis Nemenzo, 1955Porites evermanni Vaughan, 1907Porites flavus Veron, 2000Porites horizontalata Hoffmeister, 1925Porites latistellata Quelch, 1886Porites lichen Dana, 1846Porites lobata Dana, 1846Porites lutea Milne Edwards & Haime,1851Porites monticulosa Dana, 1846Porites negrosensis Veron, 1990Porites nigrescens Dana, 1846Porites profundus Rehberg, 1892Porites rugosa Fenner & Veron, 2000Porites rus (Forskål, 1775)Porites solida (Forskål, 1775)Porites tuberculosa Veron, 2000Porites vaughani Crossland, 1952Porites massiveGenus Goniopora Blainville, 1830Goniopora albiconus Veron, 2000Goniopora burgosi Nemenzo, 1955Goniopora columna Dana, 1846Goniopora djiboutiensis Vaughan, 1907Goniopora eclipsensis Veron and Pichon,1982Goniopora fruticosa Saville-Kent, 1893Goniopora lobata Milne Edwards andHaime, 1860Goniopora minor Crossland, 1952Goniopora palmensis Veron and Pichon,1982Goniopora pandoraensis Veron andPichon, 1982Goniopora somaliensis Vaughan, 1907Goniopora stokesi Milne Edwards andHaime, 1851Goniopora stutchburyi Wells, 1955Goniopora tenuidens (Quelch, 1886)Genus Alveopora Blainville, 1830Alveopora catalai Wells, 1968Alveopora fenestrata (Lamarck, 1816)Alveopora spongiosa Dana, 1846Alveopora tizardi Bassett-Smith, 1890103
<strong>Solomon</strong> <strong>Islands</strong> <strong>Marine</strong> <strong>Assessment</strong> Technical ReportAppendix 4. Representitive images of the seven coral community types identified in the <strong>Solomon</strong> <strong>Islands</strong>.I. Type A shallow community on reef flat site at Pwaunani Point , Uki Ni Masi Island, MakiraII. Type A shallow community on reef flat site at Malaupaina Island, Makira.104
Coral Communities & Reef HealthIII. Type B shallow community on reef flat site at Matavaghi, Isabel.IV. Type B shallow community showing extensive crown of thorns damage, on reef flat site at Mary Shoal,Guadalcanal.105
Coral Communities & Reef HealthVII. Deep Community type E on lower slopes of Kombuana Island, Florida Group.VIII. Deep Community type E on lower slopes on reef site at Vella Lavella, New Georgia.107
<strong>Solomon</strong> <strong>Islands</strong> <strong>Marine</strong> <strong>Assessment</strong> Technical ReportIX. Deep Community type E on lower slopes of reef site at Papu Passage, Gehbira Island, Isabel.X. Deep Community type F on lower slopes of Pio Island reef, Makira.108
Coral Communities & Reef HealthXI. Community type G showing high coral mortality on shallow reef flat at Linggatu Cove, Russell IslandXII. Community type G on shallow reef flat at Linggatu Cove, Russell Island.109
June 2006TNC Pacifi c Island CountriesReport No 1/06<strong>Solomon</strong> <strong>Islands</strong>GovernmentChapter 3Coral Reef FishDiversity<strong>Solomon</strong> <strong>Islands</strong> <strong>Marine</strong> <strong>Assessment</strong>Gerald R. AllenWestern Australia Museum111
Published by: The Nature Conservancy, Indo-Pacific Resource CentreAuthor Contact Details:Gerald R. Allen: 1 Dreyer Road Roleystone, WA 6111 Australia;e-Mail: tropical_reef@bigpond.comSuggested Citation:Allen, G.R. 2006. Coral Reef Fish Diversity. In: Green, A., P. Lokani, W. Atu, P. Ramohia, P.Thomas and J. Almany (eds.) 2006. <strong>Solomon</strong> <strong>Islands</strong> <strong>Marine</strong> <strong>Assessment</strong>: Technical report of surveyconducted May 13 to June 17, 2004. TNC Pacific Island Countries Report No. 1/06.© 2006, The Nature ConservancyAll Rights Reserved.Reproduction for any purpose is prohibited without prior permission.Design: Jeanine AlmanyArtwork: Nuovo DesignMaps: Stuart Sheppard & Jeanine AlmanyCover Photo: © Gerald AllenAvailable from:Indo-Pacific Resource CentreThe Nature Conservancy51 Edmondstone StreetSouth Brisbane, QLD 4101AustraliaOr via the worldwide web at: www.conserveonline.org112
Coral Reef Fish DiversityContentsExecutive Summary ........................................................................................................................... 114Introduction........................................................................................................................................115History of <strong>Solomon</strong> <strong>Islands</strong> Ichthyology .............................................................................................................................115Methods....................................................................................................................................................115Results ...................................................................................................................................................... 116General faunal composition .................................................................................................................................................... 116Fish community structure ........................................................................................................................................................ 118Richest sites for fishes ............................................................................................................................................................... 119Coral Fish Diversity Index (CFDI).................................................................................................................................... 120Zoogeographic affinities of the <strong>Solomon</strong>s fish fauna ......................................................................................................122New species and notable range extensions .........................................................................................................................122Observations of commercial species .....................................................................................................................................124Conservation Recommendations ............................................................................................ 125Potential MPA sites based on fish community structure and physical attributes...................................................125References...............................................................................................................................................127Appendices...............................................................................................................................................128Appendix 1....................................................................................................................................................................................128Appendix 2. ..................................................................................................................................................................................129Appendix 3.....................................................................................................................................................................................131113
<strong>Solomon</strong> <strong>Islands</strong> <strong>Marine</strong> <strong>Assessment</strong> Technical ReportExecutive Summary• A list of fishes was compiled for 65 sites throughout the main <strong>Solomon</strong> <strong>Islands</strong> archipelago. Thesurvey involved about 94 hours of scuba diving to a maximum depth of 60 m.• The <strong>Solomon</strong> <strong>Islands</strong> possesses a diverse coral reef fish fauna, consisting of at least 82 families,348 genera, and 1019 species, of which 786 (77 %) were observed or collected during the survey.• Forty-seven new distributional records were obtained, including at least one new species ofcardinalfish (Apogonidae).• A formula for predicting the total reef fish fauna based on the number of species in six keyindicator families indicates that at least 1,159 species can be expected to occur at the <strong>Solomon</strong><strong>Islands</strong>.• Gobies (Gobiidae), damselfishes (Pomacentridae), and wrasses (Labridae) are the dominantgroups at the <strong>Solomon</strong> <strong>Islands</strong> in both number of species (120, 100, and 84 respectively) andnumber of individuals.• Species numbers at visually sampled sites during the 2004 survey ranged from 100 to 279, withan average of 184.7.• Njari Island, Gizo (site 32) was the leading site for fish diversity. The 279 species count is thefourth highest ever recorded for a single dive, surpassed only by three sites in the Raja Ampat<strong>Islands</strong>.• Outer reef habitats contained the highest fish diversity with an average of 197.8 species per site.Sheltered near-shore sites exhibited the least diversity (151.3 species), and moderately exposedlocations had an average of 189.9 species per site.• 200 or more species per site is considered the benchmark for an excellent fish count. This figurewas achieved at 37 percent of <strong>Solomon</strong> <strong>Islands</strong> sites.• Although fish diversity was generally high, there were signs of overfishing indicated by a generalpaucity of large-sized reef fishes. Abundance of Napoleon Wrasse, another indicator of fishingpressure, was moderate – better than most places in the Coral Triangle, but less than Milne BayProvince in Papua New Guinea.• Conservation recommendations based on fish community structure and aesthetic qualities of thephysical environment include possible establishment of MPAs at the Shortland <strong>Islands</strong>, Gizo(New Georgia), Marau Sound (Guadalcanal), western Makira, Three Sisters <strong>Islands</strong>, Leli Island(Malaita), and north-western Isabel114
Coral Reef Fish DiversityIntroductionThe primary goal of the fish survey was to provide a comprehensive inventory of species inhabitingthe <strong>Solomon</strong> <strong>Islands</strong>, primarily species living on or near coral reefs down to the limit of safe sportdiving or approximately 50-60 m depth. It therefore excludes deepwater fishes, offshore pelagicspecies such as flyingfishes, tunas, and billfishes, and most estuarine forms.HISTORY OF SOLOMON ISLANDS ICHTHYOLOGYThere has been considerable fish collecting activity in the <strong>Solomon</strong> <strong>Islands</strong> dating back to the visit ofH.M.S. Curacao in 1865. A small collection of fishes were collected on this expedition by J.Brenchley and was mainly reported by Günther (1873), who was the fish curator at the BritishMuseum. Herre (1931) published the first checklist of <strong>Solomon</strong>s fishes. It included extensivecollections from the Shortland <strong>Islands</strong> made by Alvin Seale in 1903, as well as 189 species that Herreobtained mainly at Isabel during a 4-day visit in 1929. Herre also collected at Ugi, Tulaghi, Malaita,Kolombangara, New Georgia, and the Shortlands. He prophetically proclaimed “I have no doubt thatat any one of them 700 or 800 species could be collected during a single season”.The Crane Pacific Expedition of 1928-1929 from the Field Museum in Chicago collected nearly 200fish species at the <strong>Solomon</strong> <strong>Islands</strong> that were reported by Herre (1936). In addition, the TempletonCrocker Expedition to Polynesia and Melanesia in 1933, made collections (reported by Seale, 1935) atRennell, Bellona, Santa Ana Island, Malaita, Tulaghi, Gavutu Island, Guadalcanal, Sikaiana Island,Ugi, and Makira. Finally, Fowler (1928 and 1934) provided a few additional records of <strong>Solomon</strong>sfishes during this period.World War II provided an opportunity for further fish collecting activities by two enterprisingAmerican servicemen, W.M. Chapman and H. Cheyne, who collected numerous specimens betweenMay-July 1944 at Gizo, Munda, New Georgia, and the Florida <strong>Islands</strong>. The collections included avariety of reef fishes, including many large species such as sharks and rays. Their material isdeposited at the United States National Museum in Washington D.C. This institution houses asignificant collection of <strong>Solomon</strong>s fishes composed of approximately 2,200 lots. The collection isalso the repository of a major collection made by Jeffrey Williams of USNM at the Santa Cruz <strong>Islands</strong>in 1998.The author previously collected fishes in the <strong>Solomon</strong> <strong>Islands</strong> at Guadalcanal, Savo, Florida <strong>Islands</strong>,and Malaita in 1973 with John Randall, sponsored by a grant from the National Geographic Society.Most of the fishes from this trip were deposited at the Bishop Museum in Honolulu, but a smallnumber of specimens were also lodged at the Australian Museum, Sydney.The list of <strong>Solomon</strong>s fishes that accompanies this report (see Appendix 3) is the most comprehensiveinventory to date and includes at least 47 new records for the region. It is the first summary of<strong>Solomon</strong>s fishes to appear since 1958, the year that Munro’s “Fishes of the New Guinea Region[including <strong>Solomon</strong>s]” was published.MethodsThe fish portion of the REA involved approximately 94 hours of scuba diving by G. Allen to amaximum depth of 60 m. A list of fishes was compiled for 65 sites (see Appendices 1 and 2). Thebasic method consisted of underwater observations made during a single, 60-100 minute dive at eachsite. The name of each observed species was recorded in pencil on a plastic sheet attached to aclipboard. The technique usually involved rapid descent to 20-60 m, then a slow, meandering ascentback to the shallows. The majority of time was spent in the 2-12 m depth zone, which consistently115
<strong>Solomon</strong> <strong>Islands</strong> <strong>Marine</strong> <strong>Assessment</strong> Technical Reportharbours the largest number of species. Each dive included a representative sample of all majorbottom types and habitat situations, for example rocky intertidal, reef flat, steep drop-offs, caves(utilizing a flashlight when necessary), rubble and sand patches.Only the names of fishes for which identification was absolutely certain were recorded. However,very few, less than one percent of those observed, could not be identified to species. This high levelof recognition is based on more than 30 years of diving experience in the Indo-Pacific and an intimateknowledge of the reef fishes of this vast region as a result of extensive laboratory and field studies.The visual survey was supplemented with occasional small collections procured with the use ofanaesthetic quinaldine-sulphate and the ichthyocide rotenone. In addition, specimens of the smallfree-swimming blenny, Meiacanthus crinitus, were collected with a rubber-propelled, multi-prongspear. The purpose of the quinaldine and rotenone collections was to flush out small, crevicedwellingfishes (for example tiny gobies) that are difficult to record with visual techniques. Rotenonewas also used on one occasion to collect a new species of cardinalfish.A number of valuable records were provided by other survey participants Ben Kahn and Emre Turak,who photographed (using a digital camera or video) rare or unusual species during the inventorydives. In many cases species not seen by the author at a particular site were noted after inspecting thephotographs.ResultsThe total reef fish fauna of the <strong>Solomon</strong> <strong>Islands</strong> reported herein consists of 1,019 species belonging82 families and 348 genera (see Appendix 3). A total of 786 species were actually recorded duringthe present marine assessment. The additional 233 species were either reported in the literature orrepresent museum records. For example, just prior to the survey the author had an opportunity to visitthe United States National Museum in Washington D.C. where numerous <strong>Solomon</strong>s fishes are lodged.Allen et al. (2003), Allen (1993), Randall et al. (1990), and Myers (1989) illustrated the majority ofspecies currently known from the region.GENERAL FAUNAL COMPOSITIONThe fish fauna of the <strong>Solomon</strong> <strong>Islands</strong> consists mainly of species associated with coral reefs. Themost abundant families in terms of number of species are gobies (Gobiidae), damselfishes(Pomacentridae), wrasses (Labridae), cardinalfishes (Apogonidae), blennies (Blenniidae), groupers(Serranidae), butterflyfishes (Chaetodontidae), surgeonfishes (Acanthuridae), snappers (Lutjanidae),and parrotfishes (Scaridae). These 10 families collectively account for 609 species or about 60percent of the total reef fauna (Figure 1).116
Coral Reef Fish DiversityScaridaeLutjanidaeAcanthuridaeChaetodontidaeSerranidaeBlenniidaeApogonidaeLabridaePomacentridaeGobiidae0 20 40 60 80 100 120No. speciesFigure 1. Ten largest families of <strong>Solomon</strong> <strong>Islands</strong> fishes.The relative abundance of <strong>Solomon</strong>s fish families is similar to other reef areas in the Indo-Pacific,although the ranking of individual families is variable as shown in Table 1. Although the Gobiidaewas the leading family, it was not adequately collected, due to the small size and cryptic habits ofmany species. Similarly, the moray eel family Muraenidae is consistently among the most speciosegroups at other localities, and is no doubt abundant. However, they are best sampled with rotenonedue to their cryptic habits.Table 1. Family ranking in terms of number of species for various localities in the Indo- Pacific region(SOL = <strong>Solomon</strong> <strong>Islands</strong>; RA = Raja Ampat <strong>Islands</strong>, Indonesia; MB = Milne Bay Province, PNG; TB =Togean-Banggai <strong>Islands</strong>, Indonesia; CAL = Calamianes <strong>Islands</strong>, Philippines; MAD = Madagascar; PI =Phoenix <strong>Islands</strong>). Data for Raja Ampat <strong>Islands</strong> is from Allen (2002), for Milne Bay is from Allen (2003), forTogean-Banggai <strong>Islands</strong> from Allen (2001a), for Calamianes <strong>Islands</strong> from Allen (2001b), for Madagascar fromAllen (unpublished) and for Phoenix <strong>Islands</strong> from Allen (unpublished).Family SOL RA MB TB CAL MAD PIGobiidae 1st 1st 1st 1st 3rd 1st 3rdPomacentridae 2nd 2nd 3rd 3rd 1st 3rd 4thLabridae 3rd 3rd 2nd 2nd 2nd 2nd 1stApogonidae 4th 4th 4th 4th 4th 5th 10thBlenniidae 5th 8th 6th 6th 8th 6th 8thSerranidae 6th 5th 5th 5th 5th 4th 2ndChaetodontidae 7th 6th 6th 7th 6th 10th 7thAcanthuridae 8th 7th 8th 8th 7th 8th 5thLutjanidae 9th 10th 9th 9th 9th 14th 15thScaridae 10th 9th 10th 10th 10th 10th 11th117
<strong>Solomon</strong> <strong>Islands</strong> <strong>Marine</strong> <strong>Assessment</strong> Technical ReportFISH COMMUNITY STRUCTUREThe composition of local reef fish communities in the <strong>Solomon</strong>s and elsewhere in the vast Indo-Pacific region is dependent on habitat variability. The relatively rich reef fish fauna of the <strong>Solomon</strong><strong>Islands</strong> directly reflects a high level of habitat diversity. Nearly every conceivable habitat situation ispresent from highly sheltered embayments with a large influx of freshwater to oceanic atolls and outerbarrier reefs. The number of species found at each site is indicated in Table 2. Totals ranged from 100to 279, with an average of 184.7 per site.Table 2. Number of fish species observed at each site during TNC survey of the <strong>Solomon</strong> <strong>Islands</strong>. (note: site 30is omitted as fishes were not surveyed).Site Species Site Species Site Species1 196 23 160 46 1642 174 24 198 47 1133 147 25 149 48 1964 102 26 198 49 1445 153 27 198 50 1896 148 28 229 51 2437 157 29 210 52 2558 219 31 189 53 2019 177 32 279 54 24110 160 33 153 55 14411 220 34 232 56 21012 140 35 166 57 19713 177 36 234 58 18114 144 37 100 59 20315 176 38 233 60 19116 203 39 228 61 20617 172 40 155 62 12518 218 41 152 63 20019 116 42 177 64 14020 157 43 202 65 20321 223 44 235 66 17622 240 45 190The survey sites can be broadly categorized according to degree of shelter from wind and waves(Appendix 1). The most highly sheltered reefs are typically close to shore and generally situatedwithin embayments. They are often subject to heavy silt deposition and consequent reduced visibility,although tidal flushing sometimes results in periods of much improved water clarity. The mostsheltered sites typically have a much-depleted fish fauna, particularly those that are associated withheavy siltation. Nevertheless, there are a number of species associated with this environment that arenot found elsewhere and the community “mix” is also very unique.At the opposite extreme are exposed outer reefs with periodic strong currents and relatively clearwater. Most outer reefs in the <strong>Solomon</strong>s drop away quickly to deep water although we dived at a fewlocations (e.g. site 65) where the slope was relatively gradual. There is considerable habitat variabilityamong outer reef sites, ranging from relatively sheltered leeward sites near shore to highly exposedoffshore reefs. Outer reefs generally support the most species and the diversity is greatly enhanced ifthere is good substrate variability and periodic strong currents. The highest diversity is found whenthese conditions are found in close proximity to sheltered shorelines, for example the Njari Island site(32).Between the two extremes of reef exposure there is a variety of moderately exposed habitat situations.These are often reefs that lie close to shore, but experience strong tidal flushing and therefore supporta fish community that is partially composed of species that are more typical of outer reefs. There are118
Coral Reef Fish Diversityalso a number of species that are most abundant at these semi-sheltered sites, even though they maybe found in other environment (e.g. the damselfishes Pomacentrus nigromanus and Neoglyphidodonnigroris.)For the purpose of analysis, the 65 sites that were surveyed for fishes were placed in three generalcategories depending on their general degree of exposure and their associated fish communities(Appendix 2 and Table 3): sheltered inshore reefs, moderately exposed reefs, and outer reefs. Thiscategorization is obviously an over-simplification of complex environmental variables, but isnevertheless useful for analytical purposes.Table 3. Comparison of fish diversity for major habitat types.Major habitat No. sites Avg. spp. per siteOuter reef 27 197.8Moderately sheltered 20 189.9Strongly sheltered inshore 18 151.3RICHEST SITES FOR FISHESThe total species at a particular site is ultimately dependent on the availability of food, shelter and thediversity of substrata. Well-developed reefs with relatively high coral diversity and significant livecoral cover were usually the richest areas for fishes, particularly if the reefs were exposed to periodicstrong currents. These areas provide an abundance of shelter for fishes of all sizes and the currentsare vital for supporting numerous planktivores, the smallest of which provide food for largerpredators.Although silty bays (often relatively rich for corals), mangroves, seagrass beds, and pure sand-rubbleareas were consistently the poorest areas for fish diversity, sites that incorporate mixed substrates (inaddition to live coral) usually support the most fish species. Sites that encompass both exposed outerreefs as well as sheltered back reefs or shoreline reefs are also correlated with higher than average fishdiversity (e.g. site 32).The 12 most speciose sites for fishes are indicated in Table 4. The average total for all sites (184.7)was relatively high, especially considering that many of the sites involved relatively impoverishednear-shore habitats. The total of 279 species at site 32 (Njari Island, Gizo) was the fourth highest totalrecorded by the author for a single dive anywhere in the Indo-Pacific. It is surpassed only by threesites in the Raja Ampat <strong>Islands</strong> that had between 281-284 species.Table 4. Twelve richest fish sites for fish diversity.Site No. Location Total Spp.32 Njari, Gizo 27952 Bio, Makira 25551 Malaupaina 2, Three Sisters <strong>Islands</strong> 24354 Komusupa, Malaita 24022 Emerald, Choiseul 24044 Cormorant, Guadalcanal 23536 Uepi Pt., Marovo Lagoon, New Georgia 234119
<strong>Solomon</strong> <strong>Islands</strong> <strong>Marine</strong> <strong>Assessment</strong> Technical ReportSite No. Location Total Spp.38 Minjanga, New Georgia Group 23334 Roviana, New Georgia Group 23228 Tua, Shortland <strong>Islands</strong> 22939 Mbili, New Georgia Group 22721 Poro Island, Choiseul 223Table 5 presents a comparison of the reef fish fauna of major geographical areas that were surveyed.The highest average number of species (216) was recorded at the Three Sisters with the lowest value(163) from Isabel. However, these figures are based on relatively few sites and are therefore notparticularly useful as a guide to overall richness. Virtually any of the 11 geographic areas would becapable of generating high average species counts if sites were chosen with only this goal in mind. Inconclusion, there does not appear to be any significant correlation between species richness andgeographic location.Table 5. Average number of fish species per site recorded for geographic areas in the <strong>Solomon</strong> <strong>Islands</strong>.Rank General Area No. sites Site nos. Avg. species/site1. Three Sisters <strong>Islands</strong> 2 50-51 216.02. Shortland <strong>Islands</strong>/Mono 4 26-29 208.83. New Georgia Group 9 31-39 201.34. Guadalcanal/Savo 2 44-45, 65-66 201.05. Malaita 9 54-62 188.56. Arnavon <strong>Islands</strong> 2 16-17 187.57. Makira 6 46-49, 52-53, 178.88. Florida <strong>Islands</strong>/Sealark 4 1-2, 63-64 177.3Channel9. Russell <strong>Islands</strong> 4 40-43 171.510. Choiseul 8 18-25 164.911. Isabel 13 3-15 163.0CORAL FISH DIVERSITY INDEX (CFDI)Allen (1998) devised a convenient method for assessing and comparing overall reef fish diversity.The technique essentially involves an inventory of six key families: Chaetodontidae, Pomacanthidae,Pomacentridae, Labridae, Scaridae, and Acanthuridae. The number of species in these families istotaled to obtain the Coral Fish Diversity Index (CFDI) for a single dive site, relatively restrictedgeographic areas or countries and large regions (e.g. <strong>Solomon</strong> <strong>Islands</strong>).CFDI values can be used to make a reasonably accurate estimate of the total coral reef fish fauna of aparticular locality by means of regression formulas. The latter were obtained after analysis of 35Indo-Pacific locations for which reliable, comprehensive species lists exist. The data were firstdivided into two groups: those from relatively restricted localities (surrounding seas encompassingless than 2,000 km 2 ) and those from much larger areas (surrounding seas encompassing more than50,000 km 2 ). Simple regression analysis revealed a highly significant difference (P = 0.0001)between these two groups. Therefore, the data were separated and subjected to additional analysis.The Macintosh program Statview was used to perform simple linear regression analyses on each dataset in order to determine a predictor formula, using CFDI as the predictor variable (x) for estimatingthe independent variable (y) or total coral reef fish fauna. The resultant formulae were obtained: 1.total fauna of areas with surrounding seas encompassing more than 50,000 km 2 = 4.234(CFDI) -120
Coral Reef Fish Diversity114.446 (d.f = 15; R 2 = 0.964; P = 0.0001); 2. total fauna of areas with surrounding seasencompassing less than 2,000 km 2 = 3.39 (CFDI) - 20.595 (d.f = 18; R 2 = 0.96; P = 0.0001).The CFDI regression formula is particularly useful for large regions such as the Philippines, wherereliable totals are lacking. Moreover, the CFDI predictor value can be used to gauge the thoroughnessof a particular short-term survey that is either currently in progress or already completed. Forexample, the CFDI obtained for the <strong>Solomon</strong> <strong>Islands</strong> is 301, and the appropriate regression formula(3.39 x 345 - 20.595) predicts an approximate total of 1,159 species, indicating that at least 140 morespecies can be expected.Indonesia is the world’s leading country for reef fish diversity, based on CFDI values. A recent studyby Allen and Adrim (2003), which lists a total of 2,056 species from Indonesia strongly supports thisranking. Table 6 presents CFDI values, number of shallow reef fishes recorded to date, and theestimated number of species based on CFDI data for selected countries or regions in the Indo-Pacific.In most cases the predicted number of species is similar or less than that actually recorded, and is thusindicative of the level of knowledge. For example, when the actual number is substantially less thanthe estimated total (e.g. Sabah) it indicates incomplete sampling. However, the opposite trend isevident for Indonesia, with the actual number being slightly greater than what is predicted by theCFDI. The total number of species for the Philippines is yet to be determined and is thereforeexcluded.Table 6. Coral fish diversity index (CFDI) for regions or countries with figures for total reef and shore fishfauna (if known), and estimated fauna from CFDI regression formula.Locality CFDI No. reef fishesEstim.Reef fishesIndonesia 507 2056 2032Australia (tropical) 401 1627 1584Philippines 387 ? 1525Papua New Guinea 362 1494 1419S. Japanese Archipelago 348 1315 1359Great Barrier Reef, Australia 343 1325 1338Taiwan 319 1172 1237Micronesia 315 1170 1220<strong>Solomon</strong> <strong>Islands</strong> 301 1019 1159New Caledonia 300 1097 1156Sabah, Malaysia 274 840 1046Northwest Shelf, Western Australia 273 932 1042Mariana <strong>Islands</strong> 222 848 826Marshall <strong>Islands</strong> 221 795 822Ogasawara <strong>Islands</strong>, Japan 212 745 784French Polynesia 205 730 754Maldive <strong>Islands</strong> 219 894 813Seychelles 188 765 682Society <strong>Islands</strong> 160 560 563Tuamotu <strong>Islands</strong> 144 389 496Hawaiian <strong>Islands</strong> 121 435 398Marquesas <strong>Islands</strong> 90 331 267121
<strong>Solomon</strong> <strong>Islands</strong> <strong>Marine</strong> <strong>Assessment</strong> Technical ReportZOOGEOGRAPHIC AFFINITIES OF THE SOLOMONS FISH FAUNAThe <strong>Solomon</strong> <strong>Islands</strong> belong to the overall Indo-west Pacific faunal community. Its reef fishes arevery similar to those inhabiting other areas within this vast region, stretching eastward from EastAfrica and the Red Sea to the islands of Micronesia and Polynesia. Although most families, andmany genera and species are consistently present across the region, the species composition variesgreatly according to locality.The <strong>Solomon</strong>s <strong>Islands</strong> are part of the Indo-Australian region, the richest faunal province on the globein terms of biodiversity. The nucleus of this region, or Coral Triangle, is mainly composed ofIndonesia, Philippines, Papua New Guinea and the <strong>Solomon</strong> <strong>Islands</strong>. Species richness generallydeclines with increased distance from the Triangle, although the rate of attenuation is generally less ina westerly direction. The damselfish family Pomacentridae is typical in this regard. For example,Indonesia has the world’s highest total with 138 species, with the following totals recorded for otherareas (Allen, 1991): Papua New Guinea (109), <strong>Solomon</strong> <strong>Islands</strong> (100), northern Australia (95), W.Thailand (60), Fiji <strong>Islands</strong> (60), Maldives (43), Red Sea (34), Society <strong>Islands</strong> (30), and Hawaiian<strong>Islands</strong> (15).Considering the broad dispersal capabilities via the pelagic larval stage of most reef fishes it is notsurprising that only two species appear to be endemic to the <strong>Solomon</strong>s, a garden eel (Heterocongercobra) and the undescribed cardinalfish (Apogon sp.) collected during the present REA. The gardeneel was first collected by the author and colleagues in 1973 from a Japanese shipwreck near Honiara.A visit to this same site by Ben Kahn and David Wachenfeld at the end of the present REA failed tofind this species.NEW SPECIES AND NOTABLE RANGE EXTENSIONSA total of 47 new distributional records for the <strong>Solomon</strong> <strong>Islands</strong> were recorded during the survey(Table 7). Most of these represent range extensions of widespread species and therefore it is notsurprising to find them in the <strong>Solomon</strong>s. However several notable exceptions are discussed in thefollowing paragraphs.1. Apogon new species – I noticed this species at the beginning of the dive at site 48 situated atStar Harbour at the south-eastern end of Makira. It was among a large, mixed aggregation ofcardinalfishes that were hovering above a clump of boulders on a semi-sheltered outer reefslope at a depth of 25 m. I realized immediately it was something special and thereforeemployed rotenone to collect about 10 specimens. Close examination in my laboratory backin Perth revealed that it is an undescribed species closely related to Apogon lineomaculatusAllen & Randall, which is endemic to the Lesser Sunda <strong>Islands</strong> of Indonesia. The Indonesianfish is characterized by a prominent black mid-lateral stripe and fainter vertical bars on thelower half of the body. The new species has a very similar shape, but lacks both of thesedistinct colour features.2. Dunckerocampus naia – This is a small, delicate pipefish I recently described (with RudieKuiter). In fact, the manuscript is still in press and hopefully there is still time to add the<strong>Solomon</strong>s specimen. It is apparently widespread, but only two other specimens are known,one from Fiji and another from north-eastern Kalimantan. The <strong>Solomon</strong>s specimen wascaught by hand in 30 m in a small crevice on a vertical slope at site 36 (Uepi Point, NewGeorgia Group).3. Meiacanthus crinitus – This fang-blenny was previously thought to be endemic to the RajaAmpat <strong>Islands</strong> and therefore the <strong>Solomon</strong>s record represents a considerable range extension.It is a distinct fish characterised by a trio of alternating black and white stripes. Males have avery lunate caudal fin with curious filamentous extensions of the central caudal rays. Icollected 4 specimens from site 14 (Isabel), but it was also seen at sites on New Georgia,Guadalcanal, and Makira.122
Coral Reef Fish Diversity4. Chaetodon burgessi – This distinctive butterflyfish is known only from a few locations andtherefore the <strong>Solomon</strong> <strong>Islands</strong> sightings are significant. It was previously recorded from Palau(type locality), New Britain, Flores, Sulawesi, Sipadan Island (Sabah), Philippines, andPohnpei. Three individuals were seen during the REA, one at site 39 (Minjanga I., NewGeorgia Group) and a pair at site 41 (Kovilok I., Russell <strong>Islands</strong>). The typical habitat consistsof nearly vertical outer reef slopes at depths below 30-40 m.5. Pterois mombasae – The <strong>Solomon</strong>s sighting of this species on the last dive of the survey (site66, north-western Guadalcanal) represents the first record in the Pacific. A single individualwas photographed in 12 m depth. The species ranges widely in the Indian Ocean and is alsoknown from southern Indonesia as far east as Flores.Table 7. New distribution records for the <strong>Solomon</strong> <strong>Islands</strong>.Family Species General locationHolocentridae Myripristis botche Isabel I.Holocentridae Myrpristis hexagona widespreadHolocentridae Sargocentron rubrum Tulaghi HarbourSyngnathidae Dunckerocampus naia Uepi Pt, New GeorgiaScorpaenidae Pterois mombasae NW GuadalcanalSerranidae Cephalopholis polleni Russell Is.Serranidae Epinephelus coioides ChoiseulSerranidae Pseudanthias hutomoi Shortland Is.Pseudochromidae Pseudoplesiops knighti Bio I. & Alite ReefPlesiopidae Steeneichthys plesiopsus Roviana Lagoon, New GeorgiaOpistognathidae Opistognathus sp. Isabel & Shortland Is.Apogonidae Apogon n. sp. Star Harbour, MakiraApogonidae Apogon chrysotaenia Emerald Entrance, ChoiseulApogonidae Apogon gilberti New GeorgiaApogonidae Apogon hoeveni Isabel, Choiseul, and New GeorgiaApogonidae Apogon rhodopterus Arnavon Is. & New GeorgiaApogonidae Cheilodipterus alleni widespreadLutjanidae Lutjanus mizenkoi Shortland Is.Lutjanidae Lutjanus timorensis Star Harbour, MakiraLutjanidae Paracaesio sordidus Bio I.Chaetodontidae Chaetodon burgessi New Georgia & Russell Is.Pomacentridae Pomacentrus albimaculus widespreadPomacentridae Pomachromis richardsoni ChoiseulLabridae Bodianus bimaculatus widespreadLabridae Cirrhilabrus condei widespreadLabridae Halichoeres minutus Isabel & New GeorgiaLabridae Pseudocheilinops ataenia widespreadBlenniidae Ecsenius bicolor widespreadBlenniidae Laiphognathus multimaculatus Tulaghi HarbourBlenniidae Meiacanthus crinitus widespreadGobiidae Bryaninops amplus widespreadGobiidae Bryaninops loki widespreadGobiidae Bryaninops natans Shortland Is. & New GeorgiaGobiidae Bryaninops yongei widespread123
<strong>Solomon</strong> <strong>Islands</strong> <strong>Marine</strong> <strong>Assessment</strong> Technical ReportFamily Species General locationGobiidae Eviota distigma Alite ReefGobiidae Eviota cometa Roviana Lagoon, New GeorgiaGobiidae Eviota sparsa Star Harbour, MakiraGobiidae Gobiodon acicularis Russell Is.Gobiidae Oplopomops diacanthus New GeorgiaGobiidae Pleurosicya boldinghi IsabelGobiidae Pleurosicya elongata widespreadGobiidae Pleurosicya micheli Roviana Lagoon New GeorgiaGobiidae Sueviota lachneri Alite ReefPtereleotridae Ailiops novaeguineae widespreadSiganidae Siganus punctatissimus widespreadAcanthuridae Acanthurus fowleri widespreadAcanthuridae Naso minor widespreadOBSERVATIONS OF COMMERCIAL SPECIESSeparate data regarding commercially valuable species were gathered by the reef survey team and arereported ( see Fisheries Resources: Food and Aquarium Fishes, this report), but the following generalcomments pertain to the 65 sites where fish species inventories were conducted. Large fishes weregenerally scarce, especially coral trout, large gropers, and sharks. The only large serranid that wasseen regularly was Plectropomus oligocanthus. Occasional small groups of large sweetlips(Plectorhinchus) were encountered and an aggregation of about 40 P. vittatus was encountered at site65. Based on this evidence and brief visits to a few local fish markets, there appears to be signs ofover-fishing, especially for the larger species.Underwater observations of Napoleon Wrasse, a conspicuous indicator of fishing pressure, show thatit is probably moderately exploited, certainly not as heavily as in Indonesia or the Philippines, butmore than at Milne Bay Province in PNG (Table 8). The species appears to reach the zenith of itsabundance in the Central Pacific in uninhabited areas such as the Phoenix <strong>Islands</strong>. During the fishinventory dives at the <strong>Solomon</strong>s I encountered 56 individuals, with an estimated average total lengthof 64 cm. Most were solitary fish or occasionally loose pairs were sighted. The exception was site 14(near Malaghara I., NE tip of Isabel) where 10 juveniles (25-35 cm) were observed. The latter sightingprovides evidence for the importance of sheltered inshore reefs with mangrove shorelines as nurseryareas for this species.Table 8. Frequency of Napoleon Wrasse (Cheilinus undulatus) for various locations in the Indo-Pacific.LocationNo. sites whereseen% of total sites No. seen<strong>Solomon</strong> <strong>Islands</strong> REA 2004 31 47.69 56Phoenix <strong>Islands</strong> 2002 47 83.92 412Milne Bay, PNG – 2000 28 49.12 90Milne Bay, PNG – 1997 28 52.83 85Raja Ampat <strong>Islands</strong> – 2002 9 18.0 14Raja Ampat <strong>Islands</strong> – 2001 7 15.55 7Togean/Banggai <strong>Islands</strong> – 1998 6 12.76 8Weh Island, Sumatra – 1999 0 0.00 0Calamianes Is., Philippines – 1998 3 7.89 5124
Coral Reef Fish DiversityConservation RecommendationsThe main reason for the wealth of marine diversity in the <strong>Solomon</strong> <strong>Islands</strong> is the excellent variety ofmarine habitats. Virtually every situation is represented from highly protected, silt-laden embaymentsaround the larger islands to clear-water oceanic atolls situated well offshore. The real key toprotecting the reef resources of the <strong>Solomon</strong>s is to establish a network of MPA’s that capture arepresentative cross-section of the main habitat types, with special attention to degree of exposurefrom wind and waves, substrate type, and depth. While it is seldom possible to capture all the mainvariables within a single MPA, there is plenty of scope in the <strong>Solomon</strong>s to create an effectivenetwork. I was particularly impressed with the potential of the following sites, but there are plenty ofalternatives that are not mentioned. Two key areas that were not surveyed during the present survey,Rennell Island and Ontong Java Atoll, possess special environmental features, and need to be assessedin future. It would appear that both areas would feature prominently within a national network ofMPAs.POTENTIAL MPA SITES BASED ON FISH COMMUNITY STRUCTURE AND PHYSICAL ATTRIBUTES1. Arnavon <strong>Islands</strong> – The Arnavon Group is currently a marine conservation area. Although itwas established to protect an important turtle-nesting area, it also harbours an impressive fishcommunity. Of added interest is the brackish lagoon near the research station, whichapparently has a more or less permanent population of milkfish (Chanos chanos) and severalother species. It would be advisable to conduct a comprehensive fish survey at the Arnavonsas no doubt the resulting list would be impressive and further justify the ongoing conservationactivities.2. Haliuna Bay and vicinity – This location situated on Fauro Island in the Shortlands,supported a very diverse fish community despite its very sheltered position. Obviously thebay is well flushed. There is a good cross section of habitat within the bay includingmangrove shore, seagrass beds, shallow reef flat, rich coral areas, and an abrupt slope torelatively deep water. The bay is uninhabited and the surrounding mountainous slopes providea spectacular setting. There would also be scope at this location to encompass the moreexposed marine habitats, including the outer reef environment, that lie just outside the bay.3. Njari Island, Gizo – This is truly a world-class diving site and a prime location for an MPA.I recorded the world’s fourth highest total number of reef fishes for a single dive at thislocation (Table 9). It has all the ingredients for a prime site including strong current flushing,steep outer reef dropoff, and a sheltered reef near shore interspersed with areas of clean-sand.The island is uninhabited and would be an excellent site for a field station. There appears tobe considerable scope for marine conservation in the general vicinity, with many excellentreefs in the area as well as a few small islands that are similar to Njari.4. Marau Sound – I was highly impressed with the conservation potential of this extensive,picturesque lagoonal system at the southern tip of Guadalcanal. We only spent one day hereand I had a strong feeling that several days would be required to adequately assess itsconservation potential. There is an excellent variety of reef habitats from sheltered bays toexposed outer reefs. Of special interest are the numerous, variable-sized islands scatteredacross the sound. The human population is relatively sparse and the local community is usedto being involved in conservation projects as the Sound is the site of a Tridacna grow-outexperiment.5. Makira Harbour – The west coast of Makira was one of the most scenic areas visited duringthe survey, and the Makira Harbour area in particular appears to have excellent potential as amarine conservation site. There is an extensive network of highly sheltered bays as well asample outer reef habitat. Any MPA that is established in this area would need to include125
<strong>Solomon</strong> <strong>Islands</strong> <strong>Marine</strong> <strong>Assessment</strong> Technical Reportadjacent forestland in order to fully protect the marine environment. This is especiallyimportant as it appears that Makira is being targeted by logging operations.6. Three Sisters <strong>Islands</strong> – Some of the best underwater conditions were encountered offMalaupaina Island, including excellent visibility and a wealth of outer reef fishes. Moresurvey work is needed but the Three Sisters appears to have excellent MPA potential,providing a prime example of an offshore island system with minimal terrestrial influence.The islands are very sparsely populated and Malaupaina has an extensive shallow lagoon thatis almost entirely land-locked.7. Leli Island – Lying off the north-eastern coast of Malaita, Leli Island, has a unique “halfatoll”structure featuring a well-sheltered lagoon with mangroves and fringing reef, and a veryinteresting complex of outer reefs offering all degrees of exposure. Water clarity on outer reefdives was excellent. The island does not appear to support a permanent human population,only sporadic fishing camps.8. North-western Isabel – The general area around Kia Village provides an excellent variety ofwell-flushed sheltered reef habitats and extensive mangrove environment. It was perhaps thebest example of this sort of habitat in the entire <strong>Solomon</strong>s. The mangrove-reef habitat,although relatively poor for fish diversity is nevertheless an important one, and vital for manycommercial species, for example snappers and Napoleon Wrasse. Therefore its inclusion inany MPA network is essentialTable 9. G. Allen’s 12 all-time best dive sites for fish diversity.Rank Location No. spp.1 Wambong Bay, Kofiau, Raja Ampat Is. 2842 Kri Island, Raja Ampat Is. 2833 SE of Miosba I., Fam Is., Raja Ampat Is. 2814 Njari Island, Gizo I., <strong>Solomon</strong> Is. 2795 Watjoke Island, off SE Misool, Raja Ampat Is. 2756 Boirama Island, MBP, PNG 2707 Irai Island, Conflict Group, MBP, PNG 2688 Dondola Island, Togean Is., Indonesia 2669 Keruo Island, Fam Is., Raja Ampat Is. 26310 Pos II Reef, Menjangan I., Bali, Indonesia 26211 Kalig Island, off SE Misool, Raja Ampat Is. 26112 <strong>Equator</strong> <strong>Islands</strong>, Raja Ampat Is. 258126
Coral Reef Fish DiversityReferencesAllen, G. R. 1991. Damselfishes of the world. Aquarium Systems, Mentor, Ohio.Allen, G. R. 1993. Reef fishes of New Guinea. Christensen Research Institute, Madang, Papua NewGuinea Publ. No.8.Allen, G. R. 1998. Reef and shore fishes of Milne Bay Province, Papua New Guinea. In: Werner, T.B. and G. R. Allen (eds.). A rapid biodiversity assessment of the coral reefs of Milne BayProvince, Papua New Guinea. RAP Working Papers 11, Washington, D.C.: ConservationInternational. Pp. 39-49, 67-107.Allen, G. R. 2001a. Chapter 4. Reef of the Togean and Banggai <strong>Islands</strong>, Sulawesi, Indonesia. In:Allen, G.R., and S. McKenna (eds.). A <strong>Marine</strong> Rapid <strong>Assessment</strong> of the Togean and Banggai<strong>Islands</strong>, Sulawesi, Indonesia. RAP Bulletin of Biological <strong>Assessment</strong> 20, ConservationInternational, Washington, DC.Allen, G. R. 2001b. Reef and Shore Fishes of the Calamianes <strong>Islands</strong>, Palawan Province,Philippines. In: Werner, T.B., G.R. Allen , and S. McKenna (eds.). A Rapid <strong>Marine</strong>Biodiversity <strong>Assessment</strong> of the Calamianes <strong>Islands</strong>, Palawan Province, Philippines. Bulletinof the Rapid <strong>Assessment</strong> Program 17, Conservation International, Washington, DC.Allen, G. R. 2001c. Two new species of cardinalfishes (Apogonidae) from the Raja Ampat <strong>Islands</strong>,Indonesia. Aqua, J. Ichthy. Aquat. Biol. 4 (4): 143-149.Allen, G. R. 2001d. Description of two new gobies (Eviota, Gobiidae) from Indonesian seas. Aqua,J. Ichthy. Aquat. Biol. 4 (4): 125-130.Allen, G. R. 2002. Chapter 3. Reef fishes of the Raja Ampat <strong>Islands</strong>, Papua Province, Indonesia. In:McKenna, S., G. R. Allen, and S. Suryadi (eds.). A <strong>Marine</strong> Rapid <strong>Assessment</strong> of the RajaAmpat <strong>Islands</strong>, Papua Province, Indonesia. RAP Bulletin of Biological <strong>Assessment</strong> 22,Conservation International, Washington, DC.Allen, G. R. 2003. Reef Fishes of Milne Bay Province, Papua New Guinea. In: Allen, G.R., J.P.Kinch, S.A. McKenna, and P. Seeto (eds.) A Rapid <strong>Marine</strong> Biodiversity <strong>Assessment</strong> of MilneBay Province, Papua New Guinea – Survey II (2000). RAP Bulletin of Biological<strong>Assessment</strong> 29, Conservation International, Washington, DC.Allen, G. R. and M. Adrim. 2003. Coral reef fishes of Indonesia. Zool. Stud. 42(1): 1-72.Eschmeyer, W. N. (ed.). 1998. Catalog of Fishes. Vols. 1-3. California Academy of Sciences, SanFrancisco.Fowler, H.W. 1928. The fishes of Oceania. Mem. Bishop Mus. 10: 1-540.Fowler, H.W. 1934. The fishes of Oceania. Supplement II. Mem. Bishop Mus. 11(6): 385-466.Günther, A. 1873. Reptiles and fishes of the South Sea <strong>Islands</strong>. In: Brenchley, J. L. Jottings during thecruise of H. M. S. Curaçao among the South Sea <strong>Islands</strong> in 1865. Cruise Curaçao: 1-487, Pls.1-59.Herre, A.W. 1931. A check list of fishes from the <strong>Solomon</strong> <strong>Islands</strong>. J. Pan-Pacific Res. Instit., 6(4):4-9.Herre, A.W. 1936. Fishes of the Crane Pacific Expedition. Zool. Ser. Field Mus. Nat. Hist. 21,publication 353: 1-472, 50 figs.Myers, R. F. 1989. Micronesian reef fishes. Coral Graphics, Guam.Randall, J. E., G. R. Allen, and R. C. Steene. 1990. Fishes of the Great Barrier Reef and Coral Sea.Crawford House Press, Bathurst (Australia).Seale, A. 1935. The Templeton Crocker Expedition to western Polynesia and Melanesian islands,1933. Proc. Cal. Acad. Sci. Fourth Series, 21(27): 337-378.127
<strong>Solomon</strong> <strong>Islands</strong> <strong>Marine</strong> <strong>Assessment</strong> Technical ReportAppendicesAppendix 1. Full study area showing all numbered locations.128
Coral Reef Fish DiversityAppendix 2. Summary of Sites (colour highlights refer to three main habitat types:yellow = sheltered reefs; turquoise = exposed outer reef; pink = moderately exposed)SiteNo.Date ISLAND SITE NAMETime Depth(mins) rangeGeneral habitat113/05/2004110 0-33 Sheltered inshoreFlorida <strong>Islands</strong> Sandfly FLreef2 13/05/2004 Florida <strong>Islands</strong> Kombuana 70 1-30 Outer reef 1743 14/05/2004 Isabel Buala 65 5-33 Outer reef 1474 14/05/2004 Isabel Tatamba 100 0-30 Sheltered bay 1025 15/05/2004 Isabel Tanabafe 65 1.5-39 Outer reef 1536 15/05/2004 Isabel Popongori 75 1.5-26 Sheltered fringing 1487 16/05/2004 Isabel Sarao 70 2.5-43 Outer reef 157816/05/2004IsabelPalunuhukuraTotalSpp.196165 1-26 Sheltered bay 2199 17/05/2004 Isabel Isabel 80 1-30 Sheltered passage 1771017/05/200460 0-25 Channel with strong 160Isabel Kiacurrent11 17/05/2004 Isabel Barora Fa 85 1-34 Sheltered fringing 22012 18/05/2004 Isabel Ghaghe 95 1-15 Sheltered passage 1401318/05/200490 0-32 Sheltered fringing 177Isabel Pt Praslin(31.2514 19/05/2004 Isabel Malaghara 150 0-15 Sheltered inlet 14415 19/05/2004 Isabel Malakobi 75 2-24 Semi-exposed passage 1761620/05/2004 Arnavon90 1-31 Lagoon entrance 203Kerehikapa 1<strong>Islands</strong>1720/05/2004 Arnavon90 1-30 Outside, but lagoonal 172Kerehikapa 2<strong>Islands</strong>habitat18 21/05/2004 Choiseul Raverave 90 0-31 Outer island fringing 21819 21/05/2004 Choiseul Vealaviru 90 1-18 Sheltered inshore 11620 22/05/2004 Choiseul Ndolola 80 10-24 Sheltered bay 1572122/05/200490 0-40 Semi-exposed fringing 223Choiseul Pororeef22 23/05/2004 Choiseul Emerald 120 1-34 Outer pass 24023 23/05/2004 Choiseul Taro 105 3-28 Inner pass 16024 24/05/2004 Choiseul Chirovanga 75 2-45 Exposed outer reef 19825 24/05/2004 Choiseul Vurango 90 0-20 Sheltered lagoon 1492625/05/2004 Shortland80 0-40 Sheltered bay 198Haliuna<strong>Islands</strong>2725/05/2004 Shortland65 2-50 Exposed outer reef 198Rohae<strong>Islands</strong>2826/05/200490 1-18 Small island fringing 229ShortlandTuareef with sand and<strong>Islands</strong>bommies2926/05/2004 Shortland90 0-42 Outer reef 210Stirling 1<strong>Islands</strong>31 27/05/2004 New Georgia Vella Lavella 80 2-42 Outer reef 18932 27/05/2004 New Georgia Njari 120 1-45 Outer reef 27933 29/05/2004 New Georgia Nusazango 90 0-20 Sheltered bay 15334 29/05/2004 New Georgia Roviana 80 1-50 Passage and dropoff 23235 30/05/2004 New Georgia Penguin 90 0-19 Sheltered fringing reef 1663631/05/2004New Georgia Uepi90 0-52 Sheltered outer reef 23437 31/05/2004 New Georgia Vangunu 90 3-20 Sheltered lagoon reef 10038 1/06/2004 New Georgia Minjanga 90 0-50 Sheltered passage 233391/06/200480 0-65 Sheltered outer reef 228Russell <strong>Islands</strong> Mbilidrop-off129
<strong>Solomon</strong> <strong>Islands</strong> <strong>Marine</strong> <strong>Assessment</strong> Technical ReportSiteTime DepthTotalDate ISLAND SITE NAMEGeneral habitatNo.(mins) rangeSpp.40 2/06/2004 Russell <strong>Islands</strong> Mbaisen 100 2-40 Sheltered pass 15541 2/06/2004 Russell <strong>Islands</strong> Kovilok 65 0-50 Sheer outer wall 15242 3/06/2004 Russell <strong>Islands</strong> Sunlight 75 0-42 Sheltered pass 17743 3/06/2004 Guadalcanal Taina 70 3-42 Island fringing reef 20244 5/06/2004 Guadalcanal Cormorant 90 2-44 Outer reef passage 23545 5/06/2004 Makira Marapa 120 1-40 Sheltered bay 19046 6/06/2004 Makira Anuta 80 1-36 Outer reef w/Halimeda 16447 6/06/2004 Makira Makira 100 1-15 Sheltered fringing reef 113487/06/200480 1-36 Semi-sheltered outer 196Makira Star 1reef497/06/2004 Three Sisters70 1-30 Sheltered passage 144Star 2<strong>Islands</strong>508/06/2004 Three Sisters85 1-45 Outer platform 189Malaupaina 1<strong>Islands</strong>51 8/06/2004 Makira Malaupaina 2 165 1-42 Leeward outer reef 24352 9/06/2004 Makira Bio 90 1-35 Leeward outer reef 25553 9/06/2004 Malaita Ugi 80 1-40 Leeward outer reef 20154 10/06/2004 Malaita Komusupa 100 1-52 Outer to inner Passage 2415510/06/200490 0-15 Lagoon fringing reef 144Malaita Umuaround mangrove islet5611/06/200480 1-32 Inner passage grading 210Malaita Pt Adamsto lagoonal5712/06/200490 2-36 Well-sheltered outer 197Malaita Leili1reef slope58 12/06/2004 Malaita Leili 2 70 3-40 Outer reef 18159 13/06/2004 Malaita Toi 85 3-29 Outer passage 2036013/06/2004 Indispensible85 2-50 Fringing reef in large 191SuafaStraitbay6114/06/2004 Indispensible75 4-50 Steep outer slope 206Alite 1Strait62 14/06/2004 Nughu Island Alite 2 80 6-25 Lagoonal sand patches 12663 15/06/2004 Florida <strong>Islands</strong> Nughu 85 2-40 Outer reef slope 2006415/06/200490 0-25 Sheltered fringing reef 140Savo Island Tulaghi& mangrove shore6516/06/200485 1-35 Outer reef gradual 203Guadalcanal Savosloping66 16/06/2004 Guadalcanal Tambea 90 2-36 Outer reef, rubble slope 176Note: Site 30 is missing from the table above. This was done to allow for consistency in site names andlocations between this report and the Coral Communities and Reef Health report.Note: Latitude and longitude data is not included, but can be found in the chapter provided by Emre Turak. Thefollowing table includes this information for the six sites that were omitted from Turak’s coverage when he wasforced out of the water for a few days due to an ear problem.Site no. Latitude Longitude Site no. Longitude Latitude57 8° 45.5’S 160° 59.5’E 60 8° 18.8’ S 160° 40.7’E58 8° 46.7’S 161° 01.5’E 61 8° 52.746’S 160° 36.615’E59 8° 19.332’S 160° 39.577’E 62 8° 52.4’S 160° 36.6’E130
Coral Reef Fish DiversityAppendix 3. List of the Reef Fishes of the <strong>Solomon</strong> <strong>Islands</strong>Compiled by Gerald R. AllenThis list includes all species of shallow (to 60 m depth) coral reef fishes known from the <strong>Solomon</strong> <strong>Islands</strong> at 20June 2004. The list is based on the following sources:1) Results of the 2004 TNC REA; 2) examination of specimens at the United States National Museum,Smithsonian Institution (Washington D.C., USA); 3) and various literature records, most of which appear inrelatively recent generic and family revisions. The family classification used here is mainly based onEschmeyer’s Catalog of Fishes (1998).Terms relating to relative abundance are as follows: Abundant - Common at most sites in a variety of habitatswith up to several hundred individuals being routinely observed on each dive. Common - seen at the majority ofsites in numbers that are relatively high in relation to other members of a particular family, especially if a largefamily is involved. Moderately common - not necessarily seen on most dives, but may be relatively commonwhen the correct habitat conditions are encountered. Occasional - infrequently sighted and usually in smallnumbers, but may be relatively common in a very limited habitat. Rare - less than 10, often only one or twoindividuals seen on all divesNote: Site 30 was not surveyed for fishes.SPECIESSITE RECORDSABUNDANCE/BASIS OF RECORD IF NOTCOLLECTED DURING READEPTH(m)ORECTOLOBIDAENebrius ferrugineus (Lesson, 1830) 28 Rare, one seen by B. Kahn. 1-70HEMISCYLLIDAEChiloscyllium indicum (Gmelin, 1789) Günther, 1873CARCHARHINIDAECarcharhinus albimarginatus (Rüppell, 35 Rare, one seen by B. Kahn. 14-401837)C. amblyrhynchos (Bleeker, 1856) 5, 7, 27, 28, 31, 32, 35, 36, 38, Occasional, infrequently sighted during survey, three seen 0-10052, 53, 54, 57, 59, 63, 65at site 27.C. melanopterus (Quoy and Gaimard, 7, 17, 20, 22, 27, 57, 59 Occasional. Four adults seen at site 59. 0-101824)Galeocerdo cuvier (Péron and Lesueur,Compagno, 1984 0-1501822)Negaprion acutidens (Rüppell, 1835) 28 Rare, one seen by B. Kahn.Triaenodon obesus (Rüppell, 1835) 11, 22, 24, 27, 32, 34, 36, 38, 43, Occasional, usually seen on outer slopes.44, 45, 52, 59, 61, 65DASYATIDIDAEDasyatis kuhlii (Müller and Henle, 1841) 23, 28 Rare. 2-50Himantura granulata (Macleay, 1883) 24 Rare, one seen in 20 m on outer reef. 1-85Taeniura lymma (Forsskål, 1775) 28, 45, 47, 52, 56 Rare, only five individuals observed. 2-30T. meyeni (Müller and Henle, 1841) 15 Rare, a single individual observed. 1-200MYLIOBATIDAEAetobatus maculatus (Gray, 1832) 7, 35 Rare, only two seen. 1-25A. narinari (Euphrasen, 1790) 7, 18, 22, 23, 34, 35, 48, 61 Occasional, usually on outer slopes. Three seen at site 22. 0-40MOBULIDAEManta birostris (Walbaum, 1792)None seen during survey, but no doubt occurs in0-100<strong>Solomon</strong>s.Mobula tarapacana (Philippi, 1892) 28 Several seen by B. Kahn. 0-40MORINGUIDAEMoringua sp. USNM collection. 1-10CHLOPSIDAEKaupichthys brachychirus Schultz, 1953 USNM collection. 5-25MURAENIDAEAnarchias allardicei Jordan and Starks,USNM collection. 1-301906Echidna nebulosa (Thünberg, 1789) USNM collection. 1-10E. polyzona (Richardson, 1845) USNM collection. 1-15Gymnothorax buroensis (Bleeker, 1857) USNM collection. 1-25G. chilospilus Bleeker, 1865 Seale, 1935G. fimbriatus (Bennett, 1831) USNM collection. 0-30G. flavimarginatus (Rüppell, 1828) 50 Rare, only 1 seen. 1-150G. javanicus (Bleeker, 1865) 13, 32, 35, 54, 59 Rare, only five seen during survey. Photographed. 0.5-50G. margaritophorus Bleeker, 1865 50 One collected with rotenone. 1-40G. melatremus Schultz, 1953 52, 61 Two collected with rotenone. 5-30131
<strong>Solomon</strong> <strong>Islands</strong> <strong>Marine</strong> <strong>Assessment</strong> Technical ReportSPECIESSITE RECORDSABUNDANCE/BASIS OF RECORD IF NOT DEPTHCOLLECTED DURING REA(m)G. pictus (Ahl, 1789) USNM collection. 0-3G. polyuranodon (Bleeker, 1853) USNM collection. 0-2G. richardsoni (Bleeker, 1852) USNM collection. 0-5G. robinsi Böhlke, 1997 USNM collection. 0-30G. undulatus (Lacepède, 1803) Günther, 1873G. zonipectus Seale, 1906 USNM collection. 8-45Pseudechidna brummeri (Bleeker, 1859) USNM collection. 1-10Rhinomuraena quaesita Garman, 1888 66 Rare, only 1 seen. Photographed. 1-50OPHICHTHIDAEBrachysomophis henshawi Jordan andMcCosker and Randall, 2001 1-15Snyder, 1904Leiuranus semicinctus (Lay and Bennett,Seale, 19351839)Muraenichthys gymnopterus (Bleeker,Seale, 19351853)M. macropterus Bleeker, 1857 61 One collected with rotenone.Myrichthys colubrinus (Boddaert,1781) USNM collection. 0-8M. maculosus (Cuvier, 1816) USNM collection. 0-30Schultzidia retropinnis (Fowler, 1934) USNM collection. 1-20CONGRIDAEAriosoma scheelei (Strömman, 1896) USNM collection. 0-5Gorgasia barnesi Robison and Lancraft,Castle and Randall, 1995depth1984 fine spottingG. maculata Klausewitz and Eibesfeldt, 18, 24, 34, 44, 54, 59 Occasional, but locally common. 20-501959Heteroconger cobra Bohlke and Randall,Castle and Randall, 1995Type loc. is 7 mi. W. of Honiara 30-401981in 30-36 m near wreck of Jap. transport.H. haasi (Klausewitz and Eibl-18, 28, 34, 43, 56, 59, 62, 65 Occasional, but locally abundant. Photographed. 3-45Eibesfeldt, 1959)CLUPEIDAESpratelloides delicatulus (Bennett, 1832) 1, 16, 17, 22, 38 Occasional, hundreds seen schooling near surface at 0-1several sites.CHANIDAEChanos chanos (Forsskal, 1775) 15, 28 Rare, a few large adults sighted. 1-20PLOTOSIDAEPlotosus lineatus (Thünberg, 1787) 15, 28, 49, 55, 56 Occasional, several schools of juveniles containing up to 1-20about 100 fishes observed. Photographed.SYNODONTIDAESaurida gracilis (Quoy and Gaimard,1824)11, 45, 64 Rarely sighted, but difficult to detect. 1-30Synodus dermatogenys Fowler, 1912 1, 6, 9, 12, 13, 16, 21, 23, 25, 28,31, 32, 35, 37, 43-45, 54, 59, 65,66Moderately common, solitary individuals usually seenresting on dead coral or rubble. Photographed.S. jaculum Russell and Cressy, 1979 24, 28, 32, 36, 48, 51 Occasional on rubble bottoms. 10-50S. variegatus (Lacepède, 1803) 1, 6, 8, 26, 39, 42, 44, 46, 48, 56, Occasional, solitary individuals or pairs usually seen 5-5058resting on live coral. Photoraphed.Trachinocephalus myops (Forster, 1801) Seale, 1906OPHIDIIDAEBrotula multibarbata (Temminck andUSNM collection. 5-150Schlegel, 1846)CARAPIDAEEncheiliophis homei (Richardson, 1844) USNM collection. 2-30BYTHITIDAEBrosmophyciops pautzkei Schultz, 1960 USNM collection. 5-55Ogilbia sp. 0-5ANTENNARIIDAEAntennarius analis (Schultz, 1957) Pietsch and Grobecker, 1987A. biocellatus Cuvier, (1817) Pietsch and Grobecker, 1987A. coccineus (Lesson, 1830) Pietsch and Grobecker, 1987A. comersonii (Latreille, 1804) Pietsch and Grobecker, 1987 1-40A. dorehensis Bleeker, 1859 Pietsch and Grobecker, 1987A. nummifer Cuvier, (1817) USNM collection.A. pictus (Shaw and Nodder, 1794) USNM collection. 1-15A. striatus (Shaw, 1794) Pietsch and Grobecker, 1987 10-200Antennatus tuberosus Cuvier, (1817) Pietsch and Grobecker, 1987GOBIESOCIDAEDiademichthys lineatus (Sauvage, 1883) 45, 55, 64 Generally rare, but moderately common at site 64 where 3-20Diadema abundant.MUGILIDAECrenimugil crenilabis (Forsskål, 1775) 21, 41 Rare, two small schools seen. 0-4Liza vaigiensis (Quoy and Gaimard, 32, 40 Rare, two schools seen. No doubt abundant in0-31825)seagrass/estuarine habitat.Valamugil seheli (Forsskål, 1775) Fowler, 19281-25132
Coral Reef Fish DiversitySPECIESSITE RECORDSABUNDANCE/BASIS OF RECORD IF NOTCOLLECTED DURING READEPTH(m)ATHERINIDAEAtherinomorus endrachtensis (Quoy andUSNM collection. 0-2Gaimard, 1825)A. duodecimalis (Valenciennes, 1835) USNM collection. 0-2A. lacunosus (Forster, 1801) 1, 10, 21, 29, 32, 38,34 Occasional. Several large schools seen. 0-2Hypoatherina barnesi Schultz, 1953 USNM collection. 0-2H. ovalua (Herre, 1935) USNM collection. 0-2H. temminckii (Bleeker, 1853) USNM collection. 0-2Iso sp. USNM collection. 0-2Stenatherina panatela (Jordan andRichardson, 1908)22, 39 Locally abundant at 2 sites. Collected and photographed. 0-4BELONIDAETylosurus crocodilus (Peron and1, 9, 16, 18, 24, 32, 34, 36, 39, Moderately common on surfaces at several sites. 0-4Lesueur, 1821)42, 52, 54, 56, 57HEMIRAMPHIDAEHemirhamphus far (Forsskål, 1775) Photographed in seagrass beds by Len McKenzie. 0-2Hyporhamphus affinis (Günther, 1866) 21, 36 Two schools seen at surface. 0-2H. dussumieri (Valenciennes, 1846) Herre, 1931Zenarchopterus dispar (Valenciennes,1847)10, 13, 21, 39 Common along edge of mangroves along shore at severalsites. Photographed.Z. dunckeri Mohr, 1926 USNM collection.HOLOCENTRIDAEMyripristis adusta Bleeker, 1853 8, 23, 24, 28, 31, 36, 45, 54 Occasional, sheltering in caves and under ledges 3-30M. amaena (Castelnau, 1873) 7, 17, 21 Rarely seen, but cryptic during day.M. berndti Jordan and Evermann, 1902 2, 3, 5, 13, 18, 23, 24, 29, 31, 32,36, 38, 39, 44, 48, 51-54, 58, 59,63, 66Moderately common, sheltering in caves and under ledges.Most abundant at site 65.M. botche Cuvier, 1829 11 Rare, several seen in 30 m depth. RandallM. hexagona (Lacepède, 1802) 6, 8, 13, 26, 55, 64 Occasional, usually in coastal areas affected by silt. 10-40M. kuntee Valenciennes, 1831 1-3, 5, 7-11, 13, 15-17, 22-24, Common, sheltering in caves and under ledges, but 5-3025, 27-32, 34-36, 38, 39, 42-46,48, 49, 51-63, 65, 66frequently exposes itself for brief periods. Photographed.M. murdjan (Forsskål, 1775) 13, 16, 21, 29, 31, 44, 48, 59, 63 Occasional, sheltering in caves and under ledges. 3-40M. pralinia Cuvier, 1829 8, 11, 16, 21, 29, 31, 36, 38, 39 Occasional, but shleters deep in crevices during the day. 3-40M. trachyacron Bleeker, 1863 Randall and Greenfield, 1996 RandallM. violacea Bleeker, 1851 1, 4, 6, 8-18, 20-39, 40, 42, 43, Common, most abundant squirrelfish seen in <strong>Solomon</strong>s. 3-3045, 47-49, 52-57, 59, 60, 63 Often seen at entrance of crevices.M. vittata Valenciennes, 1831 21, 32, 34, 36, 38, 39, 41, 51, 52, Moderately common, sheltering in caves and ledges on 12-8056, 57, 60drop-offs. Photographed.Neoniphon argenteus (Valenciennes, 1, 3, 4, 8,10, 11, 25, 33, 35, 37, Common among braching Acropora corals. 3-301831)38, 40, 42, 45-47, 56, 57N. opercularis (Valenciennes, 1831) 4, 18, 33, 34, 38, 39, 44, 47, 63 Occasional. Photographed. 3-20N. sammara (Forsskål, 1775) 7-9, 11-13, 16-18, 21-26, 28, 31,32, 34, 35, 38, 39, 40, 42-49, 51,53-57, 59, 60Sargocentron caudimaculatum (Rüppell,1835)1, 2, 3, 5, 6, 7, 11, 13, 18, 21-24,27-32, 34, 36, 38, 39, 41-46, 48-54, 57-63, 65, 668-55Moderately common, usually among branches of staghorn 2-50Acropora coral. Especially abundant at sites 42 and 55.Photographed.Common, always seen close to cover. 6-45S. cornutum (Bleeker, 1853) 66 6-50S. diadema (Lacepède, 1802) 1, 11, 24, 40, 45, 46, 48, 60, 62, Occasional, but common at site 62. Photographed. 2-3066S. ittodai (Jordan and Fowler, 1903) Randall, 1998 6-70S. melanospilos (Bleeker, 1858) 66 Rare, only 2 seen. Photographed. 10-25S. microstomus (Günther, 1859) 51, 56, 59 Rarely sighted, but nocturnal. 1-180S. praslin (Lacepède, 1802) Randall, 1998 2-15S. punctatissimum (Cuvier, 1829) Randall, 1998 0-30S. rubrum (Forsskål, 1775) 64 Rare, only 2 seen.S. spiniferum (Forsskål, 1775) 9, 11, 12, 16-18, 21, 22, 24, 32, Moderately common, in caves and under ledges.5-12233, 35, 36, 38, 39, 45-47, 49-54,61, 65Photographed.S. tiere (Cuvier, 1829) 32 Rarely seen, but nocturnal. 10-180S. tieroides (Bleeker, 1853) 16, 29, 52, 66 Rarely seen, but nocturnal. 10-40S. violaceus (Bleeker, 1853) 10, 25, 33, 38, 44, 45, 47, 60 Rarely seen, but cryptic during day. 3-30PEGASIDAEEurypegasus draconis (Linnaeus, 1766) Palsson and Pietsch, 1989. 2-20AULOSTOMIDAEAulostomus chinensis (Linnaeus, 1766) 2, 3, 5, 13, 16, 18, 22, 26, 31, 32,33, 36, 39, 41, 42, 45, 51-54, 56,57, 60, 62, 63, 65, 66FISTULARIIDAEModerately common, but always in low numbers.Photographed.2-122133
<strong>Solomon</strong> <strong>Islands</strong> <strong>Marine</strong> <strong>Assessment</strong> Technical ReportSPECIESSITE RECORDSABUNDANCE/BASIS OF RECORD IF NOT DEPTHCOLLECTED DURING REA(m)Fistularia commersoni Rüppell, 1835 10, 19, 28, 32, 34, 44, 52 Rarely seen. 2-128CENTRISCIDAEAeoliscus strigatus (Günther, 1860) 9 Rare, one school observed. 1-30Centriscus scutatus (Linnaeus, 1758) 55 Rare, one school observed. Photographed. 1-30SOLENOSTOMIDAESolenostomus paradoxus (Pallas, 1770) Orr and Fritzsche, 1993 5-25SYNGNATHIDAEBhanotia fasciolata (Dumeril, 1870) Dawson, 1985Choeroichthys brachysoma (Bleeker,Dawson, 19851855)C. sculptus (Günther, 1870) Dawson, 1985 0-30Corythoichthy amplexus Dawson andDawson, 1985 8-25Randall, 1975C. haematopterus (Bleeker, 1851) 37, 42 Rare, only 2 seen. 1-20C. intestinalis (Ramsay, 1881) 1, 25, 28 Rare, only 3 seen. Photographed. 1-25C. ocellatus Herald, 1953 Dawson, 1985 1-15Doryrhamphus excisus Kaup, 1856 Dawson, 1985 2-50D. janssi (Herald and Randall, 1972) Dawson, 1985 5-35Dunckerocampus dactyliophorus64 Rare, only one seen. Photographed. 1-56(Bleeker, 1853)D. naia Allen and Kuiter, 2004 36 Rare, but cryptic in holes and under ledges. Only two seen. 20-40Festucalex erythraeus (Gilbert, 1905) Dawson, 1985 2-20Halicampus. dunckeri (Chabanaud,Dawson, 1985 2-201929)H. macrorhynchus Bamber, 1915 Dawson, 1985 3-30Hippocampus bargibanti Whitley, 1970 One seen by reef survey team. Probably not uncommon, 10-40but difficult to detect.Micrognathus andersoni (Bleeker, 1858) Dawson, 1985 2-15M. brevirostris (Rüppell, 1838) Dawson, 1985 2-15Phoxocampus belcheri (Kaup, 1856) Dawson, 1985 2-20Phoxocampus diacanthus (Schultz, 1943) Dawson, 1985 2-20Siokunichthys breviceps Smith, 1963 Dawson, 1985 10-20Syngnathoides biaculeatus (Bloch, 1785) Dawson, 1985 0-10SCORPAENIDAEDendrochirus biocellatus (Fowler, 1935) 38 One specimen seen by B. Kahn in cave. 1-40Pterois antennata (Bloch, 1787) 55, 66 Rare, only two seen at one site. Photographed. 1-50P. mombasae Smith, 1957 66 Rare, only one seen. Photographed.P. volitans (Linnaeus, 1758) 14, 18, 24, 43, 66 Rare, except about 6 seen at sight 14. Photographed. 2-50Scorpaenodes. guamensis (Quoy andUSNM collection. 0-10Gaimard, 1824)S. hirsutus (Smith, 1957) 52 One collected with rotenone. 5-40S. parvipinnis (Garrett, 1863) USNM collection. 2-50S. varipinnis Smith, 1957 USNM collection. 1-50Scorpaenopsis diabolus (Cuvier, 1829) Randall and Eschmeyer, 2001 1-70S. papuensis (Cuvier, 1829) 45, 48, 64, 65 Rare, only 3 seen, but difficult to detect. 1-40S. possi Randall and Eschmeyer, 2001 Randall and Eschmeyer, 2001 1-40S. vittapinna Randall and Eschmeyer,Randall and Eschmeyer, 2001 3-402001Sebastapistes cyanostigma (Bleeker, 2, 5 Probably not uncommon, but only two seen among coral 2-151856)branches.S. strongia (Cuvier, 1829) USNM collection. 1-15Taenianotus triacanthus (Lacepède,Fowler, 19341802)SYNANCEIIDAEInimicus didactylus (Pallas, 1769) Fowler, 1934Synanceia alua Eschmeyer and Rama-USNM collection. 1-25Rao, 1973S. verrucosa Bloch and Schneider, 1801 Günther, 1873TETRAROGIDAEAblabys taenianotus (Cuvier, 1829) Seale, 1906PLATYCEPHALIDAECymbacephalus beauforti Knapp, 1973 39, 55 Rare, only 2 seen, but difficult to detect. 2-12Eurycephalus otaitensis (Cuvier, 1829) 48 One collected with rotenone. 1-80Thysanophrys arenicola (Schultz, 1966) USNM collection. 1-15T. celebica (Bleeker, 1854) USNM collection. 1-20T. chiltoni Schultz, 1966 USNM collection. 1-80SERRANIDAEAethaloperca rogaa (Forsskål, 1775) 1, 13, 18, 28, 29, 32, 43, 59 Occasional. 1-55134
Coral Reef Fish DiversitySPECIESAnyperodon leucogrammicus(Valenciennes, 1828)SITE RECORDS3, 5, 8, 15, 16, 18, 20, 22-24, 32,34, 36, 39, 42-45, 50-54, 57, 58,61, 63, 65, 66ABUNDANCE/BASIS OF RECORD IF NOTCOLLECTED DURING REAModerately common, although always in low numbers.Photographed.DEPTH(m)5-50Aporops bilinearis Schultz, 1943 USNM collection. 1-30Belonoperca chabanaudi Fowler and 38, 39, 52 Rare, a few seen in caves on drop offs. 4-45Bean, 1930Cephalopholis argus Bloch and5, 6, 7, 13, 18, 21, 22, 24, 27, 34, Occasional. 1-40Schneider, 180136, 39, 44, 46, 48, 51, 54, 65, 66C. boenack (Bloch, 1790) 4, 6, 11, 16, 17, 26, 33, 37, 40 Occasional, in silty harbors and bays. 1-20C. cyanostigma (Kuhl and Van Hasselt, 1, 3, 4, 6, 8, 9, 12-16, 18-23, 25, Moderately common in more sheltered areas.2-351828)26, 28, 29, 32, 34-36, 38-41, 43-45, 52-55, 58, 60-64Photographed.C. leopardus (Lacepède, 1802) 2, 5, 7, 8, 15, 17, 18, 20-24, 26- Common. Photographed. 3-2528, 32, 34-36, 38, 39, 42-45, 50-55, 57-62, 65, 66C. microprion (Bleeker, 1852) 1, 4, 8, 9, 11, 12, 14, 16, 17, 19, Occasional on relatively silty reefs. 2-2020, 25, 26, 37, 40, 43, 45, 47, 64C. miniata (Forsskål, 1775) 1, 18, 26, 32, 36, 39, 51 Occasional, usually in areas of clear water. 3-150C. polleni (Bleeker, 1868) 41 Rare, one seen in 40 m depth. 20-120C. sexmaculata Rüppell, 1828 15, 18, 21, 26, 32, 34, 36, 38, 39, Occasional, on ceilings of caves on steep drop-offs. 6-14041, 54, 56, 60, 61Photographed.C. sonnerati (Valenciennes, 1828) 44, 48 Rare, only 2 seen. 10-100C. spiloparaea (Valenciennes, 1828) 5, 7, 8, 11, 16, 24, 26, 27, 28, 31,32, 34, 36, 39, 44, 50-52, 58, 61,65C. urodeta (Schneider, 1801) 2, 5, 6, 7, 8, 15, 21, 22, 24, 27-32, 34, 36, 38, 39, 41-44, 46, 48-54, 57, 58, 60-63, 65, 66Cromileptes altivelis (Valenciennes,1828)Moderately common in deep water (below 20 m) of outerslopes.16-108Common in variety of habitats. 1-361, 3, 36, 63 Rare only 7 seen. 2-40Diploprion bifasciatum Cuvier, 1828 5, 33, 58, 63 Rarely seen. 2-25Epinephelus. caeruleopunctatus (Bloch, 2, 7, 24, 31, 36, 38-40, 51, 52, Occasional. 5-251790)60, 63E. coioides (Hamilton, 1822) 20, 23 Rare, only two seen. Kahn photo. 2-100E. corallicola (Kuhl and Van Hasselt, 31, 44, 47, 54, 58, 60 Rare, only four individuals sighted. Photographed. 3-151828)E. cyanopodus Richardson, 1846 Randall and Heemstra, 1991E. fasciatus (Forsskål, 1775) 2, 6, 10, 20, 35, 53 Rare, less than 10 seen. 4-160E. fuscoguttatus (Forsskål, 1775) 8, 14, 29, 31, 32, 34, 41, 43, 58 Occasional. 3-60E. hexagonatus (Bloch and Schneider,Randall and Heemstra, 1991 3-101801)E. macrospilos (Bleeker) Randall and Heemstra, 1991 5-25E. maculatus (Bloch, 1790) 1, 8, 18, 22, 44, 46, 48-50, 51, Occasional, around rocky outcrops on sandy slopes. 10-8053, 55E. melanostigma Schultz, 1953 48, 51 Rare, only 2 seen.E. merra Bloch, 1793 1, 6, 8, 10, 11, 15-18, 20-22, 26, Moderately common in shallow areas. Photographed. 1-1528, 32, 33, 35, 42, 43, 45-49, 51-56, 64E. ongus (Bloch, 1790) 8, 11, 28, 34, 40, 64 Rare, less than 10 seen. 5-25E. polyphekadion (Bleeker, 1849) 7, 21, 54, 61 Rare, only 4 seen. 2-45E. spilotoceps Schultz, 1953 21, 50 Rare, only 2 seen. 1-15E. tauvina (Forsskål, 1775) Randall and Heemstra, 1991E. undulosus (Quoy and Gaimard, 1824) Randall and Heemstra, 1991 10-90Grammistes sexlineatus (Thünberg, 22 Rare, only one seen. 0.5-301792)Grammistops ocellatus Schultz, 1953 61 One collected with rotenone. 5-30Gracila albimarginata (Fowler and 7, 8, 13, 18, 22, 27, 29-32, 34, Occasional on outer slopes. 6-120Bean, 1930)36, 39, 41, 43, 50-54, 58, 60, 61Liopropoma mitratum Lubbock andRandall and Taylor, 1988 3-46Randall, 1978L. multilineatum Randall and Taylor,Randall and Taylor, 19881988L. susumi (Jordan and Seale, 1906) Randall and Taylor, 1988 2-34Luzonichthys waitei (Fowler, 1931) 32, 36, 43 Rarely seen, but locally abundant at 3 sites. Photographed. 10-55Plectranthias longimanus (Weber, 1913) Randall, 1980 6-75Plectropomus areolatus (Rüppell, 1830) 11, 13, 36, 54, 56 Rare, less than 10 seen. 2-30P. laevis (Lacepède, 1802) 1, 28, 31, 34 Rare, only 5 seen. 4-90P. leopardus (Lacepède, 1802) 1, 10, 11, 15, 16, 24, 57, 59 Occasional, mainly on outer slopes. 3-100P. maculatus (Bloch, 1790) 8, 9, 14, 19, 20, 26, 33, 37, 40 Occasional, mainly on silty, sheltered reefs. 2-30P. oligocanthus (Bleeker, 1854) 4, 13, 16, 31, 36, 38, 39, 41, 43, Occasional on outer slopes and in passages. Large (1 m) 4-4045, 53, 54, 56, 59-61fish at 13. Photographed.Pseudanthias dispar (Herre, 1955) 28, 32, 34, 36, 43, 50, 51, 53, 60,63, 65Occasional and locally abundant at a few sites.Photographed.4-40135
<strong>Solomon</strong> <strong>Islands</strong> <strong>Marine</strong> <strong>Assessment</strong> Technical ReportSPECIESSITE RECORDSP. huchtii (Bleeker, 1857) 1, 2, 22, 27-29, 32, 36, 39, 42,43, 44, 51-54, 56, 60, 61, 63, 65,66P. hutomoi (Allen and Burhanuddin,1976)ABUNDANCE/BASIS OF RECORD IF NOTCOLLECTED DURING REAModerately common and locally abundant at a few sites.Very abundant at site 63. Photographed.DEPTH(m)4-2026 Rare, aggregation of about 20 fish seen in 40 m. 30-60P. hypselosoma Bleeker, 1878 28, 48 Rare, only a few seen at two sites. 10-40P. lori Lubbock and Randall, 1976 USNM collection.P. luzonensis (Katayama and Masuda, 11 Rare, group of about 10 seen in 30 m. 12-601983)P. pleurotaenia (Bleeker, 1857) 5, 7, 8, 18, 22, 24, 27, 29-32 34, Moderately common, on outer slopes below about 20 m 15-18036, 39, 42-44, 50-54, 56-58, 61,63, 65, 66depth. Phtographed.P. rubrizonatus (Randall, 1983) Randall, 1983. Savo is type locality. 15-133P. squamipinnis (Peters, 1855) 7, 32, 34, 36 Rare. 4-20P. tuka (Herre and Montalban, 1927) 1, 7, 8, 13, 15, 18, 21, 23, 27, 29-32, 34, 36, 38, 39, 41-45, 50-54,56-59, 61P. smithvanizi (Randall and Lubbock,1981)Pseudogramma polyacantha (Bleeker,1856)Common in a variety of habitats, but usually in areasexposed to currents. Photographed.29, 32, 34, 36, 39, 44, 51 Occasional aggregations seen, but abundant at site 51. 6-7061 One collected with rotenone. 1-15Suttonia lineata Gosline, 1960 USNM collection. 3-30Variola albimarginata Baissac, 1953 2, 5, 6, 15, 22, 24, 27, 42-44, 50, Occasional and always in low numbers. 12-9057, 58, 61, 63, 66V. louti (Forsskål, 1775) 3, 9-11, 15, 16, 23, 28, 31, 34, Occasional and always in low numbers. 4-15036, 38, 39, 44-46, 51-53, 58PSEUDOCHROMIDAECypho purpurescens (De Vis, 1884) 3, 29, 31, 39, 46, 51-53, 59 Occasional at base of deep gullies and in caves.5-35Photographed.Pseudochromis bitaeniatus (Fowler, 11, 32, 36, 39, 54 Occasional, among crevices and ledges. 5-301931)P. cyanotaenia Bleeker, 1857 44, USNM Rare. Seen only once, but cryptic. 0-10P. fuscus (Müller and Troschel, 1849) 1, 4, 8, 10, 12-16, 19, 20, 25, 26, Occasional, around small coral and rock outcrops. 1-3029, 33, 35, 37, 40, 45, 47, 49, 55,57, 64P. jamesi Schultz, 1943 USNM USNM collection. 3-15P. marshallensis (Schultz, 1953) 15, 16, 31, 32, 34, 36, 39, 43, 50, Occasional under rocky overhangs. Photographed. 2-2551, 54, 56, 64, 65P. paccagnellae Axelrod, 1973 1, 6, 8, 10, 11, 13, 17, 18, 21-27, Moderately common at base of steep slopes.6-7029-32, 34, 36, 38, 39, 41, 42-44,48-54, 56-58, 60, 61, 65, 66Photographed.P. sp. 1 (sim. to perspicillatus) 22 Two seen in 30 m. Possibly an undescribed species similar 5-25to P. perspicillatus.P. tapeinosoma Bleeker, 1853 28 Rare. Seen only once, but cryptic. 2-60Pseudoplesiops immaculatus Gill andUSNM collection.Edwards, 2002P. knighti Allen, 1987 52, 61 Two collected with rotenone. 5-35P. typus Bleeker, 1858 USNM collection. 5-30PLESIOPIDAEBelonepterygium fasciolatum (Ogilby,USNM collection. 1-151889)Plesiops cephalotaenia Inger, 1955 Mooi, 1995 0-10P. coeruleolineatus Rüppell, 1835 Mooi, 1995 0-19P. corallicola Bleeker, 1853 Mooi, 1995 0-3P. verecundus Mooi, 1995 Mooi, 1995 0-10Steeneichthys plesiopsus Allen and 34 One collected with quinaldine sulphate. 3-40Randall, 1985CIRRHITIDAECirrhitichthys falco Randall, 1963 3, 5, 6, 8, 15, 22, 24, 27, 29, 36, Moderately common. Photographed 4-4541, 42, 44, 46, 48, 52-54, 56, 57,59, 62, 63, 65, 66C. oxycephalus (Bleeker, 1855) 5, 7, 21, 22, 27, 32, 34, 44, 36, Occasional. Abundant at 5. 2-4061, 65Cyprinocirrhites polyactis (Bleeker,Rare. 10-1321875)Oxycirrhitus typus Bleeker, 1857 22, 32, 36, 41 Rare, only 4 seen, usually among black coral on steepslopes.10-100Paracirrhites arcatus (Cuvier, 1829) 2, 3, 5, 7, 11, 13, 15, 18, 21, 22,24, 27-32, 36, 38, 39, 41, 44, 46,48-54, 57-61, 65, 66P. forsteri (Schneider, 1801) 2, 3, 5, 6-8, 11, 13, 15, 18, 21,22, 24-28, 31, 32, 34, 36, 39, 42,43, 44, 46, 48, 50-54, 56, 58, 59,62, 63, 65, 66Common, one of two most abundant hawkfish in<strong>Solomon</strong>s, seen on regular basis, but in relatively lownumbers. Photographed.Common, one of two most abundant hawkfish in<strong>Solomon</strong>s, seen on regular basis, but in relatively lownumbers. Photographed.8-251-351-35136
Coral Reef Fish DiversitySPECIESSITE RECORDSABUNDANCE/BASIS OF RECORD IF NOTCOLLECTED DURING REAOPISTOGNATHIDAEOpistognathus sp. 1 6, 27 Rare, one collected with rotenone at site 6. 5-20TERAPONTIDAETerapon jarbua (Forsskål, 1775) USNM USNM collection. 0-5PRIACANTHIDAEHeteropriacanthus cruentatus (Lacepède, 6 Rare, one juvenile collected with quinaldine. 1-301801)Priacanthus hamrur (Forsskål, 1775) 1, 2, 18, 28, 46, 63 Rare, only 6 seen. 5-80APOGONIDAEApogon abogramma Fraser and Lachner, 32, 36, 38, 60 Rare, a few individuals seen in caves below 30 m depth. 20-401985Photographed.A. angustatus (Smith and Radcliffe, 2, 24, 36, 66, Rare, less than 10 seen. 5-301911)A. apogonides (Bleeker, 1856) 48 Rare, aggregation of about 30 fish seen. 12-40A. bandanensis Bleeker, 1854 8, 20, 42, 45, 55, 64 Occasional amongst branching Porites at sheltered sites. 3-10Photographed.A. caudicinctus Randall and Smith, 1988 USNM collection. 1-30A. chrysotaenia Bleeker, 1851 22 Rare. 1-14A. compressus (Smith and Radcliffe, 1, 8, 9, 10, 12, 14, 16, 17, 20, 25, Common, one of most abundant cardinalfishes seen during 2-201911)26, 32, 33, 35, 37, 38, 42, 45, 55 the day, usually among branching Acropora and Poritescorals at sheltered sites. Photographed.A. crassiceps Garman, 1903 61 One collected with rotenone. 1-30A. cyanosoma Bleeker, 1853 1, 28, 55, 56, 62 Rare, only a few encountered. Photographed. 3-15A. caudicinctus Randall and Smith, 1988 USNM collection.A. dispar Fraser and Randall, 1976 USNM collection. 12-50A. doryssa (Jordan and Seale, 1906) USNM collection.A. exostigma Jordan and Starks, 1906 6, 14, 16, 38, 39, 48, 55 Occasional in caves and crevices. 3-25A. fraenatus Valenciennes, 1832 1, 6, 11, 14-17, 20, 21, 26, 28, Occasional, but locally common under ledges and in coral 3-3548, 54, 55, 56crevices. Photographed.A. fragilis Smith, 1961 8, 9, 26, 33, 37, 40, 45, 47 Occasional, but locally abundant among braching corals. 1-15Common at site 37. Photographed.A. gilberti (Jordan and Seale, 1905) 33, 37 Generally rare, except common at site 37. Photographed.A. hoeveni Bleeker, 1854 12, 25, 33, 37 Rare, mainly seen in sheltered areas on barren sandybottoms around sea pens and soft corals. Photographed.1-25A. holotaenia Regan, 1905 46 Rare, about 10 scattered individuals seen at one site. 15-40A. kallopterus Bleeker, 1856 5, 16, 32, 38, 40, 45, 55, 56, 64, Occasional, but mainly nocturnal. 3-3565A. leptacanthus Bleeker, 1856 8, 12, 14, 26, 33, 45, 47 Occasional, but locally common among branching Porites 1-12coral.A. melanoproctus Fraser and Randall,USNM collection. 15-401976A. nanus Allen, Kuiter, and Randall, 8, 20, 25, 33, 37, 64 Rarely encountered, but locally abundant. Photographed. 5-201994A. new species 48 Rare, one aggregation of about 30 fish seen in 30 m.Several collected. Photographed.A. neotes Allen, Kuiter, and Randall, 6, 8, 9, 11, 12, 17, 19, 20, 26, 32, Occasional, but locally common, often adjacent to steep 10-25199440, 45, 64slopes around black coral. Photographed.A. nigrofasciatus Schultz, 1953 3, 6-8, 13, 15, 29-32, 34, 36, 38, Moderately common, one of most abundant cardinalfishes, 2-3539, 41, 43, 44, 51-57, 59-61, 63,65, 66but always in small numbers under ledges and amongcrevices.A. novemfasciatus Cuvier, 1828 35 Rare, only one seen in shallows. 0.5-3A. ocellicaudus Allen, Kuiter, and 11, 17, 21 Generally rare, a few small aggregations seen at three sites. 11-55Randall, 1994A. quadrifasciatus Cuvier, 1828 25, 49, 55 Rare, but mainly occurs on barren sandy slopes away from 5-40reef habitat. Photographed.A. rhodopterus Bleeker, 1852 16, 33 Rare, about 8 seen at two sites. Photographed. 10-40A. sealei Fowler, 1918 9, 12 Rare, two small aggregations seen at 2 sites. Photographed. 2-12A. selas Randall and Hayashi, 1990 4, 19, 64 Rare, three small aggregations seen. Photographed. 20-35A. taeniophorus Regan, 1908 1, 18 Rare, but occurs in very shallow water and is nocturnal and 0.5-2therefore difficult to accurately survey.A. thermalis Cuvier, 1829 33, 37 Rare, small aggregations seen at 2 sites. Photographed. 0-10A. trimaculatus Cuvier, 1828 6, 40, 47, 64 Rare, but difficult to survey due to nocturnal habitats. 2-10Apogonichthys perdix Bleeker, 1854USNM collection.Archamia biguttata Lachner, 1951 31, 54 Two aggregations seen in caves. Photographed. 5-18A. dispilus Lachner, 1951 44 Rare, about 30 seen among branching Acropora.A. fucata (Cantor, 1850) 1, 8, 9, 14, 16, 17, 21, 25, 26, 31, Moderately common, usually seen in caves. Photographed. 3-6033, 40, 43, 48, 54-56, 64A. zosterophora (Bleeker, 1858) 8, 12, 14, 20, 25, 26, 33, 35, 37, Moderately common, but locally abundant among2-1540, 45, 47branching Porites at several sheltered sites.Cercamia eremia (Allen, 1987) USNM collection. 5-40Cheilodipterus alleni Gon, 1993 6-8, 26, 40, 64 Rare, less than 10 seen. 1-25DEPTH(m)137
<strong>Solomon</strong> <strong>Islands</strong> <strong>Marine</strong> <strong>Assessment</strong> Technical ReportSPECIESSITE RECORDSABUNDANCE/BASIS OF RECORD IF NOT DEPTHCOLLECTED DURING REA(m)C. artus Smith, 1961 8, 11, 14-17, 19, 26, 28, 33, 38, Moderately common, usually among branching corals. 2-2044, 45, 47, 56C. macrodon Lacepède, 1801 1, 3, 11, 15, 18, 19, 21, 25, 29, Moderately common, but always in low numbers (except 4-3031, 38, 39, 41, 44, 46, 48, 51-56,58, 60, 61, 63, 64, 66juveniles).C. parazonatus Gon, 1993 14, 19, 20, 25, 26, 33, 37, 45, 47, Occasional on sheltered inshore reefs. Photographed. 1-3564C. quinquelineatus Cuvier, 1828 1, 4, 6-23, 25-33, 34-43, 45, 47- Common, most abundant member of genus in <strong>Solomon</strong>s. 1-4049, 51, 54-56, 62C. zonatus Smith and Radcliffe, 1912 USNM collection, but record probably invalid as normal 1-30range is Philippines-Sabah.Foa brachygramma (Jenkins, 1902) 6 Rare, but very cryptic and difficult to assess. 1-15Fowleria vaiulae (Jordan and Seale,USNM collection. 3-201906)Gymnapogon urospilotus Lachner, 1953 USNM collection. 1-15Neamia octospina Smith and Radcliffe,USNM collection. 2-201912Pseudamia amblyuroptera (Bleeker,Randall, Lachner and Fraser, 19851856)P. gelatinosa Smith, 1955 Randall, Lachner and Fraser, 1985 1-40P. zonata Randall, Lachner and Fraser,Randall, Lachner and Fraser, 1985 10-351985Pseudamiops gracilicauda (Lachner,USNM collection. 1-151953)Rhabdamia cypselurus Weber, 1909 26 One aggregation containing several hundred fish seen. 2-15R. gracilis (Bleeker, 1856) 43, 56 Rarely observed, but in high numbers swarming around 5-20coral bommies.Sphaeramia nematoptera (Bleeker, 1856) 4, 10, 12, 14, 33, 37, 40, 45, 47 Occasional, but locally common among branching Porites 1-8in sheltered locations. PhotographedS. orbicularis (Cuvier, 1828) 10, 39 Rarely seen, but no doubt abundant amongst mangroveroots. Photographed.0-3MALACANTHIDAEHoplolatilus cuniculus Randall and 22, 27, 44, 58 Rare, but restricted to deep rubble slopes. 25-115Dooley, 1974H. starcki Randall and Dooley, 1974 5, 7, 27, 29-32, 34, 36, 50-54, 58, Occasional on steep outer slopes. Photographed. 20-10561, 65Malacanthus brevirostris Guichenot, 22, 28, 38, 42, 43, 44, 48, 58, 59, Occasional in sandy areas. 10-45184865M. latovittatus (Lacepède, 1798) 22, 28, 31, 34, 44, 48, 50, 51, 58 Occasional. 5-30ECHENEIDAEEcheneis naucrates Linnaeus, 1758 22, 28, 36, 46, 52, 59 A few individuals seen attached to sharks. 0-30CARANGIDAEAlepes vari (Cuvier, 1833) 36, 59 Rare, except large aggregation at site 36. 2-50Carangoides bajad (Forsskål, 1775) 1, 4, 8, 17, 18, 21, 26-28, 32-36, Occasional, usually in low numbers. 5-3039-42, 52, 54C. ferdau (Forsskål, 1775) 20 Rare, only 1 seen. 2-40C. fulvoguttatus (Forsskål, 1775) 38 Rare, only 1 seen. 5-100C. oblongus (Cuvier, 1833) 47, 48 Rare, only 2 seen. 5-40C. orthogrammus (Jordan and Gilbert, 14, 27, 51 Rare only 3 seen. 3-1681882)C. plagiotaenia Bleeker, 1857 5, 6, 9, 10, 15-17, 20, 21, 36, 56, Occasional, usually in low numbers. 5-20061, 63Caranx ignobilis (Forsskål, 1775) 19, 59, 65 Rare, 3 large adults seen. 2-80C. melampygus Cuvier, 1833 3, 6, 8, 9, 10, 13-36, 38-44, 46- Moderately common, ususally seen solitary or in small 1-19054, 56-63schools. The most common reef carangid in <strong>Solomon</strong>s.C. papuensis Alleyne and Macleay, 1877 9, 10, 19, 20, 26, 27, 33, 47, 49, Occasional, solitary or in small groups. 1-50.55, 64C. sexfasciatus Quoy and Gaimard, 1825 4, 51 Rarely seen, but usually in large schools. 3-96Elegatis bipinnulatus (Quoy and36, 52, 53, 60, 61, 63, 65 Six schools encountered on steep outer slopes or in 5-150Gaimard, 1825)passages.. PhotographedGnathanodon speciosus (Forsskål, 1775) 4 Rare, only 1 seen. 1-30Scomberoides lysan (Forsskål, 1775) 36, 43 Rare, only 2 seen. 1-100Selar boops (Cuvier, 1833) 34 School seen by B. Kahn. 1-30S. tol (Cuvier, 1832) Herre, 1931S. crumenophthalmus (Bloch, 1793) 28, 64 Rare, 2 schools seen. 1-170Trachinotus blochii (Lacepède, 1801) 28, Rare, one adult seen. 3-40LUTJANIDAEAphareus furca (Lacepède, 1802) 1, 2, 8, 11, 13, 17, 22-24, 26-29, Moderately common. Seen on most outer reef dives. 6-7032, 35, 36, 38, 39, 41, 43-45, 48,50-54, 57-61Aprion virescens Valenciennes, 1830 3, 43, 51, 53, 57, 58 Rare, less than 10 seen. 3-40138
Coral Reef Fish DiversitySPECIESSITE RECORDSABUNDANCE/BASIS OF RECORD IF NOTCOLLECTED DURING REALutjanus argentimaculatus (Forsskål, 33, 35, 36, 56, 59, 60 Generally rare, but about 30 large individuals seen at site1775)56.L. biguttatus (Valenciennes, 1830) 3, 5, 9, 11, 18, 19, 24, 26, 32, 35, Moderately common on sheltered reefs. Especially38-40, 55, 59abundant at site 11. Photographed.L.bohar (Forsskål, 1775) 2, 3, 5, 7, 8-11, 13-18, 21, 23, 25- Common, one of the three most common snappers, but32, 34, 36, 38, 39, 41-45, 48-55, usually in relatively low numbers at each site.58-62, 65, 66L. boutton (Lacepède, 1802) 6, 9, 26, 38 Rarely seen and usually in low numbers. 5-25L. carponotatus (Richardson, 1842) 4, 9, 19, 20, 25, 26, 33, 37, 40, 64 Occasional. Usually on sheltered coastal reefs. 2-35L. ehrenburgi (Peters, 1869) Allen and Talbot, 1985 1-20L. fulviflamma (Forsskål, 1775) 24, 66 Rare, except several hunded seen at site 24. 1-35L. fulvus (Schneider, 1801) 6, 9, 11, 13, 16-18, 20, 21, 24,25, 28-33, 35, 36, 38-41, 43, 45,47, 48, 51, 52, 54-60, 63, 64-66Commom, but usually in small numbers. 2-40L. gibbus (Forsskål, 1775) 6-9, 11-19, 21, 24, 28, 32-36, 38-41, 43-63, 65, 66Common, one of three most common snappers. Anextraordinarily large school containing hundreds of fishseen at site 58. Photographed.DEPTH(m)1-100L. kasmira (Forsskål, 1775) 28, 34, 40, 44, 46, 48, 65 Occasional, usually in low numbers, except abundant in 30 3-265m at site 65.L. lutjanus Bloch, 1790 Allen and Talbot, 1985 10-90L. mizenkoi Allen and Talbot, 1985 26 Rare. 15-80L. monostigma (Cuvier, 1828) 8, 9, 11, 13, 16-18, 22, 23, 24, Common, between 10- 20 seen on some dives. 5-6026, 28, 29, 32-36, 38-45, 47, 48,50-54, 56-61, 63, 65, 66L. quinquelineatus (Bloch, 1790) 9, 18, 38 Occasional, usually in small aggregations. 5-30L. rivulatus (Cuvier, 1828) 6, 9,12, 13, 20, 23, 26, 29, 40, 42, Occasional. The largest snapper in the <strong>Solomon</strong>s. 2-10044, 47, 48, 50, 52, 56, 59, 60L. rufolineatus (Valenciennes, 1830) 65 Generally rare, but abundant in 30 m at site 65. 12-50L. russelli (Bleeker, 1849) 13, 17, 33, 54, 56, 58 Rare, less than 10 seen. Photographed. 1-80L. sebae (Cuvier, 1828) Allen and Talbot, 1985 10-100L. semicinctus Quoy and Gaimard, 1824 2, 3, 4, 7-55, 57-66 Common, one of the three most common snappers, but 10-40usually in relatively low numbers at each site.L. timorensis (Quoy and Gaimard, 1824) 48 Rare, one photographed with video camera by B. Kahn. 6-130L. vitta (Quoy and Gaimard, 1824) 8, 9, 11, 14, 20, 25, 33, 40, 64 Occasional on sandy bottoms at sheltered coastal sites. 8-40Photographed.Macolor macularis Fowler, 1931 1, 2, 3, 5, 7-11, 13, 15-18, 21-24, Common. Photographed. 3-5026-32, 34, 36, 38-54, 56-63, 65,66M. niger (Forsskål, 1775) 6, 10, 12-17, 21-24, 26, 29, 32, Common. 3-9036, 44, 47, 50-53, 55, 57-59, 63,65Paracaesio sordidus Abe and Shinohara, 52 One school photographed with video camera by B. Kahn. 5-1001962Symphorichthys spilurus (Günther, 1874) 11, 12 Rare, only 2 seen. Photographed 5-60Symphorus nematophorus (Bleeker, 8, 60 Rare, only 2 seen. 5-501860)CAESIONIDAECaesio caerulaurea Lacepède, 1802 1, 2, 3, 6, 8, 10-13, 16-18, 20-24, Abundant in variety of habitats. 1-3026-36, 38, 39, 41, 43-46, 48-54,56-61, 63-65C. cuning (Bloch, 1791) 1-4, 6-29, 33-40, 42, 43, 45-47, Abundant in variety of habitats, particularly coastal reefs. 1-3049, 54, 55, 57-60, 64Photographed.C. lunaris Cuvier, 1830 5, 8, 11, 16-18, 20, 22, 24, 26-28, Common on outer slopes and in passages. Photographed. 1-3532, 34, 36, 39, 41-44, 46, 48, 50-53, 59-61, 66C. teres Seale, 1906 1, 10, 34, 38, 39, 41, 43, 48, 49, Occasional, but locally common. Photographed. 1-4051-53, 56, 58, 62, 63, 65, 66Dipterygonotus balteatus (Valenciennes,Carpenter, 19871830)Gymnocaesio gymnoptera (Bleeker,Carpenter, 1987 5-301856)Pterocaesio digramma (Bleeker, 1865) 19, 55 Rarely seen, but locally common. 1-25P. lativittata Carpenter, 1987 39, 61 One school of about 100 fish seen in 50 m depth. 10-70 mP. marri Schultz, 1953 1, 2, 4, 11, 18, 22, 24, 26, 31, 32, Occasional. 1-3554, 56, 63P. pisang (Bleeker, 1853) 1, 5, 8, 9, 13, 15, 18, 19, 21-32, Common in variety of habitats. 1-3534, 36, 39, 41, 43, 44, 48, 49, 51,53-59, 61, 62, 65P. tessellata Carpenter, 1987 11, 23, 31, 38, 39, 52, 56, 58, 63 Occasional, but locally abundant. 1-35P. tile (Cuvier, 1830) 7, 9, 10, 18, 22, 23, 27, 28, 32, Common, especially on outer slopes. Photographed. 1-6034, 36, 38, 39, 41, 43, 44, 50-53,56, 58, 59, 63, 65, 66P. trilineata Carpenter, 1987 9, 11, 15-17, 18, 21, 23, 54, 56-58, 60, 61Moderately common, but locally abundant. Photographed. 1-303-404-1806-40139
<strong>Solomon</strong> <strong>Islands</strong> <strong>Marine</strong> <strong>Assessment</strong> Technical ReportSPECIESSITE RECORDSABUNDANCE/BASIS OF RECORD IF NOTCOLLECTED DURING REAGERREIDAEGerres oyena (Forsskål, 1775) 1 Rarely seen, but frequents sandy zone next to shore. 0-40HAEMULIDAEDiagramma pictum (Thünberg, 1792) 18, 20, 28 Rare, a few seen in silty areas. 2-40Plectorhinchus albovittatus (Rüppell, 16, 40, 50-52, 54, 61 Occasional. Formerly known as P. obscurus. 5-501838)P. celebicus Bleeker, 1873 28, 32, 51, 57 Rare. 6-30P. chaetodontoides (Lacepède, 1800) 8, 13, 14, 16-18, 20, 26, 27, 28, Moderately common, the most abundant sweetlinps in 1-4033, 34, 36, 38-40, 54, 57, 59, 61 <strong>Solomon</strong>s, but always seen in small numbers.P. gibbosus (Lacepède, 1802) 32, 40, 50, 56, 59, 65 Rare, only 5 adults seen. 2-30P. lessoni (Cuvier, 1830) 24, 54 Rare, only 2 seen. . 5-35P. lineatus (Linnaeus, 1758) 3, 9, 14, 24, 28, 31, 32, 40, 52, Occasional. 2-4056, 58-60, 65P. vittatus (Linnaeus, 1758) 2, 3, 16-18, 21, 24, 28, 34, 43, Occasional, but common (about 40 seen) in 30 m at site 3-3044, 46, 48, 51, 52, 58, 63, 65 65.LETHRINIDAEGnathodentex aurolineatus Lacepède, 1, 3, 5, 16, 18, 24, 32, 38, 39, 41, Occasional. Photographed. 1-30180246, 54, 64-66Gymnocranius grandoculus18, 56, 57 Rare, only 3 seen. 20-100(Valenciennes, 1830)Lethrinus atkinsoni Seale, 1909 11, 16, 46, 55 Rare, only a few juveniles seen on sheltered reefs. 2-30L. erythracanthus Valenciennes, 1830 1, 2, 15, 21, 24, 29, 32, 44, 45, Occasional. Photographed. 15-12050, 51, 61-63L. erythropterus Valenciennes, 1830 3, 4, 8, 11-18, 20-24, 26, 29-34, Common. 2-3036, 38-40, 42, 43, 45, 48, 50, 51,54, 59-63L. harak (Forsskål, 1775) 1, 2, 8, 11, 12, 16, 18, 20, 21, 35, Occasional in shallow waters with sand or rubble bottoms. 1-2049, 52, 57L. lentjan (Lacepède, 1802) 10, 18, 28, 60 Rare, except group of 10 in 30 m at site 18. 10-50L. obsoletus (Forsskål, 1775) 11, 16-18, 46, 56, 60, 63 Occasional, and always in low numbers. 1-25L. olivaceous Valenciennes, 1830 12, 15, 17, 23, 26, 31, 35, 40, 42, Occasional, in low numbers. 4-18565L. semicinctus Valenciennes, 1830 63 Rare, several seen in 40 m on sand-rubble bottom. 10-40L. variegatus Valenciennes, 1830 40 Rare, but seagrass is main habitat. 1-10L. xanthocheilus Klunzinger, 1870 16, 18, 20, 22, 28, 44, 50, 52, 58 Occasional, mainly on outer reefs. 2-25Monotaxis grandoculis (Forsskål, 1775) 1-66 Abundant. The most common lethrinid in <strong>Solomon</strong>s. 1-100NEMIPTERIDAEPentapodus aureofasciatus Russell, 1, 2, 5, 6, 8, 9, 15, 17, 18, 22, 23, Moderately common, mainly on sand-rubble slopes. 3-25200126, 27, 31, 44-46, 57, 62, 65, 66 Photographed.P. trivittatus (Bloch, 1791) 1, 4, 8-14, 18, 20, 25, 26, 28, 33, Mocerately common, usually on sheltered coastal reefs. 1-3535, 37, 40, 42, 45-47, 49, 55-57,60, 64Scolopsis affinis Peters, 1876 1, 16, 17, 28, 33, 46, 65, 66 Occasional, but locally common in sandy areas.3-60Photographed.S. bilineatus (Bloch, 1793) 1, 2, 5, 6, 8-15, 17, 18, 20-24, 26- Common. Photographed. 2-2032, 34-36, 38, 39, 42-46, 48-51,53-66S. ciliatus (Lacepède, 1802) 8, 9, 14, 16, 17, 18, 21, 25, 26, Moderately common at sites subjected to silting and also 1-3033, 37, 46, 49, 55, 57, 60, 64 on clean sand bottoms. Photographed.S. lineatus Quoy and Gaimard, 1824 1, 11, 16-18, 21, 38, 48, 57 Occasional on shallow reefs. Common at site 16. 0-10S. margaritifer (Cuvier, 1830) 1, 3, 4, 6, 8-23, 25, 26, 29, 32, Common, especially on sheltered coastal reefs 2-2033, 35, 37, 38, 40, 42, 43, 45-49,54-57, 59, 60, 62, 64S. temporalis (Cuvier, 1830) 11, 14, 18, 55 Rare, but mainly occurs in sand areas away from reef. 5-30S. trilineatus Kner, 1868 15, 16 Rare. 1-10S. xenochrous (Günther, 1872) 2, 3, 15, 22, 24, 27, 31, 56-58, Occasional, usually on outer slope or in passages below 25 5-5065, 66m on rubble bottoms. Photographed.MULLIDAEMulloidichthys flavolineatus (Lacepède, 1, 2, 6, 9, 11, 12, 14, 16-18, 20, Occasional, but sometimes locally common.1-401802)32, 43, 49, 56, 64Photographed.M. vanicolensis (Valenciennes, 1831) 1, 11, 38, 39, 46, 48, 49, 56, 57, Occasional, but sometimes locally common.1-11360, 65, 66Photographed.Parupeneus barberinus (Lacepède, 1801) 1-18, 20-66 Common, one of three most abundant goatfish in1-100<strong>Solomon</strong>s.P. bifasciatus (Lacepède, 1801) 1-3, 5-13, 15-18, 21-32, 34-36, Common, one of three most abundant goatfish in1-8038-54, 56-63, 65, 66<strong>Solomon</strong>s. Photographed.P. cyclostomus (Lacepède, 1802) 2, 3, 6, 8, 9, 11, 14, 16-18, 20-22, Moderately common. 2-9226-32, 34, 38, 39, 42-44, 46, 48-52, 54, 56-61, 63, 65P. heptacanthus (Lacepède, 1801) 8, 14, 16, 18, 20 Rare, but usually occurs on open sandy bottoms away from 1-60reef edge.P. indicus (Shaw, 1903) 6, 8, 55 Rare, only 3 seen, but probably common in seagrassmeadows.0-15DEPTH(m)140
Coral Reef Fish DiversitySPECIESSITE RECORDSABUNDANCE/BASIS OF RECORD IF NOT DEPTHCOLLECTED DURING REA(m)P. multifasciatus Bleeker, 1873 1-3, 5-36, 38-46, 48-66 Common, one of three most abundant goatfish in1-140<strong>Solomon</strong>s.P. pleurostigma (Bennett, 1830) 1, 18, 21, 28, 32, 46, 62, 66 Occasional on clean sand bottoms. 5-46Upeneus tragula Richardson, 1846 4, 14, 25, 40, 46, 56 Occasional, but mainly found on sand bottoms away from 1-40reefs.PEMPHERIDAEParapriacanthus ransonneti8, 54, 56 Rarely encountered, but forms dense aggregations. 5-30Steindachner, 1870Pempheris adusta Bleeker, 1877 3, 21, 29, 32 Rarely seen, but difficult to survey due to cryptic diurnal 5-30behaviour.P. oualensis Cuvier, 1831 3, 21, 31, 54, 59 Probably common, but difficult to survey due to cryptic 3-38diurnal behaviour.P. schwenkii Bleeker, 1855 21, 29 Rarely seen, but difficult to survey due to cryptic diurnalbehaviour.P. vanicolensis Cuvier, 1831 3, 6, 11, 17, 21, 24, 26, 29, 31, Common, but difficult to properly survey due cave habitat.32, 38, 48, 49, 54, 56, 59, 65, 66KYPHOSIDAEKyphosus bigibbus Lacepède, 1801 1, 32, 41, 51, 55 Rarely seen, but may be locally common. 1-30K. cinerascens (Forsskål, 1775) 17, 21, 28, 31, 32, 34, 36, 38, 39, Moderately common, but sometimes locally abundant. 1-2441, 44, 51, 52, 54, 56, 58, 59, 61K. vaigiensis (Quoy and Gaimard, 1825) 17, 18, 21, 36, 54, 59 Occasional, but sometimes locally common. 1-20CHAETODONTIDAEChaetodon auriga Forsskål, 1775 3, 12, 16, 23, 28, 29, 32, 35, 40, Occasional, ususally areas with weed and sand mixed with 1-3042, 44, 45, 57, 59, 62coral reef.C. baronessa Cuvier, 1831 1-3, 5-36, 38-40, 42-58, 61-66 Common, seen on nearly every dive. 2-15C. bennetti Cuvier, 1831 8, 10, 13, 14, 18, 19, 21-23, 27, Moderately common, frequently on outer slopes.5-3028, 32, 34-41, 50, 51, 57-59, 61,65Photographed.C. burgessi Allen & Starck, 1973 39, 41 Rare, only 3 seen below 40 m depth on vertical outer 20-100slopes. Photographed.C. citrinellus Cuvier, 1831 1, 2, 3, 5, 6, 11, 14-16, 21, 22,24, 27-32, 34, 36, 44, 46, 48-50,52, 53, 59-61, 63, 65, 66Common, mainly on shallow reefs affected by surge. 1-12C. ephippium Cuvier, 1831 3, 6-8, 10, 12-18, 21, 22, 24-32,34-36, 38-43, 45-55, 58-61, 63,66C. kleinii Bloch, 1790 1-3, 5-11, 13, 15, 18, 21-24, 27,31, 32, 34, 36, 38, 39, 41-46, 50-66Moderately common, never more than 2-3 pairs seen at asingle site.1-30Common, especially on outer slopes. 6-60C. lineolatus Cuvier, 1831 14, 27, 33, 36, 40, 51, 55 Occasional, less common than the very similar C.2-170oxycephalus. Photographed.C. lunula Lacepède, 1803 5, 7, 16, 18, 36, 40, 43, 44, 48, Occasional. 1-4051, 52, 56, 61C. lunulatus Quoy and Gaimard, 1824 1-66 Common, one of the most abundant butterflyfishes in 1-25<strong>Solomon</strong>s; seen on almost every dive.C. melannotus Schneider, 1801 7, 11, 18, 52, 63, 65 Rare, less than 10 seen. 2-15C. mertensii Cuvier, 1831 46, 49 Rare, only 2 seen. 10-120C. meyeri Schneider, 1801 2, 6, 7, 11, 13, 21, 22, 24, 25, 34, Occasional. 5-2535, 41, 43, 50, 52C. ocellicaudus Cuvier, 1831 10, 13, 15, 23, 29, 32, 35, 36, 38, Moderately common on sheltered inshore reefs. 1-1554, 56, 57, 63C. octofasciatus Bloch, 1787 4, 9-11, 17, 19, 20, 26, 33, 40, Occasional, except common at a few inshore influenced by 3-2047, 64silt. Photographed.C. ornatissimus Cuvier, 1831 2, 5-7, 9-11, 13, 15-29, 32, 34- Common, several seen on most dives, especially in rich 1-3636, 38-61, 63-66coral areas.C. oxycephalus Bleeker, 1853 2, 10, 12, 13, 16-19, 22, 23, 26, Occasional. C. oxycephalus x C. auriga hybrid (in8-3028, 29, 32, 33, 35, 52, 60, 61, 66 company of pair of C. auriga) seen at site 32.C. pelewensis Kner, 1868 5, 7, 10, 22, 29-32, 38, 39, 43, Occasional on outer slopes and in passages. Photographed. 6-4548, 50-54, 56, 58, 61, 65, 66C. punctatofasciatus Cuvier, 1831 7, 36, 38, 50, 56 Rare. Many suspected hybrids with C. pelewensis6-45observed..C. rafflesi Bennett, 1830 1-62, 64-66 Common, one of the most abundant butterflyfishes in 1-15<strong>Solomon</strong>s; at least 1-2 pairs seen on every dive.C. reticulatus Cuvier, 1831 44, 50, 52 Rare, about 6 seen. 1-35C. semeion Bleeker, 1855 2-19, 21, 22, 24, 27-29, 35, 36, Moderately common. 1-2538-41, 44, 45, 48, 50-54, 57, 60,61, 64, 65C. speculum Cuvier, 1831 7, 18, 29 Rare, only 3 seen. 1-30C. trifascialis Quoy and Gaimard, 1824 2, 6, 7, 20, 23-25, 28, 29, 32, 34, Occasional in areas of tabular Acropora. 2-3036, 38, 44, 48, 49, 53, 59C. ulietensis Cuvier, 1831 7, 10, 13, 14, 18-22, 28, 29, 32-36, 38, 39, 41-45, 47, 50-52, 54,55, 59-61, 65Moderately common. Photographed. 8-30141
<strong>Solomon</strong> <strong>Islands</strong> <strong>Marine</strong> <strong>Assessment</strong> Technical ReportSPECIESSITE RECORDSABUNDANCE/BASIS OF RECORD IF NOT DEPTHCOLLECTED DURING REA(m)C. unimaculatus Bloch, 1787 5, 6, 11, 22, 28, 29, 34, 35, 38, Occasional, mainly on outer slopes. 1-6039, 44, 46, 48, 50, 51, 53, 65C. vagabundus Linnaeus, 1758 1-66 Common, the most abundant butterflyfish in <strong>Solomon</strong>s; 1-30several seen on every dive.Chelmon rostratus (Linnaeus, 1758) 33, 37 Rare, only 2 pairs seen. Photographed. 1-15Coradion chrysozonus Cuvier, 1831 1, 15, 17, 18, 21, 23, 29, 41, 42, Occasional, mainly on sheltered reefs. 5-6045, 54, 59, 63Forcipiger flavissimus Jordan and 1, 2, 3, 7, 8, 11, 13, 15, 22-25, Common, especially on outer reef slopes. 2-114McGregor, 189827, 29-32, 34, 36, 38, 39, 41-46,48-54, 56-61, 63, 65, 66F. longirostris (Broussonet, 1782) 5, 8, 11, 15, 16, 22, 25, 38, 41, Occasional, mainly on outer reef slopes. Photographed. 5-6044, 51Hemitaurichthys polylepis (Bleeker, 32, 34, 39, 41, 44, 50-52, 54, 60, Occasional, but locally common on steep outer slopes. 3-601857)61, 65Heniochus acuminatus (Linnaeus, 1758) 4, 19, 22, 28, 33, 36, 37, 39, 48,55, 56, 65Occasional. Photographed. 2-75H. chrysostomus Cuvier, 1831 1- 8, 10, 11, 13, 14, 17-19, 21,23-25, 27-36, 38, 39, 42-45, 47,49-66Common, one of most abundant butterflyfishes in<strong>Solomon</strong>s.H. diphreutes Jordan, 1903 51, 54 Rare, but large aggregation at site 51. 15-210H. monoceros Cuvier, 1831 28, 29, 39, 45 Rare. Photographed. 2-25H. singularius Smith and Radcliffe, 1911 1, 2, 3, 5, 7, 10, 12, 13, 19, 21, Moderately common. 12-4523, 24, 27, 31, 36, 37, 45, 50-55,58-61, 64-66H. varius (Cuvier, 1829) 1-66 Common, the most abundant butterflyfish in <strong>Solomon</strong>s. 2-30POMACANTHIDAEApolemichthys trimaculatus (Lacepède, 2, 11, 18, 22, 27, 31, 39, 42-44, Occasional on outer reefs. Most common at site 63. 10-501831)53, 54, 58, 59, 63, 65, 66A. griffisi (Carlson and Taylor, 1981) Allen, Steene and Allen, 1998 10-40Centropyge bicolor (Bloch, 1798) 1-3, 5-13, 15-18, 21-24, 27-32, Common. 3-3534, 38-40, 42-46, 48-66C. bispinosus (Günther, 1860) 1, 2, 11, 13, 15, 22, 27, 29, 32, Common on seaward slopes, but rare inshore.10-4534, 39, 42-44, 46, 48, 50-54, 58,59Photographed.C. flavicauda Fraser-Brunner, 1933 2, 22, 34, 43, 52, 53 Generally rare, but sometimes locally common on rubble 10-60bottoms. Photographed.C. loricula (Günther, 1874) 51 Rare, only 2 seen. Photographed. 5-60C. nox (Bleeker, 1853) 1, 6-11, 13-21, 23-26, 29-32, 34,40, 41, 43, 45, 51-53, 55-57, 59,60Common, except in clear water of outer reefs.Photographed.C. vroliki (Bleeker, 1853) 1-3, 5-13, 15-32, 34-46, 48-66 Common, one of the two most abundant angelfishes in 3-25<strong>Solomon</strong>s.Chaetodontoplus mesoleucus (Bloch, 1, 4, 6, 8-14, 16, 19, 20, 23, 25, Moderately common, but mainly restricted to sheltered 1-201787) grey tailed form26, 33, 37, 40, 45, 47, 55, 64 inshore reefs. Photographed.Genicanthus lamarck Lacepède, 1798 2, 22, 23, 27, 53, 58, 63 Occasional, mainly on steep slopes below 20 m. 15-40G. melanospilos (Bleeker, 1857) 5, 7, 32, 34, 39, 44, 50, 51, 53, Occasional, but locally common on outer reef slopes and 20-5061, 63, 65in passages.Paracentropyge multifasciatus (Smith 13, 21, 26, 32, 36, 50, 51, 56, 57, Occasional, but seldom noticed due to cave-dwelling 10-50and Radcliffe, 1911)60, 61habits. Photographed.Pomacanthus annularis (Bloch, 1787) Allen et al. 1-60Pomacanthus imperator (Bloch, 1787) 6, 17, 22, 34, 41, 48, 50, 51, 53, Occasional and in low numbers. 3-7057, 59, 65, 66P. navarchus Cuvier, 1831 1, 3, 7, 8, 10, 13-15, 22-24, 28, Moderately common, but always in low numbers.3-3031, 32, 34, 36, 38, 40-44, 47, 50-54, 56, 57, 60, 61Photographed.P. semicirculatus Cuvier, 1831 7, 17, 21, 28, 41, 56 Rare, only 6 seen. 5-40P. sexstriatus Cuvier, 1831 4, 6, 7, 9, 10, 14, 16, 17, 20, 21, Occasional. 3-5023, 25, 33, 37, 39, 41, 54, 63, 64P. xanthometopon (Bleeker, 1853) 2, 7, 18, 21, 22-24, 27, 32, 33, Occasional, mainly on outer reef slopes. 5-3034, 35, 36, 41, 43Pygoplites diacanthus (Boddaert, 1772) 1-3, 5-32, 34-66 Common, the most abundant angelfish in <strong>Solomon</strong>s. 3-50Photographed.POMACENTRIDAEAbudefduf lorenzi Hensley and Allen, 13, 21, 39, 55 Rarely seen, but locally common in shallow water next to 0-61977shore. Photographed.A. septemfasciatus (Cuvier, 1830) 1, 21, 29, 39, 41 Occasional, but surge zone environment not regularly 1-3surveyed.A. sexfasciatus Lacepède, 1802 1, 32, 48, 56, 60, 64 Occasional, but sometimes locally common. Abundant at 1-15sites 60 and 64.A. sordidus (Forsskäl, 1775) 41 Rare, but surge zone environment not regularly surveyed. 1-3Photographed.A. vaigiensis (Quoy and Gaimard, 1825) 1, 13, 16-18, 21, 22, 25, 28, 29,32, 34, 36, 38, 39, 41, 44, 46, 48-50, 52, 53, 56, 59, 61Generally common. 1-125-4010-70142
Coral Reef Fish DiversitySPECIESSITE RECORDSABUNDANCE/BASIS OF RECORD IF NOT DEPTHCOLLECTED DURING REA(m)Acanthochromis polyacantha (Bleeker, 1-13, 15-24, 26-32, 34-36, 38-47, Abundant in wide range of habitats. Some populations 1-501855)50-54, 56-66with white tails. Photographed.Amblyglyphidodon aureus (Cuvier, 1830) 6, 7, 10, 11, 13, 15, 21, 24, 26- Common on outer slopes. 10-3532, 34, 36, 39, 41, 43, 44, 48, 50-54, 56, 59-61, 63, 65, 66A. batunai Allen, 1995 1, 32 Rare.A. curacao (Bloch, 1787) 2, 3, 5-7, 11, 15, 18, 21-24, 27, Common. 1-1528, 31, 32, 34-36, 38-40, 42, 43,45-47, 49, 54-57, 60, 62-64A. leucogaster (Bleeker, 1847) 1-3, 5-13, 15, 17-19, 23, 24, 26-32, 34, 36, 38-45, 48-54, 56-63,65Common. 2-45Amblypomacentrus breviceps (SchlegelAllen,1975 2-35and Müller, 1839-44)Amphiprion chrysopterus Cuvier, 1830 1, 3, 17, 22, 24, 27-29, 32, 38, Common. One of the two most abundant anemonefishes in 1-2042-44, 50-53, 57-61, 63<strong>Solomon</strong>s. Photographed.A. clarkii (Bennett, 1830) 1, 2, 5, 9, 10, 11, 13, 15-18, 20- Common. One of the two most abundant anemonefishes in 1-5523, 25, 27-29, 32, 34, 38, 39, 43,44, 48, 50, 51, 54-61, 63, 65, 66<strong>Solomon</strong>s.A. leucokranos Allen, 1973 7, 11, 28, 32, 43, 57, 60, 66 Rare, less than 10 seen. This “species” actually a hybrid 2-12between A. chrysopterus & A. sandaracinos.Photographed.A. melanopus Bleeker, 1852 1, 9, 16-18, 21, 22, 26, 31, 32, Occasional. Photographed. 1-1043, 51, 53, 57, 63A. percula (Lacepède, 1802) 2, 3, 7, 9, 20, 25, 26, 33, 39, 48, Occasional. Photographed. 1-1551, 60, 63, 66A. perideraion Bleeker, 1855 1, 15, 38, 39, 46, 50, 53, 54, 56, Occasional. Photographed. 3-2057, 60, 61, 63, 66A. polymnus (Linnaeus, 1758) Photographed by D. Wachenfeld on sand bottom near site 2-3053.A. sandaracinos Allen, 1972 9, 11, 17, 21, 28, 43, 55, 57, 66 Occasional. Photographed. 3-20Cheiloprion labiatus (Day, 1877) 10, 35, 49, 56, 62 Rarely observed, but relatively inconspicuous. 1-3Chromis alpha Randall, 1988 2, 5, 7, 8, 10, 11, 13, 15, 22, 24, Common on steep slopes of outer reefs and passages. 18-9527, 29-32, 34, 36, 38, 39, 41, 43,44, 48, 50-54, 56-63, 65, 66C. amboinensis (Bleeker, 1873) 3, 5-11, 13, 15-23, 26-31, 34-36, Abundant. 5-6538, 39, 41, 43-45, 50-63, 65, 66C. analis (Cuvier, 1830) 27, 32, 34, 36, 39, 41, 51, 53, 61, Occasional on steep slopes, but locally abundant. 10-7065C. atripectoralis Welander and Schultz, 1, 10-12, 13, 17, 22, 23, 32, 38, Common on upper edge of outer slopes and in passages. 2-15195139, 44, 48, 50-53, 63Photographed.C. atripes Fowler and Bean, 1928 1-3, 6-11, 13, 15, 18, 21-24, 27- Common, particularly on slopes. 10-3532, 34, 36, 38, 39, 41-44, 49-63,65, 66C. caudalis Randall, 1988 51 Rare, a few seen in 20 m depth. Photographed. 20-50C. delta Randall, 1988 5, 7, 8, 11, 13, 15-18, 21, 22, 24,26-32, 34, 36, 38, 39, 42-44, 50-61, 63, 65, 66C. elerae Fowler and Bean, 1928 1, 6, 13, 17, 18, 21, 25, 26, 29,32, 34, 36, 39, 41, 44, 54, 56, 60,61Common, especially on steep slopes below about 15 mdepth.Moderately common, always in caves and crevices onsteep slopes.C. iomelas Jordan and Seale, 1906 50, 51, 61 Rare, only 4 seen. Photographed.C. lepidolepis Bleeker, 1877 1, 2, 3, 6, 8-13, 15, 17, 18, 22-24, Common. 2-2027-32, 34, 36, 38, 39, 41-45, 49-58, 61-63, 65, 66C. lineata Fowler and Bean, 1928 2, 7, 11, 21, 24, 27, 29-32, 34, Moderately common and locally abundant, usually in clear 2-1036, 38, 39, 41, 42, 44, 50, 51, 58-60water with some wave action.C. margaritifer Fowler, 1946 1-3, 5, 7, 13, 15, 18, 21, 22, 24, Common, mainly in clear water areas. 2-2025, 27-32, 34, 38, 39, 41-45, 48-54, 56-61, 63, 65C. retrofasciata Weber, 1913 1, 2, 5-23, 25, 26, 28-32, 34-36, Common at most sites. Photographed. 5-6538, 39, 42-46, 48-55, 57-63, 65,66C. ternatensis (Bleeker, 1856) 1-40, 42-45, 47-54, 56-60, 62,63, 65, 66Abundant, often forming dense shoals on the edge of steepslopes. Photographed.2-15C. viridis (Cuvier, 1830) 1, 6, 8-13, 15-17, 20, 21, 25, 26,28, 29, 32, 33, 35-38, 42, 43, 45,49, 55, 56, 64C. weberi Fowler and Bean, 1928 2, 5, 8, 22, 23, 27, 28, 32, 34, 36,38, 39, 42-44, 46, 50-54, 56-63,65, 66Common in shelterd areas of rich coral, generally in clearwater.10-8012-701-12Common. 3-25143
<strong>Solomon</strong> <strong>Islands</strong> <strong>Marine</strong> <strong>Assessment</strong> Technical ReportSPECIESSITE RECORDSC. xanthochira (Bleeker, 1851) 2, 5, 15, 22, 23, 27, 29-32, 34,39, 42-44, 50-54, 57-59, 61, 63,65C. xanthura (Bleeker, 1854) 2, 3, 5-11, 13, 15, 21-24, 26-32,34, 36, 38, 39, 41-44, 46, 48, 50-54, 56-63, 65, 66Chrysiptera biocellata (Quoy andGaimard, 1824)C. brownriggii (Bennett, 1828) 1, 2, 5-7, 21, 24, 27-31, 36, 39,41, 46, 48, 49, 51, 52, 61, 63, 65,66ABUNDANCE/BASIS OF RECORD IF NOT DEPTHCOLLECTED DURING REA(m)Moderately common on outer slopes. 10-48Common, especially on steep slopes. 3-4033, 52 Rare, but habitat (sheltered, shallow water next to shore)infrequently surveyed.Common on wave-swept reef tops.C. caruleolineata (Allen, 1973) Allen, 1975 30-65C. cyanea (Quoy and Gaimard, 1824) 1, 9-11, 13, 16-20, 25, 26, 28, 29, Moderately common on reef top near shore in sheltered 0-1032, 34-36, 38, 42, 52, 54, 57, 60 areas.C. cymatilis Allen, 1999 4, 8-10, 12, 14, 19, 20, 26, 33,35, 37, 40, 45, 47, 55, 64Common on sheltered inshore reefs to 17 m depth.Photographed.C. flavipinnis (Allen and Robertson, 22, 24, 44 Rare, only a few seen.1974)C. glauca (Cuvier, 1830) Allen, 1975C. oxycephala (Bleeker, 1877) 4, 8-10, 12, 14, 19, 20, 26, 33,35, 37, 40, 45, 47, 55Moderately common on sheltered inshore reefs.Photographed.C. rex (Snyder, 1909) 3, 5-7, 11, 18, 21, 24, 27, 31, 34, Moderately common, except abundant on outer reef at site 1-641, 46, 48, 49, 51-54, 57-60, 65 24.C. rollandi (Whitley, 1961) 1, 4, 6, 8-21, 23, 25, 26, 32, 33- Moderately common, particularly on reef slopes affected 2-3535, 37, 38, 40, 42, 43, 45, 52-60,63, 64, 66by silt.C. talboti (Allen, 1975) 1-3, 5-7, 10, 11, 13, 15, 16, 18, Common, except in silty areas. Photographed. 6-3521-25, 27-32, 34, 36, 38, 39, 41-44, 46, 48-54, 56-66C. unimaculata (Cuvier, 1830) 1, 11, 13, 18-21, 28, 35 Occasional, but locally common. Photographed. 0-2Dascyllus aruanus (Linnaeus, 1758) 8, 12, 25, 26, 35, 38, 45, 47, 52,55, 56, 62Moderately common, forming aggregations around smallcoral heads in sheltered lagoonal habitat. Photographed.1-12D. melanurus Bleeker, 1854 4, 8-10, 12, 14, 16, 20, 26, 28,32, 33, 34, 35, 38, 40, 45, 47, 52,55-57, 64D. reticulatus (Richardson, 1846) 1-3, 5-13, 15-18, 20-32, 34, 36,38, 39, 42-44, 48-54, 56-63, 65,66D. trimaculatus (Rüppell, 1928) 1-3, 5-7, 10, 11, 13, 15-18, 20-23, 26-32, 34, 36, 38, 39, 43-46,48-66Dischistodus chrysopoecilus (Schlegeland Müller, 1839)D. melanotus (Bleeker, 1858) 1, 8-12, 16-20, 22, 23, 25, 26, 28,32, 35, 38, 42, 43, 45, 47, 54, 56,57, 60D. perspicillatus (Cuvier, 1830) 1, 4, 9, 10, 12, 14, 20, 33, 35, 37,40, 45, 64D. prosopotaenia (Bleeker, 1852) 4, 9, 12, 14, 16, 20, 40, 45, 47,49, 55, 64D. pseudochrysopoecilus Allen andRobertson, 1974Hemiglyphidodon plagiometopon 4, 8-11, 14, 17, 19, 20, 25, 26,(Bleeker, 1852)33, 35, 40, 47, 49, 55, 64Lepidozygus tapeinosoma (Bleeker,1856)Neoglyphidodon melas (Cuvier, 1830) 1, 2, 6, 9-14, 17, 18, 20, 22, 23,25-29, 35, 37, 43, 44, 47-51, 60,63N. nigroris (Cuvier, 1830) 1, 3, 6, 9-14, 16-18, 20-23, 25-32, 34, 35, 38, 39, 42-49, 52, 54,56, 57, 59, 60, 62, 66N. thoracotaeniatus (Fowler and Bean,1928)Neopomacentrus azysron (Bleeker, 1877) 6, 17, 18, 21, 29, 39, 46, 49, 54,65Common, forming aggregations around small coral headsin sheltered lagoonal habitat.0-51-25Common. Photographed. 1-50Common in wide range of habitats. Photographed. 1-5510, 12, 26, 33, 35 Generally rare, but locally common in sand-rubble areas 1-5near shallow seagrass beds.Moderately common. 1-10Occasional in shallow sandy parts of sheltered reefs. 1-10Occasional. Photographed. 1-171, 15, 28, 56, 62 Generally rare, but common at 15 on reef top.Photographed.1-5Moderately common, generally on sheltered reefs affected 1-20by silt.32, 43, 50, 51, 52 Generally rare, except abundant at oceanic, clear water 5-25sites (50-51). Photographed.Moderately common, but in low numbers at each site. 1-12Common. 2-2316, 26, 38, 43, 50 Generally rare, but moderately common at few sites. 15-45Occasional, but locally common at some sites.1-12Photographed.N. cyanomos (Bleeker, 1856) 1, 26 Rare. 5-18N. filamentosus (Macleay, 1833) 4, 20, 25, 33, 37, 40, 55, 64 Occasional, but locally common. Abundant at site 37. 5-15N. nemurus (Bleeker, 1857) 4, 8, 14, 20, 25, 33, 35, 37, 55, 64 Occasional, but locally common on sheltered inshore reefs. 1-10Photographed.N. taeniurus (Bleeker, 1856) Reported from <strong>Solomon</strong>s by Allen, 1975, but mainlyfreshwater/estuarine.N. violascens (Bleeker, 1848) 49, 55 Generally rare, but moderately common at 2 turbid inshoresites. Photographed.5-25144
Coral Reef Fish DiversitySPECIESPlectroglyphidodon dickii (Liénard,1839)SITE RECORDS2, 3, 7, 16-18, 21, 22, 24, 27-32,34, 36, 39, 41, 43, 44, 46, 48-54,56-59, 61, 63, 65ABUNDANCE/BASIS OF RECORD IF NOT DEPTHCOLLECTED DURING REA(m)Moderately common. 1-12P. lacrymatus (Quoy and Gaimard, 1824) 1-3, 5-11, 13, 15-24, 27-32, 34, Abundant at most sites. 2-1236, 38, 39, 41-46, 48-54, 56-66P. leucozonus (Bleeker, 1859) 2, 6, 7, 21, 24, 27, 29, 31, 36, 39, Occasional, in shallow, wave-swept zone of outer reefs. 0-241, 61, 65Pomacentrus adelus Allen, 1991 1, 6, 8-23, 25, 26, 28, 29 32, 34, Common. 0-535, 38, 39, 42, 43, 45, 46, 48, 49,51, 54-57, 59, 60P. albimaculus Allen, 1975 4, 9, 12, 14, 20, 33, 37, 55, 64 Occasional on highly sheltered, silty inshore reefs.10-29Photographed.P. amboinensis Bleeker, 1868 1-3, 5-32, 34-37, 38, 39, 42-49, Abundant. 2-4051-66P. aurifrons Allen, 2004 4, 9, 10, 12, 14, 17, 19, 20, 33, Common on sheltered reefs.37, 40, 45, 47, 55, 64P. bankanensis Bleeker, 1853 1-3, 5-8, 11, 13, 15-18, 21-24, Common. 0-1226-32, 35, 36, 38, 39, 41, 43, 44,46, 48-53, 56-63, 65, 66P. brachialis Cuvier, 1830 1-3, 5, 7-11, 13, 15, 18, 19, 21- Abundant, especially in areas exposed to curents.6-4024, 27-32, 34, 36, 38, 39, 41-44,46, 48, 49, 51-63, 65, 66Photographed.P. burroughi Fowler, 1918 4, 8-14, 16, 17, 19, 20, 25, 26, Moderately common, usually on silty inshore reefs. 2-1633, 35, 37, 38, 40, 42, 43, 45, 47,55, 62, 64P. chrysurus Cuvier, 1830 1 Rare. 0-3P. coelestis Jordan and Starks, 1901 1-3, 5, 7, 8, 10, 11, 15, 21, 22, Common on exposed outer reefs. Photographed. 1-1224, 29-32, 34, 36, 38, 39, 43, 44,48, 50-54, 56, 58, 59, 61, 63, 65,66P. grammorhynchus Fowler, 1918 1, 9, 12, 14-17, 19, 25, 26, 38, Occasional, but locally common among live and dead 2-1243, 45, 62corals (often staghorn Acropora).P. lepidogenys Fowler and Bean, 1928 2, 3, 5-7, 11, 15, 18, 21-24, 27, Common. 1-1228, 31, 32, 34-36, 38, 39, 42-44,46, 48-54, 56-61, 63, 65, 66P. moluccensis Bleeker, 1853 1, 2, 4, 6-32, 34-36, 38, 39, 42, Abundant. 1-1445, 48-57, 59-63, 65, 66P. nagasakiensis Tanaka, 1917 1, 8, 10, 15-18, 22, 24, 28, 32, Moderately common, around isolated rocky outcrops 5-3042-44, 46, 48, 54, 56-58, 63, 65 surrounded by sand.P. nigromanus Weber, 1913 1, 4, 6, 8-21, 23, 25, 26, 38, 40, Common, usually on slopes in a variety of habitats. 6-6042, 43, 45, 49, 52-57, 60, 62, 64,66P. nigromarginatus Allen, 1973 1, 5, 7, 8, 10, 11, 13, 15, 16, 17, Common on steep slopes. 20-5021-23, 26, 27, 29-32, 34, 36, 38,39, 41-44, 45, 50-54, 56, 58-61,63, 65, 66P. pavo (Bloch, 1878) 4, 12, 14, 17, 19, 20, 25, 26, 33, Moderately common, always around coral patches in 1-1635, 37, 40, 52, 55, 60sandy lagoons. Photographed.P. philippinus Evermann and Seale, 1907 1, 3, 5-7, 11, 13, 17, 21-24, 29- Common, except on sheltered inshore reefs. Photographed 1-2732, 35, 36, 38, 39, 41, 44-46, 48,53, 54, 56-61P. reidi Fowler and Bean, 1928 1-3, 5-8, 10, 11, 13, 15, 16, 18, Common, usually on seaward slopes or in passages. 12-7021, 23, 24, 26-32, 34, 36, 38, 39,41-46, 48-54, 56-63, 65, 66P. simsiang Bleeker, 1856 4, 8, 10, 12, 14, 19, 20, 25, 26, Moderately common, usually in shallow, silt-affected 0-1033, 35, 37, 40, 45, 47, 55, 64 areas. Photographed.P. tripunctatus Cuvier, 1830 55, 64 Rarely seen, but main habitat consists of very shallow 0-3water next to shore.P. vaiuli Jordan and Seale, 1906 2, 5, 15, 29, 44, 48, 50-54, 56-59, Moderately common on outer slopes. Photographed. 3-4561-63, 65, 66Pomachromis richardsoni (Snyder, 1909) 24 Rare, a solitary fish seen in 3 m.Premnas biaculeatus (Bloch, 1790) 12, 20, 25, 26, 33, 40, 45, 62, 64 Occasional. Photographed 1-6Stegastes albifasciatus (Schlegel and 11, 15, 16, 18, 21, 28, 29, 32, 51, Occasional, but sometimes locally common. 0-2Müller, 1839)52, 54, 57S. fasciolatus (Ogilby, 1889) 2, 3, 6, 7, 16, 18, 21, 22, 24, 27, Moderately common in wave-swept zone of outer reefs. 0-529, 31, 36, 39, 41, 46, 48, 52, 54,61, 65S. lividus (Bloch and Schneider, 1801) 10, 19, 26, 33, 35, 45, 56 Occasional, but locally common. 1-5S. nigricans (Lacepède, 1802) 1, 4, 9, 15, 16, 25, 26, 28, 32, 35, Occasional, but locally common. 1-1238, 42, 45, 49, 52, 56, 62LABRIDAEAnampses caeruleopunctatus Rüppell, 3, 5, 24, 46, 48 Rare, only 5 seen. 2-301828A. melanurus Bleeker, 1857 5, 57 Rare, only 2 seen. 12-40145
<strong>Solomon</strong> <strong>Islands</strong> <strong>Marine</strong> <strong>Assessment</strong> Technical ReportSPECIESSITE RECORDSABUNDANCE/BASIS OF RECORD IF NOT DEPTHCOLLECTED DURING REA(m)A. meleagrides Valenciennes, 1840 3, 5, 22, 24, 27, 32, 36, 39, 41, Occasional, always in small numbers. 4-6050, 51, 53, 54, 63, 65A. neoguinaicus Bleeker, 1878 7, 18, 27, 54 Rare, less than 10 seen 8-30A. twistii Bleeker, 1856 22, 36, 39, 50, 51, 54, 56, 61 Rare, about 10 seen. 2-30Bodianus anthioides (Bennett, 1831 31, 57 Rare, only 2 seen. 6-60B.bimaculatus Allen, 1973 6, 11, 18, 34, 36, 39, 41, 44, 49, Occasional, usually below 30 m. 30-6051, 58B. diana (Lacepède, 1802) 1, 15, 18, 21, 26, 27, 29, 32, 34, Moderately common. 6-2536, 38, 39, 41-44, 51-54, 56-63,65B. loxozonus (Snyder, 1908) 50 Rare, only 1 seen. 3-40B. mesothorax (Bloch and Schneider, 1-3, 5-13, 15-32, 34-46, 48-54, Common. 5-301801)56-66Cheilinus chlorurus (Bloch, 1791) 14, 15, 57 Rare, only 3 seen. 2-30C. fasciatus (Bloch, 1791) 2-4, 7-13, 15-64, 66 Common, several adults seen on most dives. 4-40C. oxycephalus (Bleeker, 1853) 1-3, 5-7, 9, 11, 15-17, 21, 22, 24, Moderately common. 1-2027, 29, 32, 36, 38, 39, 42-44, 46,48, 50-52, 54, 56, 57, 59, 62, 63,65C. trilobatus Lacepède, 1801 1-3, 5-13, 15-18, 21-23, 27, 28, Common, several adults seen on most dives. 1-2032-36, 39, 44, 46, 48, 49, 51-57,60, 62, 63, 65C. undulatus Rüppell, 1835 8-10, 12, 14-18, 23, 24, 29, 32, Moderately common, but always in small numbers. 2-6034-36, 39-43, 46, 52, 54, 58-61,65, 66Cheilio inermis (Forsskål, 1775) 11, 16, 56 Rare, but mostly in weed habitats. 0-3Choerodon anchorago (Bloch, 1791) 1, 4, 6, 8-14, 19, 20, 25, 26, 28, Moderately common, usually in slity areas. 1-2533, 37, 40, 42, 45, 47-49, 55, 56,60, 64C. jordani (Snyder, 1908) 1, 15-17, 24 Rare, only seen in NE <strong>Solomon</strong>s. 10-20Cirrhilabrus condei Allen and Randall, 3, 22, 27, 43, 51, 52, 66 Occasional, usually below 20-30 m. 25-451996C. exquisitus Smith, 1957 2, 22, 27, 29, 38, 44, 50, 51, 53,63, 66Occasional. 6-32C. punctatus Randall and Kuiter, 1989 1-3, 8-11, 15, 17, 18, 22-24, 26-28, 32, 34, 36, 38, 42-44, 46, 50-55, 57-63, 66Abundant, one of most common labrids in <strong>Solomon</strong>s.Photographed.Coris aygula (Lacepède, 1801) Günther, 1873C. batuensis (Bleeker, 1862) 1, 8-13, 15-18, 22, 23, 28, 43, 45, Occasional over sand bottoms. 3-2546, 60, 62, 63, 65C. gaimardi (Quoy and Gaimard, 1824) 2, 5, 15, 18, 22-24, 27, 29, 32, Occasional. 1-5044, 46, 48, 50-54, 58, 59, 61, 63,65, 66Diproctacanthus xanthurus (Bleeker, 1, 4, 6, 8-23, 25, 26, 28, 32-36, Moderately common on protected inshore reefs. 2-151856)38, 40, 42, 45, 47, 49, 64, 66Epibulus insidiator (Pallas, 1770) 1-45, 47-60, 63-66 Common. 1-40Gomphosus varius Lacepède, 1801 1-3, 6-18, 20-24, 27-32, 34-36, Common. Hybrid between Gomphosus x T. lunare seen at 1-3038, 39, 41-46, 48-54, 56-63, 65,66site 1. Photographed.Halichoeres argus (Bloch and Schneider, 1, 6, 9-11, 13, 19, 25, 26, 33, 52, Occasional, usually in silty protected areas with weeds. 0-31801)54, 56, 57H. binotopsis (Bleeker, 1849) Rare, about five seen. 2-20H. biocellatus Schultz, 1960 2, 3, 5, 7, 24, 36, 39, 42, 44, 46, Moderately common on outer reef slopes. 6-3548, 50-52, 54, 58, 59, 61-63, 65,66H.chloropterus (Bloch, 1791) 1, 4, 6, 8-14, 19, 20, 25, 26, 33, Moderately common, ususally on protected inshore reefs 0-1035, 37, 38, 40, 45, 47, 54, 55, 64 with sand and weeds.H.chrysus Randall, 1980 1, 2, 3, 5, 15, 18, 21, 22, 27, 28, Moderately common on clean sand bottoms. 7-6031, 32, 34, 36, 38, 42-44, 48-54,56-63, 65, 66H. hartzfeldi Bleeker, 1852 3, 27, 46 Rare. 10-30H. hortulanus (Lacepède, 1802) 1-3, 5-11, 13, 15-25, 27-32, 34- Common. 1-3036, 38, 39, 41-46, 48-54, 56-63,65, 66H. leucurus (Walbaum, 1792) 4, 6, 8-12, 14, 19, 20, 25, 26, 33,37, 40, 42, 45, 47, 55, 64Occasional, mainly on silty inshore reefs. 2-15H. margaritaceus (Valenciennes, 1839) 1, 2, 3, 5, 10, 11, 15, 16, 18, 21,22, 24, 27, 29, 32, 44, 46, 48-54,59, 63, 66H. marginatus (Rüppell, 1835) 2, 3, 5, 7, 11, 13, 16-18, 21, 22,24, 27-29, 36, 38, 39, 42, 44, 46,48, 49, 51-53, 56, 59-61, 63, 65,66Moderately common, usually at sites including shallowwater next to shore.3-60Moderately common. 1-300-3146
Coral Reef Fish DiversitySPECIESSITE RECORDSH. melanurus (Bleeker, 1853) 1, 6, 8-18, 20-23, 26, 28, 32, 34-36, 38-40, 42, 43, 45, 47, 49, 51,53-57, 59, 60, 62, 65, 66ABUNDANCE/BASIS OF RECORD IF NOT DEPTHCOLLECTED DURING REA(m)Common. 2-15H. melasmapomus Randall, 1981 50, 51, 61 Rare, less than 10 seen.H. miniatus (Valenciennes, 1839) 13, 35 Rare, but sometimes locally common. 0-8H. prosopeion (Bleeker, 1853) 1-3, 5-11, 13, 15-24, 26-32, 34- Common in variety of habitats. 5-4036, 38, 39, 41-44, 46, 48, 49, 51-54, 56-63, 65, 66H. richmondi Fowler and Bean, 1928 3, 8, 11, 21, 25, 26, 29, 34, 42, Occasional. Photographed.54, 56H. scapularis (Bennett, 1832) 1, 4, 8-10, 12-17, 20, 21, 25, 26, Moderately common, always in sandy areas. 0-1528, 31-40, 42-45, 51-57, 62, 65H. trimaculatus (Quoy and Gaimard, 21, 51, 52, 56, 60, 62, 63, 65 Occasional, but relatively common at site 62. Found in 0-201834)sandy areas.Hemigymnus fasciatus (Bloch, 1792) 1-3, 5-7, 9, 11, 13, 15-18, 22-24, Common, but usually in lower numbers than H.1-2027, 29, 32, 34, 36, 38, 39, 41-46,48, 50-55, 58, 59, 61-63, 65, 66melapterus.H. melapterus (Bloch, 1791) 1, 2, 4, 5, 7-36, 38-44, 46-54, 56- Common, but in relatively low numbers at each site. 2-3060, 63-66Hologymnosus annulatus (Lacepède, 1, 2 Rare, only 2 seen. 5-301801)H. doliatus (Lacepède, 1801) 1, 44, 46, 48, 52, 59, 65 Rare, less than 10 seen. 4-35Iniistius aneitensis (Günther, 1862) Günther, 1873Labrichthys unilineatus (Guichenot,1847)1, 2, 3, 6, 8-32, 34, 36, 38-40, 42-60, 62-65Common, especially in rich coral areas. 1-20Labroides bicolor Fowler and Bean,19282, 3, 7, 11-13, 16-18, 22, 24, 27,29-32, 34-36, 38, 39, 43-45, 48,50-54, 57-60, 62, 63Moderately common, generally in much smaller numbersthan other Labroides species.L. dimidiatus (Valenciennes, 1839) 1-66 Common 1-40L. pectoralis Randall and Springer, 1975 3, 8, 11, 13, 14, 16-18, 22-32, 34- Moderately common. Photographed. 2-2836, 38, 39, 41-45, 48, 50-54, 57-63, 65Labropsis alleni Randall, 1981 7, 13, 24, 29, 31, 34, 38, 39, 42, Occasional. 4-5251, 61, 63L. australis Randall, 1981 2, 3, 10, 15, 16, 27, 44, 46, 48, Occasional. 2-5551, 54, 58, 61, 63, 65, 66L. xanthonota Randall, 1981 3, 22, 24, 27, 29-32, 36, 41, 44, Occasional. Photographed. 1-3050-54, 57-59, 61, 63Leptojulis urostigma Randall, 1996 11, 48 Rare, but easliy overlooked due to sandy habitat. 15-80Macropharyngodon meleagris1, 2, 5, 11, 13, 16-18, 22, 24, 27, Moderately common, but always in small numbers at each 1-30(Valenciennes, 1839)31, 34, 36, 43, 44, 46, 48, 50-54,57-59, 61-63, 65, 66site.M. negrosensis Herre, 1932 1, 2, 5, 7, 15, 24, 32, 46, 52, 54, Occasional. 8-3056, 58, 59, 65, 66Novaculichthys taeniourus (Lacepède, 1, 2, 16, 21, 22, 32, 43, 44, 46, Occasional. 1-141802)48, 50, 58, 61, 63, 66Oxycheilinus bimaculatus (Valenciennes,1840)9, 17, 18, 22, 23, 26, 46, 56, 57,66Occasional, around rock and coral outcrops on sandy orrubble bottoms.2-110O. celebicus (Bleeker, 1853) 1, 4, 8-14, 17-21, 25, 26, 33, 37,38, 40, 42, 43, 45, 47, 55, 62, 64,66O. diagrammus (Lacepède, 1802) 1, 2, 5, 7, 9, 11, 13-18, 21-24, 26-32, 34-36, 38, 39, 41-54, 56-59,61-63, 65, 66Moderately common on sheltered inshore reefs.Photographed2-403-30Moderately common. 3-120O. orientalis (Günther, 1862) 64 Rare, but several seen in 20-25 m at site 64. Photographed.O. rhodochrous (Playfair and Günther, 8, 16, 27, 32, 34, 38, 59, 63, 65 Occasional. 15-701867)O. unifasciatus (Streets, 1877) 50, 52 Rare, about 5 seen. 3-80Parachelinus filamentosus Allen, 1974 5, 8-11, 15-17, 19, 22, 26-31, 33, Common, usually in rubble areas. 10-5034, 37, 38, 40, 43, 44, 46, 51-55,57, 58, 63, 66Pseudocheilinops ataenia Schultz, 1960 4, 8, 40, 64 Generally rare, but locally common on sheltered reefs. 5-25Pseudocheilinus evanidus Jordan andEvermann, 19022, 3, 5, 7, 11, 18, 24, 27, 31, 32,34, 36, 38, 39, 43, 44, 46, 48-54,56-63, 65, 66Moderately common, especially on outer reefs. 6-40P. hexataenia (Bleeker, 1857) 2, 3, 7, 11, 15, 16, 18, 21, 22, 24-32, 36, 38, 39, 41, 44, 46, 48, 50-54, 56-61, 63, 65, 66Moderately common, only a few seen on each dive, buthas cryptic habits. Photographed.Pseudocoris heteroptera (Bleeker, 1857) 44 Rare, only one male and five females seen. 10-30P. yamashiroi (Schmidt, 1930) 5, 22, 27, 29, 32, 44, 54, 56, 58, Occasional. 10-3063, 66Pseudodax moluccanus (Valenciennes, 2, 3, 5, 15, 21, 22, 24, 27, 29-32, Moderately common, especially on outer reef and in 3-401840)34, 36, 38, 39, 41-44, 48, 51-54,56-59, 61, 63, 65, 66passages.Pseudojuloides cerasinus (Snyder, 1904) 46 Rare, 2 males and 5 females seen. 15-502-35147
<strong>Solomon</strong> <strong>Islands</strong> <strong>Marine</strong> <strong>Assessment</strong> Technical ReportSPECIESSITE RECORDSABUNDANCE/BASIS OF RECORD IF NOT DEPTHCOLLECTED DURING REA(m)Pteragogus cryptus Randall, 1981 3, 11, 14, 15, 16 Rare, but has cryptic habits. 4-65Stethojulis bandanensis (Bleeker, 1851) 2, 9, 11, 15-17, 28, 29, 32, 44, Occasional. 0-3048, 49, 50, 52, 54, 57, 59S. interrupta (Bleeker, 1851) 65 Rare, group of 4 seen in 10 m. 4-25S. strigiventer (Bennett, 1832) 1, 22, 23, 25, 28, 31, 32, 44, 46 Occasional. 0-6S. trilineata (Bloch and Schneider, 1801) 1-3, 5-7, 9, 11, 16, 17, 19, 21-32, Moderately common. 1-1034, 35, 36, 38-40, 42, 44-46, 48,51-54, 56, 57, 59-61, 65, 66Thalassoma amblycephalum (Bleeker, 2, 3, 5, 7, 8, 11-13, 15, 18, 21, Common. 1-151856)22, 24, 27-32, 34, 36, 38, 39, 41,44, 46, 48-54, 59-61, 63, 65, 66T. hardwicke (Bennett, 1828) 1-3, 5-14, 15, 16, 18-32, 34-36,38, 39, 41-46, 48-54, 56, 57, 59-61, 63, 65, 66Common. Photographed. 0-15T. jansenii (Bleeker, 1856) 2, 5, 7, 15, 21, 24, 27, 29, 31, 34,36, 41, 44, 46, 48, 50, 52, 54, 61,63, 65Moderately common, usually in very shallow waterexposed to surge.T. lunare (Linnaeus, 1758) 1-7, 9, 11-13, 15-33, 35-38-66 Common, one of most abundant wrasses. T. lunare x T. 1-30quinquevittatum hybrid seen at site 24. Photographed.T. purpureum (Forsskål, 1775) 21, 29, 41 Rare, only a few seen, but main habitat is surge zone. 2-20T. quinquevittatum (Lay and Bennett, 2, 5, 21, 22, 24, 27, 29, 31, 36, Occasional, locally common at a few sites exposed to 0-181839)41, 44, 48, 50-53, 61, 65surge (e.g. site 24).Wetmorella albofasciata Schultz and 32, 38, 61 Observed in caves at 2 sites and 1 collected with rotenone. 5-40Marshall, 1954W. nigropinnata (Seale, 1901) 61 Collected with rotenone.SCARIDAEBolbometopon muricatum (Valenciennes, 7, 12-14, 18, 20, 24, 28, 31, 33, Occasional, always in low numbers. 1-301840)35, 36, 42, 47, 48, 54, 59Calotomus carolinus (Valenciennes, 2, 11, 32, 46 Rare, only a few seen. 4-301839)Cetoscarus bicolor (Rüppell, 1828) 2, 5-16, 18-29, 32-36, 38, 41-45, Common, but usually in small numbers. 1-3047-49, 51-54, 59-62, 65Chlorurus bleekeri (de Beaufort, 1940) 1, 3, 4, 6-16, 18-43, 45-57, 60-64 Common, one of most abundant parrotfishes in <strong>Solomon</strong>s. 2-30Photographed.C. japanensis (Bloch, 1789) 2, 3, 7, 9, 11, 16-18, 21, 22, 24, Moderately common. 3-2027-29, 32, 34, 41, 44, 46, 48, 51,57, 59, 61, 63, 65, 66C. microrhinos (Bleeker, 1854) 5, 9, 14, 16, 17, 21, 27, 28, 31- Common. Photographed. 2-3533, 35, 36, 38, 39, 41, 44, 48, 50-54, 57-62C. sordidus (Forsskål, 1775) 1-3, 5-7, 9-11, 13, 15, 16, 20-25, Common, one of most abundant parrtofishes in <strong>Solomon</strong>s. 1-2527-32, 34-39, 41-66Hipposcarus longiceps (Bleeker, 1862) 3, 6-10, 12, 15, 16, 18, 20-22, 24, Common at sites adjacent to sandy bottoms. 5-4027-31, 34, 35, 38, 40, 42, 43, 47,51, 52, 57, 59, 60Leptoscarus vaigiensis (Quoy and 11 Rarely seen, but mainly lives amongst seagrass &1-20Gaimard, 1824)sargassum.Scarus altipinnis (Steindachner, 1879) 22, 24, 25, 52, 59, 61 Rarely seen, but moderately common at some sites. 5-20S. chameleon Choat and Randall, 1986) 2, 7, 11, 22, 43, 44, 46, 51, 56, 63 Occasional, always in small numbers. 3-15S. dimidiatus Bleeker, 1859 1, 3, 4, 7-23, 25, 26-40, 42, 43, Common. Photographed. 1-1545-62, 64-66S. flavipectoralis Schultz, 1958 1-4, 6-19, 21-26, 28-32, 34, 35, Common, one of most abundant parrotfishes in <strong>Solomon</strong>s. 8-4038, 40, 42-45, 47-57, 59, 60, 62-66Photographed.S. festivus Valenciennes, 1840 Rare, one adult male seen. 5-30S. forsteni (Bleeker, 1861) 2, 5, 8, 15, 27, 29, 34, 38, 44, 50- Occasional, but locally common at a few sites. 3-3054, 61, 62, 65, 66S. frenatus Lacepède, 1802 3, 7, 18, 22, 28, 29, 50 Occasional. 3-25S. ghobban Forsskål, 1775 15, 20, 22-24, 26, 35, 36, 41, 42, Occasional. 3-3044, 56, 58, 59S. globiceps Valenciennes, 1840 5, 44 Rare, only a few seen. 2-15S. niger Forsskål, 1775 1, 2, 5-7, 9, 11, 13, 15, 17, 18, Common. 2-2020-24, 27-36, 38, 39, 42-45, 47,50-54, 56-61, 63, 65, 66S. oviceps Valenciennes, 1839 2, 3, 7, 16-18, 21-24, 28-32, 34, Common. 1-1236, 38, 39, 41, 44, 45, 50-53, 56-59, 61, 63, 65, 66Scarus prasiognathos 24, 29 Rare, only 2 males seen.S. psittacus Forsskål, 1775 5, 7, 13, 18, 22, 28, 31, 44, 46, Occasional. Photographed. 4-2552, 57-59, 63S. quoyi Valenciennes, 1840 1, 6, 8-11, 16, 20, 21, 23, 25, 26, Common on sheltered reefs.33-35, 42, 45-49, 51, 52, 54-57,60, 64S. rivulatus Valenciennes, 1840 17, 22, 32, 36, 47 Rare, less than 10 seen. 5-200-15148
Coral Reef Fish DiversitySPECIESSITE RECORDSS. rubroviolaceus Bleeker, 1849 2, 3, 5, 7, 16, 21, 22, 24, 27-31,36, 44, 46, 48, 50-54, 58, 61, 63,65ABUNDANCE/BASIS OF RECORD IF NOT DEPTHCOLLECTED DURING REA(m)Moderately common. 1-30S. schlegeli (Bleeker, 1861) 29, 32, 38, 44, 46, 57, 59-61 . Occasional 1-45S. spinus (Kner, 1868) 1, 2, 5, 7, 11, 16, 21, 22, 24, 27, Moderately common. Photographed. 2-1828, 31, 32, 34, 36, 38, 39, 43, 44,50-54, 57, 59-61, 63S. tricolor Bleeker, 1849 32, 34, 36, 39, 41, 54, 61, 63, 65 Occasional, always adjacent to steep slopes, usually below20 m.8-40CREEDIIDAEChalixodytes chamaelontoculis Smith,USNM collection.1957C. tauensis Schultz, 1943 USNM collection.PINGUIPEDIDAEParapercis australis Randall, 2003 46 Rare, only a few seen. Photographed. 5-25P. clathrata Ogilby, 1911 22, 24, 27-29, 34, 44, 46, 48, 50- Occasional, the most common grubfish in <strong>Solomon</strong>s. 3-5053, 62, 63, 65, 66P. lineopunctata Randall, 2003 8, 18, 28 Occasional, but frequents open sand.P. millepunctata (Günther, 1860) 1-3, 5, 6, 11, 15, 21 Occasional, but apparently restricted to NE <strong>Solomon</strong>s. 3-50P. xanthozona (Bleeker, 1849) 8, 9, 20, 21, 22, 23, 25, 26, 42, Occasional. Photographed. 5-2549, 55, 64PHOLIDICHTHYIDAEPholidichthys leucotaenia Bleeker, 1856 7, 22, 27, 36, 39, 41-45, 48-54, Occasional, locally common but usually only juveniles 1-4059, 63seen.TRIPTERYGIIDAE 0-10Ceratobregma helenae Holleman, 1987 Fricke, 1994 0-10Enneapterygius elegans (Peters, 1876) Fricke, 1994 8-37E. fasciatus (Weber, 1908) Fricke, 1994 0-10E. hemimelas (Kner and Steindachner,Fricke, 1994 0-101867)E. philippinus (Peters, 1868) Fricke, 1994 0-10E. rhabdotus Fricke, 1994 Fricke, 1994 0-10E. tutuilae Jordan and Seale, 1906 Fricke, 1994 0-10Helcogramma novaecaledoniae Fricke,Fricke, 1994 3-151994Helcogramma springeri Hansen, 1986 Fricke, 1994 0-10Helcogramma sp. 7 Fricke, 1994 0-10H. striata Hansen, 1986 2 Rare. 1-20H. trigloides (Bleeker, 1858) Fricke, 1994 0-10Springerichthys kulbicki (Fricke andFricke, 1994 0-10Randall, 1994)Ucla xenogrammus Holleman, 1993 8, 10, 29, 37 Rare. Photographed. 2-40BLENNIIDAEAlticus sertatus (Garman, 1903) USNM collection. 0-10Andamia amphibus (Walbaum, 1792) USNM collection. 0-10Aspidontus dussumieri (Valenciennes,USNM collection. 1-251836)A. taeniatus Quoy and Gaimard, 1834 28 Rare, only 1 seen. 1-25Atrosalarias fuscus (Rüppell, 1835) 4, 12, 20, 26, 33, 35, 45, 47, 59, Occasional in rich coral areas, but easily escapes notice.. 1-1264A. hosokawai Suzuki and Senou, 1999 USNM collection.Blenniella caudolineata (Günther, 1877)USNM collection.B. chrysospilos (Bleeker, 1857) 2, 5, 24, 27, 31 Rare, but not readily observed due to shallow wave-swept 0-3habitat.B. interrupta (Bleeker, 1857) USNM collection. 0-3B. paula (Bryan and Herre, 1903) 31 Rare, but not readily observed due to shallow wave-swept 0-3habitat.Cirripectes castaneus Valenciennes, 5, 7, 11 Rare, but easily escapes notice. 1-51836C. filamentosus (Alleyne and Macleay, 16, 34 Rare, but easily escapes notice. 1-201877)C. polyzona (Bleeker, 1868) Williams, 1988 0-3C. stigmaticus Strasburg and Schultz, 2, 5, 7, 18, 21, 24, 27, 28, 35, 38, Occasional. Photographed. 0-5195339, 48, 50-53, 60, 61, 63, 65Cirrisalarias bunares Springer, 1976USNM collection.Crossosalarias macrospilus Smith-Vaniz 15, 43 Rare, only 2 seen. 1-25and Springer, 1971Ecsenius axelrodi Springer, 1988 29 Rare, one photographed by B. Kahn. 10-40E. bicolor (Day, 1888) 24, 28, 58, 61, 66 Rare, usually on outer reefs. Photographed. 3-20E. lividinalis Chapman and Schultz, 1952 1, 64 Rare, only 3 seen. Photographed. 2-15149
<strong>Solomon</strong> <strong>Islands</strong> <strong>Marine</strong> <strong>Assessment</strong> Technical ReportSPECIESSITE RECORDSABUNDANCE/BASIS OF RECORD IF NOT DEPTHCOLLECTED DURING REA(m)E. midas Starck, 1969 32 Rare, only 1 seen. 5-30E. namiyei (Jordan and Evermann, 1903) 33, 42, 55 Rare, about 5 seen. Photographed. 5-30E. pictus McKinney and Springer, 1976 11, 34, 35, 39, 43 Rare, only 5 seen. Photographed. 10-40E. prooculis Chapman and Schultz, 1952(sim E. taeniatus)1, 4, 8-12, 19, 20, 25, 33, 35, 37,40, 42, 43, 45, 47, 55, 64Common on sheltered inshore reefs. Especially numerousat sites 40 & 64. Type locality is Munda I., <strong>Solomon</strong>s.Photographed.E. sellifer Springer, 1988 Springer, 1988 1-15E. trilineatus Springer, 1972 1, 11, 32, 34, 38, 59, 60 Occasional. Photographed. 2-20E. yaeyamensis (Aoyagi, 1954) 21, 22, 24, 25, 39, 54, 59, 60, 66 Occasional. 1-15Enchelyurus kraussi (Klunzinger, 1881) USNM collection. 1-10Entomacrodus caudofasciatus (Regan,USNM collection. 0-31909)E. decussatus (Bleeker, 1858) USNM collection. 0-3E. epalzeochilus (Bleeker, 1859) USNM collection. 0-3E. niaufooensis (Fowler, 1932) USNM collection. 0-3E. sealei Bryan and Herre, 1903 USNM collection. 0-3E.striatus (Quoy and Gaimard, 1836) USNM collection. 0-2E. thalassinus (Jordan and Seale, 1906) USNM collection. 0-3E. vermiculatus (Valenciennes, 1837) USNM collection. 0-3E. williamsi Springer and Fricke, 2000 USNM collection. 0-3Exallias brevis (Kner, 1868) 32 Rare, only 1 seen. 1-20Glyptoparus delicatulus Smith, 1959 35 Rare, several seen. 1-5Istiblennius edentulus Bloch and1 Rare, but lives mainly in inter-tidal zone. 0-2Schneider, 1801I. lineatus (Valenciennes, 1836) USNM USNM collection. 0-2Laiphognathus multimaculatus Smith, 64 Rare, only 1 seen. Photographed. 5-151955Meiacanthus anema (Bleeker, 1852)Reported from <strong>Solomon</strong>s by Smith-Vaniz, 1976, but 0-3mainly freshwater/estuarine.M. atrodorsalis (Günther, 1877) 1, 2, 5-16, 20, 21, 23, 25-36, 38- Common. 1-2045, 48-54, 56-66M. crinitus Smith-Vaniz, 1987 14, 37, 45, 47 Rarely seen, but moderately common at a few shelteredsites with significant silt. Photographed.M. grammistes (Valenciennes, 1836) 1, 9, 12, 14, 15, 17, 18, 20, 22, Moderately common. Photographed. 1-2029, 33, 37, 45, 47, 55, 56, 62, 64,66Nannosalarias nativittatus Regan, 1909) USNM collection. 1-10Petroscirtes mitratus (Rüppell, 1830) USNM collection. 0-10P. thepassi Bleeker, 1853 (marbled) USNM collection. 0-10P. xestus Jordan and Seale, 1906 USNM collection.Plagiotremus laudandus (Whitley, 1961) 6, 7, 22, 26, 33, 34, 36, 50 Occasional. 2-35P. rhinorhynchus (Bleeker, 1852) 8, 14, 17-23, 25-29, 32-34-37, Common, but alway in low numbers. Photographed. 1-4040, 42, 43, 45, 51-53, 55-58, 61,63-66P. tapeinosoma (Bleeker, 1857) 21, 29, 32, 48, 55 Rare. 1-25Praealticus bilineatus. (Peters, 1868) USNM collection.Rhabdoblennius snowi (Fowler, 1928)USNM collection.Salarias alboguttatus (Kner, 1867) 1, 35, 37, 45 Rarely seen, but moderately common near shore at a fewsites. Photographed.S. ceramensis (Bleeker, 1852) 25, 35, 64 Rare, about 8 seen. Photographed.S. fasciatus (Bloch, 1786) 1 Rare, only 1 seen. 0-8S. guttatus Valenciennes, 1836 25, 28, 35 Rare, only a few seen. 1-15S. segmentatus Bath and Randall, 1991 4, 14, 26, 33, 35, 37, 40, 45, 47, Occasional on sheltered inshore reefs. Photographed. 2-3055, 64S. sinuosus Snyder, 1908 USNM collection.Stanulus seychellensis Smith, 1959USNM collection.Xiphasia matsubarai Okada and Suzuki,USNM collection.1952CALLIONYMIDAECallionymus delicatulus Smith, 1963 USNM collection. 1-20C. enneactis Bleeker, 1879 9, 14, 20, 26, 33, 37, 40, 42, 45, Occasional on sand bottoms. Photographed. 0-2054Diplogrammus goramensis (Bleeker,USNM collection. 5-351858)Synchiropus laddi Schultz, 1960USNM collection.S. morrisoni Schultz, 1960 USNM collection.S. splendidus (Herre, 1927) 37 Rare, a few seen at 1 site, but cryptic habits. Photographed. 1-18ELEOTRIDAECalumia godeffroyi 5, 34 Collected with rotenone.GOBIIDAEAmblyeleotris biguttata Randall, 2004 20, 25, 26 Rare, but sand habitat inadequately sampled. Guadalcanalis type locality. Photographed.1-15150
Coral Reef Fish DiversitySPECIESSITE RECORDSABUNDANCE/BASIS OF RECORD IF NOT DEPTHCOLLECTED DURING REA(m)A. diagonalis Polunin and Lubbock, 1979 11, 12 Rare, but sand habitat inadequately sampled.6-35Photographed.A. fontanesii (Bleeker, 1852) 14, 20, 25, 26, 55, 64 Occasional on soft silty bottoms. Photographed. 5-25A. guttata (Fowler, 1938) 3, 8-10, 13, 16, 18, 20, 23, 26, Moderately common, the most abundant shrimp goby in 10-3531, 32, 36, 38, 39, 44-46, 48-51,53-56, 61, 63, 65<strong>Solomon</strong>s. Photographed.A. gymnocephala (Bleeker, 1853) 40 Rare, but sand habitat inadequately sampled.A. periophthalma (Bleeker, 1853) 25, 44 Rare, but sand habitat inadequately sampled.8-15Photographed.A. randalli Hoese and Steene, 1978 8, 31, 39, 50, 53, 61 Rare, only 6 seen. Photographed.A. sp. 8, 12, 55 Rare, but sand habitat inadequately sampled. Photographed 10-20at 12.A. steinitzi (Klausewitz, 1974) 4, 8, 11, 16-18, 20, 21, 28, 32, Occasional, locally common in some sandy areas. 6-3040, 45, 46, 56, 57, 62A. wheeleri (Polunin and Lubbock, 1977) 6, 22, 23, 28, 32, 34, 46, 48, 50, Occasional. 5-2051, 53, 57, 65Amblygobius buanensis (Herre, 1927) 64 Rare, but found in very shallow water next to mangrove 1-5shore. Photographed.A. decussatus (Bleeker, 1855) 4, 8, 12, 14, 16, 17, 19, 20, 25, Moderately common on silty inshore reefs.26, 33, 35, 37, 38, 40, 45, 47, 55,60, 64A. nocturnus (Herre, 1945) 8, 14, 25, 26, 33, 45, 64 Occasional on silty inshore reefs.A. phalaena (Valenciennes, 1837) 4, 8-10, 14, 35, 40, 45 Occasional. 1-20A. rainfordi (Whitley, 1940) 4, 8-10, 13, 14, 16-18, 20, 21, 26, Occasional. 5-2531-35, 38-40, 42, 43, 45, 46, 60,64Ancistrogobius yanoi Shibukawa,Yoshino & Allen, in press4, 8, 14, 19, 45, 49, 64 Rare, but sand habitat inadequately sampled.Photographed.Asterropteryx bipunctatus Allen and 19, 60 Rare, but difficult to detect due to cryptic habits.15-40Munday, 1996Photographed.A. ensifera (Bleeker, 1874) USNM collection. 6-40A. semipunctatus Rüppell, 1830 14, 35 Rarely seen, but prefers shallows next to shore. 1-10A. striatus Allen and Munday, 1996 6, 34, 35, 38, 43, 45, 46, 52, 57, Occasional, but locally abundant. Photographed. 5-2066Bathygobius cyclopterus (Valenciennes,USNM collection. 0-21837)Bathygobius fuscus (Rüppell, 1830) USNM collection. 0-2Bryaninops amplus Larson, 1985 3, 22, 28, 59 Only a few seen, but difficult to detect. No doubt common 10-40wherever seawhips are abundant.B. loki Larson, 1985 2, 21, 32, 36, 41, 43, 63 Occasional, but no doubt common where sea fans and 6-45black coral are abundant.B. natans Larson, 1986 26, 38 Rare, but relatively inconspicuous due to tiny size. 6-27B. yongei (Davis and Cohen, 1968) 8, 9, 18, 21, 26, 46, 63 Occasional, but difficult to detect. No doubt commonwherever seawhips are abundant.Cabillus tongarevae (Fowler, 1927)USNM collection.Callogobius clitellus McKinney &USNM collection.Lachner, 1978C. maculipennis (Fowler, 1918) USNM collection.C. sclateri (Steindachner, 1879) USNM collection. 3-25Cryptocentrus cinctus (Herre, 1936) 4, 12, 37, 40, 45 Rare, but sand habitat not adequately surveyed.2-15Photographed.C. fasciatus (Playfair and Günther, 1867) 12, 18, 46 Rare, but sand habitat not adequately surveyed. 2-15C. inexplicatus (Herre, 1934) 4, 14, 40, 64 Rare, but sand habitat not adequately surveyed.Photographed.C. leucostictus (Günther, 1872) 13, 18 Rare, but sand habitat not adequately surveyed.Photographed.C. strigilliceps (Jordan and Seale, 1906) 8, 12, 14, 20, 25, 31, 33, 35, 37, Occasional, but sand/silt habitat not adequately surveyed. 1-638, 47, 54, 55, 57, 64, 65Photographed.C. sp. 1 (Bluespot Shrimpgoby) 8, 12, 14, 25 Rare, but sand/silt habitat not adequately surveyed.Photographed.C. sp. 2 (Ventral-barred) 12, 20 Rare, but sand/silt habitat not adequately surveyed.Photographed.C. sp. 3 (Dorsal spot) 45 Rare, but sand/silt habitat not adequately surveyed.Photographed.Ctenogobiops feroculus Lubbock andPolunin, 19778, 32 Rare, only a few seen. 2-15C. pomastictus Lubbock and Polunin,1977Eviota albolineata Jewett and Lachner,1983E. bifasciata Lachner and Karnella, 1980 4, 8, 9, 16, 19, 20, 33, 34, 37, 38,4, 8, 9, 10, 13, 14, 16-18, 20, 21,23, 25, 26, 33, 35, 36, 38-40, 42,45, 47, 49, 51, 55, 62Occasional. Photographed. 2-201, 32, 35, 40, 42, 43, 60 Noticed on several occasions, but easily missed due to 1-10small size. Photographed.Occasional, but locally abundant. Photographed. 5-2540, 42, 62, 64E. cometae Jewett & Lachner, 1983 34 Three specimens collected with quinaldine.151
<strong>Solomon</strong> <strong>Islands</strong> <strong>Marine</strong> <strong>Assessment</strong> Technical ReportSPECIESSITE RECORDSABUNDANCE/BASIS OF RECORD IF NOTCOLLECTED DURING REAE. distigma Jordan & Seale, 1906 61 One specimen collected in 18 m with rotenone.E. fasciola Karanella and Lachner, 1981 USNM collection.E. guttata Lachner and Karanella, 1978 1, 9, 13, 24, 26, 27, 31, 32-34, Occasional, but easily missed due to small size.36, 38, 39, 41, 42, 45, 46, 49, 51, Photographed.59, 60E. lachdeberei Giltay, 1933 12, 33, 37, 40 Rarely encountered, but common at site 33.E. lacrimae Sunobe, 1988 USNM collection.E. melasma Lachner and Karanella, 1980 USNM collection. 2-15E. nigriventris Giltay, 1933 8, 19, 20, 40 Rarely encountered, but locally common in highly4-20sheltered areas. Photographed.E. pellucida Larson, 1976 1, 4, 6, 8, 9, 11-13, 16, 19-21, 23, Moderately common. 3-2025, 26, 32-35, 37-40, 42, 43, 45,47, 54, 55, 60, 62, 64E. prasites Jordan and Seale, 1906 29, 32, 34, 38, 63 Noticed on several occasions, but easily missed due to 3-15small size.E. punctulata Jewett and Lachner, 1983 8, 22, 33 1-10E. queenslandica Whitley, 1932 35 Noticed on only 1 occasion, but easily missed due to small 5-30size. Photographed.E. sebreei Jordan and Seale, 1906 29, 32 Noticed on only 2 occasions, but easily missed due to 3-20small size. Photographed.E. sigillata Jewett and Lachner, 1983 33 Noticed on only 1 occasion, but easily missed due to small 3-20size. Two specimens collected.E. sparsa Jewett & Lachner, 1983 48 One collected with rotenone in 30 m.Exyrias bellisimus (Smith, 1959) 8, 9, 12, 14, 16, 19, 20, 21, 25, 33 Occasional on silty reefs.. 1-25Fusigobius aureus (Randall, 2001) 33 Rare, only 1 seen. Photographed.Fusigobius duospilus Hoese and Reader, 29 Rare, only 1 seen.1985F. inframaculatus Randall, 1994 31 Rare, only 5 seen. Photographed.F. neophytus (Günther, 1877) 4, 12, 20, 22, 23, 25, 26, 37, 40, Occasional. Photographed. 2-1542, 45, 57, 60F. signipinnis Hoese and Obika, 1988 1, 2, 4, 8, 11, 12, 15-18, 20, 23, Occasional, but locally common. Photographed. 10-3026, 33, 37, 38-40, 45, 47, 48, 52-54, 62, 63F. melacron Randall, 2001 6, 8, 34, 38, 54 Rare, but easily overlooked. 5-25Gladiogobius ensifer Herre, 1933 33 Rare, only a few seen, but easily escapes notice.Photographed.Gnatholepis anjerensis (Bleeker, 1851) 13, 33, 37 Rarely observed, but frequents very shallow water next to 3-30shore. Photographed.G. cauerensis (Bleeker, 1853) 31, 32, 36, 45, 54, 55, 57 Only a few seen, but easily escapes notice due to small 1-45size and cryptic habits. Photographed.Gobiodon acicularis Harold and40 Several specimens collected from plate Acropora. 3-15Winterbottom, 1995.G. axillaris DeVis, 1884 USNM collection.G. okinawae Sawada, Arai and Abe, 8, 19, 20, 45, 64 Relatively rare, but a secretive species that is easily 2-121973overlooked.G. quinquestrigatus (Valenciennes, USNM USNM collection. 2-121837)G. spilophthalmus Fowler, 1944 33, 40 Rare, but a secretive species that is easily overlooked. 2-15Istigobius decoratus (Herre, 1927) 31, 54, 56 Only a few seen, but probably moderately common on 1-18sand bottoms. Photographed.I. nigroocellatus (Günther, 1873) 18, 21 Only a few seen, but probably moderately common onsand bottoms..I. ornatus (Rüppell, 1830) 13 Only a few seen, but probably moderately common on 0-5sand bottoms..I. rigilius (Herre, 1953) 32, 45 Only a few seen, but probably moderately common on 0-30sand bottoms..Lotila graciliosa Klausewitz, 1960 18, 29 Rare. 2-15Macrodontogobius wilburi Herre, 1936 4, 8, 9, 12, 14, 19, 20, 23, 25, 26, Occasional in slilty areas. Common at site 12.2-1533, 37, 40, 45, 47, 55, 60, 64 PhotographedMahidolia mystacina (Valenciennes, 8, 12, 14, 25, 33, 37, 45, 49, 64 Occasional. Photographed.1837)Oplopomops diacanthus (Schultz, 1943) 35 Only noticed on one occasion, but very tiny and lives onbarren sand. Two specimens collected. Photographed.Oplopomus oplopomus (Valenciennes, 12, 25, 64 Probably common, but seldom noticed in sandy areas. 2-251837)PhotographedOxyurichthys sp. 1 Kuiter & Tonozuka, 8 One specimen collected.2001Paragobiodon echinocephalus (Rüppell,USNM collection. 1-121830)Periophthalmus argentilineatusUSNM collection.Valenciennes, 1837P. kalolo Lesson, 1831 USNM collection.DEPTH(m)3-15152
Coral Reef Fish DiversitySPECIESSITE RECORDSABUNDANCE/BASIS OF RECORD IF NOT DEPTHCOLLECTED DURING REA(m)Phyllogobius platycephalops (Smith, 9, 16, 26, 38, 56, 59 Only a few seen, but easily escapes notice due to small 3-201964)size and cryptic habits. Commensal with sponges(Phyllospongia).Pleurosicya boldinghi Weber, 1913 5 Only one seen in 35 m, but easily escapes notice due to 8-40small size and cryptic habits.P. elongata Larson, 1990 4, 8, 33, 42, 66 Occasional, commensal with sponge (Ianthella basta). 10-40Photographed.P. micheli Fourmanoir, 1971 34 USNM collection. 10-50Priolepis cincta (Regan, 1908) USNM collection. 1-70P. fallacincta Winterbottom andWinterbottom and Burridge, 1992Burridge, 1992P. inhaca (Smith, 1949) USNM collection.P. nuchifasciatus (Günther, 1873) USNM collection.P. semidoliatus (Valenciennes, 1837) Winterbottom and Burridge, 1993 0-10Sueviota lachneri Winterbottom and 61 One specimen collected with rotenone in 18 m.Hoese, 1988Signigobius biocellatus Hoese and Allen, 8, 12, 26, 38, 42, 45, 54 Occasional on silty bottoms. Photographed. 2-301977Stonogobiops xanthorhinica Hoese and 58 One seen on outer slope in 35 m. 12-60Randall,1982Trimma anaima Winterbottom, 2000 41 Only 1 noticed, but easly escapes notice due to small size.Photographed.T. benjamini Winterbottom, 1996 26, 50, 52, 60 Only a few noticed, but easly escapes notice due to small 10-24sizeT. caesiura (Jordan and Seale, 1906) USNM collection. 2-12T. griffthsi Winterbottom, 1984 4, 6, 19, 40, 64 Occasional, but is easily overlooked due to small size and 20-40secretive habits.T. macrophthalma (Tomiyama, 1936) 34 One specimen collected with rotenone. 5-30T. naudei Smith, 1957 4, 8, 38, 39 Occasional, but is easily overlooked due to small size andsecretive habits.T. okinawae (Aoyagi, 1949) USNM collection. 5-30T. rubromaculata Allen and Munday, 32 Seen only once, but common in 40 m depth at site 32. 20-351995T. sp. 8 (red with yellow mid-lateral 6, 40, 49, 64 Occasional. Two specimens collected with quinaldine 25-40stripe, white on belly)sulphate.T. striata (Herre, 1945) 33 Rare, but easily overlooked due to small size and secretive 2-25habits.T. taylori Lobel, 1979 6, 60 Rare, but easily overlooked due to small size and secretive 15-50habits. Photographed.T. tevegae Cohen and Davis, 1969 1, 6, 8, 10, 11, 13, 16, 19, 21, 26, Moderately common under ledges and in caverns on steep 8-4532, 34, 36, 38-41, 54, 56, 57, 60 slopes. Photographed.Trimmatom eviotops (Schultz, 1943)USNM collection.T. nanus Winterbottom and Emery, 1981 USNM collection. 6-35Valenciennea helsdingenii (Bleeker,Hoese and Larson, 1994 1-301858)V. muralis (Valenciennes, 1837) 4, 33, 37, 40, 47 Rarely seen, but probably moderately common in shallow 1-15sandy areas near shore.V. parva Hoese & Larson, 1994 Hoese and Larson, 1994V. puellaris (Tomiyama, 1936) 8, 49, 65 Rare, only 2 seen, but found on open sand. 2-30V. randalli Hoese and Larson, 1994 8, 46, 64 Rare, only 4 seen. Photographed. 8-30V. sexguttata (Valenciennes, 1837) 4, 8, 32, 45 Rarely seen, but probably moderately common in shallow 1-10sandy areas near shore.V. strigata (Broussonet, 1782) 2, 5, 8, 11, 21, 28, 29, 31, 33, 36, Occasional, in relatively low numbers at each site. Usually 1-2544, 46, 48, 50, 51, 53, 58, 63, 65,66seen in pairs.Vanderhorstia ambanoro (Fourmanoir, 14, 20 Rare, but sand habitat inadequately surveyed.4-201957)Photographed.V. sp. 12, 25 Rare. Photographed.Yongeichthys criniger (Valenciennes,USNM collection.1837)PTERELEOTRIDAEAioliops novaeguineae Rennis and 8, 12, 14, 19, 20, 33, 37, 45 Occasional. 1-15Hoese, 1987Nemateleotris decora Randall and Allen, 2, 27, 29, 32, 34, 36, 38, 39, 44, Occasional on steep outer slopes. Photographed. 28-70197358, 61N. magnifica Fowler, 1938 22, 29, 32, 34, 36, 38, 39, 44, 50- Occasional. Photographed. 6-6153, 58, 61, 65Parioglossus lineatus Rennis and Hoese,USNM collection also.1985P. rainfordi McCulloch, 1921 8, 13, 40 Rarely encountered, but locally abundant along edge ofmangroves. Photographed at site13.P. nudus Rennis and Hoese, 1985 10, 39 Rare, but easily overlooked due to small size. Seen todepths of 15-20 m. Photographed.10-35153
<strong>Solomon</strong> <strong>Islands</strong> <strong>Marine</strong> <strong>Assessment</strong> Technical ReportSPECIESPtereleotris evides (Jordan and Hubbs,1925)SITE RECORDS5, 9, 14, 15, 18, 19, 21-24, 26-28,43, 44, 46, 48, 50-54, 57-59, 61,63, 65, 66ABUNDANCE/BASIS OF RECORD IF NOT DEPTHCOLLECTED DURING REA(m)Moderately common. 2-15P. heteroptera (Bleeker, 1855) 5, 22, 27, 38, 44, 58 Occasional, usually below 25 m depth. 6-50P. microlepis Bleeker, 1856 4, 5, 10, 33, 37, 40 Occasional, but locally common. 1-22P. uroditaenia Randall and Hoese, 1985 Randall and Hoese, 1985. 10-30P. zebra (Fowler, 1938) 2, 5, 27, 31, 48, 58, 63 Occasional. 2-10XENISTHMIDAETyson belos Springer, 1983USNM collection.Xenisthmus sp. USNM collection. 5-20EPHIPPIDAEPlatax boersi Bleeker, 1852 24, 25, 28, 35, 38, 52, 56, 58 Occasional. Photographed. 1-20P. orbicularis (Forsskål, 1775) 8, 51 Rare, only 2 adults seen. 1-30P. pinnatus (Linnaeus, 1758) 6, 13, 14, 22, 28, 32, 33, 35, 39, Occasional. Photographed. 1-3552, 54, 56, 59, 63, 65P. teira (Forsskål, 1775) 17, 18, 24, 32, 43, 49, 54, 58 Occasional. 0-2SIGANIDAESiganus argenteus (Quoy and Gaimard, 3, 8, 21, 22, 24, 26, 27, 32, 33, 35, Occasional. 1-301824)45, 48, 50-52, 54, 56S. corallinus (Valenciennes, 1835) 7, 9, 11, 12, 14, 15, 17, 18, 21-24, Moderately common. Photographed. 4-2526-28, 32, 38, 39, 43, 47, 53, 54,56, 58, 59, 61, 63, 64S. doliatus Cuvier, 1830 4, 5, 9, 10, 14, 17, 20, 25, 28, 29, Moderately common, usually at sheltered sites. 1-1533, 35, 37, 38, 40, 42, 44, 46-49,54, 55, 58, 60S. fuscescens (Houttuyn, 1782) Woodland, 1990S. lineatus (Linnaeus, 1835) 8, 9, 21, 26, 33, 35, 38, 42, 48, 56, Occasional, but sometimes in large schools. 1-2557, 60S. puellus (Schlegel, 1852) 2, 3, 5, 8, 9, 11, 13-18, 21-24, 26- Common. 2-3028, 31-34, 36, 38-45, 47-54, 56-58, 61, 62, 64, 65S. punctatissimus Fowler and Bean, 1929 1, 2, 3, 8, 9, 14, 15, 22, 24, 27, 29, Occasional, usually in pairs. Photographed. 3-3032-36, 40, 47, 48, 51, 59, 60, 62,64S. punctatus (Forster, 1801) Woodland, 1990 1-40S. randalli Woodland, 1990 Woodland, 1990 1-15S. spinus (Linnaeus, 1758) 11, 16 Occasional, but main habitat (seagrass) not surveyed. 1-12S. vermiculatus (Valenciennes, 1835) 64 One school seen on edge of mangroves.S. vulpinus (Schlegel and Müller, 1844) 1-66 Common, usually in pairs. 1-30ZANCLIDAEZanclus cornutus Linnaeus, 1758 1-5, 7-36, 38-66 Common. Photographed. 1-180ACANTHURIDAEAcanthurus bariene Lesson, 1830 5, 22, 44, 48 Rare, less than 10 seen. 15-50A. blochi Valenciennes, 1835 2, 9, 12, 16, 19, 22, 24, 27, 28, 34, Occasional, Large schools encountered at site 22. 3-2036, 44, 51, 56, 57A. dussumieri Valenciennes, 1835 Seale, 1935A. fowleri de Beaufort, 1951 32, 34, 38, 39, 63, 65 Rare, a few seen on steep outer slopes. 10-30A. guttatus Forster, 1801 29, 36 Rare, but main habitat is rocky surge zone next to shore.A. lineatus (Linnaeus, 1758) 2, 3, 5-7, 9, 11, 13-19, 21, 22, 24, Common, usually on reef top shallow surge-affected areas. 1-1525, 27-32, 34-36, 38, 39, 41, 43,44, 46, 48-54, 56-61, 63, 65, 66A. maculiceps (Ahl, 1923) 11, 17, 21, 24, 28, 34, 44, 48, 51, Occasional. 1-1552A. mata (Cuvier, 1829) 1, 3, 8, 18, 22, 23, 27, 28, 31, 36, Occasionally encountered, but locally abundant at site 28. 5-3044, 52, 53, 61, 65, 66A. nigricans (Linnaeus, 1758) 2, 11, 22, 24, 29, 36, 44, 50-53, Occasional, but locally common at a few sites.3-6558-60, 63Photographed.A. nigricaudus Duncker and Mohr, 1929 2, 3, 8, 10, 16, 17, 22, 23, 26, 28- Moderately common. 3-3036, 38, 39, 42, 43, 46, 48, 54, 59-62, 65, 66A. nigrofuscus (Forsskål, 1775) 2, 3, 5, 7, 11, 13, 15, 21, 27, 29, Moderately common. 2-2032, 36, 38, 39, 43, 44, 46, 48, 49,51-54, 56, 58, 59, 65, 66A. nubilus (Fowler and Bean, 1929) 32, 34, 36, 38, 39, 41, 43, 54, 60, Occasional on steep outer slopes. 10-3061A. olivaceus Bloch and Schneider, 1801 2, 5, 16, 22, 31, 44, 52, 61, 66 Occasional, but locally abundant at some sites. 5-45A. pyroferus Kittlitz, 1834 1-3, 5-13, 16-18, 21-32, 36, 38- Common. Photographed. 4-6046, 48-54, 56-63, 65, 66A. thompsoni (Fowler, 1923) 2, 13, 23, 24, 27, 29-32, 34, 36, Common on outer slopes, usually on steep dropoffs. 4-7538, 39, 41-44, 50-54, 57, 58, 61A. triostegus (Linnaeus, 1758) 1, 2, 5, 11, 16, 21, 24, 27-29, 41, Occasional, usually in shallow wave-affected areas. 0-9052A. xanthopterus Valenciennes, 1835 8, 9, 14, 18-21, 23, 25, 26, 28, 32,33, 45, 47, 52, 55Occasional, usually on sandy slopes adjacent to reefs. 3-90154
Coral Reef Fish DiversitySPECIESSITE RECORDSABUNDANCE/BASIS OF RECORD IF NOT DEPTHCOLLECTED DURING REA(m)Ctenochaetus binotatus Randall, 1955 1, 2, 5-17, 21-31, 35, 38, 40, 42- Common. 10-5566C. striatus (Quoy and Gaimard, 1824) 1-3, 5-66 Common, usually in depths less than 10 m. 2-30C. cyanocheilus Randall & Clements, 3, 12, 13, 22 Only a few noticed, but hard to differentiate from C. 3-252001striatus at a distance.C. tominiensis Randall, 1955 7, 9, 11, 13, 14, 16, 19, 20, 23-26, Moderately common, especially in sheltered locations that 5-4029, 32, 34-36, 38-43, 45, 47, 49,51, 54, 57, 60, 64drop steeply to deep water. Photographed.Naso brachycentron (Valenciennes, 15-17, 21, 22, 28, 29, 44, 51, 52 Occasional. 15-501835)N. brevirostris (Valenciennes, 1835) 24, 28, 32, 34, 36, 44, Occasional. 4-50N. hexacanthus (Bleeker, 1855) 22, 32, 34, 39, 50-53, 59, 61, 65 Occasional, but locally common to abundant on outer reef 6-140slopes.N. lituratus (Bloch and Schneider, 1801) 2, 3, 5-11, 13-18, 20-24, 26-32, Common. 5-9034, 36, 38-54, 56-66N. lopezi Herre, 1927 31, 34, 38 Rare, a few seen on outer reef slopes. Photographed. 6-70N. minor (Smith, 1966) 27, 32, 63 Generally rare, but 2 large schools (and solitary fish at site 10-5063) encountered on outer reefs.N. thynnoides (Valenciennes, 1835) 27, 44, 66 Generally rare, but 2 large schools encountered on outer 8-50reefs.N. tonganus (Valenciennes, 1835) 2, 51 Rare. 3-20N. unicornis (Forsskål, 1775) 9, 11, 15, 16, 21, 22, 24, 28, 56,58, 59, 65Occasional. 4-80N. vlamingii Valenciennes, 1835 3, 8, 11, 13-15, 18, 22, 23, 27, 31,32, 34, 36, 39-41, 43, 44, 50-53,58, 60, 61, 64, 66Moderately common, usually adjacent to steeper outerslopes.Paracanthurus hepatus (Linnaeus, 1758) 5, 31, 34, 44, 46, 62, 63, 66 Occasional. 2-40Zebrasoma scopas (Cuvier, 1829) 1, 3, 5-66 Abundant. 1-60Z. veliferum (Bloch, 1797) 2, 4, 5, 8-15, 18, 19, 21, 24-40, Common. Photographed. 4-3042-47, 49-57, 59, 60, 62, 64, 65SPHYRAENIDAESphyraena barracuda (Walbaum, 1792) 42, 54, 57 Rare, only 3 seen. 0-20S. flavicauda Rüppell, 1838 25, 57 Two schools encountered. Photographed. 1-20S. forsteri Cuvier, 1829 32 One school of about 100 fish seen. Photographed.S. jello Cuvier, 1829 34, 36 Two schools encountered. 1-20S. qenie Klunzinger, 1870 32, 59 Two schools encountered. 5-404-50SCOMBRIDAEEuthynnus affinis (Cantor, 1849) Caught by local fisherman near site 65. 0-20Gymnosarda unicolor (Rüppell, 1836) 15, 17, 27, 50, 52, 61, 63 Rare, about 8 fish seen on outer reef slopes. 5-100Rastrelliger kanagurta (Cuvier, 1816) 8, 16, 18, 19, 28, 34, 35, 39, 42, Occasional, often in large schools. Photographed. 0-3044, 48, 53, 54, 56, 57Scomberomorus commerson (Lacepède, 2, 22, 25, 34, 39, 52, 53 Rare, 7 seen on outer reef slopes. 0-301800)BOTHIDAEBothus mancus (Broussonet, 1782) 8 Only 1 seen, but very difficult to detect due to camouflage 5-30coloration.B. pantherinus (Rüppell, 1830) Fowler, 1928BALISTIDAEBalistapus undulatus (Park, 1797) 1-66 Abundant. 3-50Balistoides conspicillum (Bloch and 2, 3, 18, 22, 28, 34, 36, 41-44, 50, Occasional. Photographed. 10-50Schneider, 1801)52, 58, 61, 63, 65B. viridescens (Bloch and Schneider, 5, 10, 16, 21-24, 26-36, 38, 39, Occasional. 5-451801)41-44, 51-53, 55, 57-59, 61, 64,65Canthidermis maculatus (Bloch, 1786) 52, 53 Rare, but locally common at 2 sites. Also photographed 1-30around floating log by B. Kahn. Photographed.Melichthys vidua (Solander, 1844) 2, 5, 7, 13, 18, 21, 22, 24, 27-32,34, 36, 38, 39, 41, 43, 44, 50-54,57-61, 63, 65, 66Moderately common. 3-60Odonus niger (Rüppell, 1836) 1, 8, 16, 18, 22, 24, 27, 28, 31, 32,34, 36, 39, 42-44, 46, 49, 51-54,56-58, 61, 63, 66Pseudobalistes flavimarginatus (Rüppell, 2, 5, 8, 26, 33-35, 40, 48, 52, 54,1828)59, 65Moderately common, but locally abundant at some sites(e.g. site 66). Photographed.3-40Occasional, in sheltered sand or rubble areas. 2-50Rhinecanthus aculeatus (Linnaeus, 1758) 16, 40, 52 Rare, about 5 seen. 0-3R. rectangulus (Bloch and Schneider, 2, 5, 21, 24, 52 Rare, less than 10 encountered. 1-31801)R. verrucosus (Linnaeus, 1758) 1, 4, 6, 10, 11, 16, 18, 21, 22, 28,32, 35, 40, 52, 55, 56, 60Occasional, but locally common on shallow flats nearshore.0-3155
<strong>Solomon</strong> <strong>Islands</strong> <strong>Marine</strong> <strong>Assessment</strong> Technical ReportSPECIESSufflamen bursa (Bloch and Schneider,1801)S. chrysoptera (Bloch and Schneider,1801)SITE RECORDS1-3, 5, 7, 8-13, 15, 18, 21-24, 26-32, 34, 36, 38, 39, 41-46, 48-54,56-63, 65, 661-3, 4, 5, 7, 10, 15, 18, 21-24, 27,28, 31, 34, 38, 40, 42-44, 46, 48-53, 56-58, 60-63, 65, 66ABUNDANCE/BASIS OF RECORD IF NOT DEPTHCOLLECTED DURING REA(m)Common. Photographed. 3-90Common. Photographed. 1-35S. fraenatus (Latreille, 1804) 46 Rare, 1 seen in 25 m depth. 8-185Xanthichthys auromarginatus (Bennett, 41, 58 Rare, but mainly occurs below 30 m on steep outer reef 25-801832)slopes. Photographed.MONACANTHIDAEAluterus scriptus (Osbeck, 1765) 21, 22, 28, 32, 41, 42, 52, 53, 63 Occasional. 2-80Amanses scopas (Cuvier, 1829) 2, 3, 22, 27, 32, 38, 44, 48-52, 57, Occasional. 3-2063Cantherines dumerilii (Hollard, 1854) 24, 52 Rare. 1-35C. pardalis (Rüppell, 1866) 1, 2, 3, 27, 50, 52, 63 Occasional. 2-20Oxymonacanthus longirostris (Bloch and 3, 11, 29, 34, 48, 49 Occasional, in rich coral areas. 1-30Schneider, 1801)Pervagor janthinosoma (Bleeker, 1854) Hutchins, 1986 2-18P. melanocephalus (Bleeker, 1853) Hutchins, 1986 15-40P. nigrolineatus (Herre, 1927) 37, 45, 64 Rare, only 6 seen, but relatively cryptic. Photographed. 2-15OSTRACIIDAELactoria cornuta (Linnaeus, 1758) Seale, 1906Ostracion cubicus Linnaeus, 1758 2, 15, 22, 27, 28, 32, 41-43, 52 Occasional. 1-40O. meleagris Shaw, 1796 11, 21, 22, 41, 43, 44, 49, 50, 51, Occasional. Photographed. 2-3063, 66O. solorensis Bleeker, 1853 1, 27, 29, 44, 50, 52, 63 Occasional. 1-20TETRAODONTIDAEArothron hispidus (Linnaeus, 1758) Seale, 1935A. mappa (Lesson, 1830) 4, 6, 29, 32, 43, 61 Rare, 6 individuals seen. 4-40A. nigropunctatus (Bloch and Schneider, 4, 6, 11, 15, 16, 20, 22, 24, 26, 29, Occasional.. 2-351801)32, 34, 36, 38, 39, 43, 45, 52, 56,59, 60, 63, 64, 66A. stellatus (Schneider, 1801) 52 Rare, 1 seen by B. Kahn. 3-58Canthigaster bennetti (Bleeker, 1854) Allen and Randall, 1977 1-10C. compressa (Marion de Procé, 1822) Allen and Randall, 1977 1-20C. coronata (Vaillant and Sauvage, 22 Rare, only 1 seen. 15-401875)C. epilampra (Jenkins, 1903) 5 Rare, only 1 seen. 3-20C. janthinoptera (Bleeker, 1855) Allen and Randall, 1977 9-60C. ocellicincta Allen and Randall, 1977 Allen and Randall, 1977. Sandfly Passage, Florida <strong>Islands</strong> 10-30is type locality.C. papua (Bleeker, 1848) 1, 4, 8, 10, 11, 12, 14, 16, 26, 29, Occasional. 1-3632, 34-40, 45, 54, 56, 61, 64C. valentini (Bleeker, 1853) 1, 18, 22, 32, 54, 56, 66 Occasional. 3-55DIODONTIDAEChilomycterus reticulatus (Linnaeus, 52 Rare, 1 seen by B. Kahn.1758)Diodon hystrix Linnaeus, 1758 22, 24, 61 Rare, only 3 seen. 1-30D. liturosus Shaw, 1804 Leis, 1977156
June 2006TNC Pacifi c Island CountriesReport No 1/06<strong>Solomon</strong> <strong>Islands</strong>GovernmentChapter 4BenthicCommunities<strong>Solomon</strong> <strong>Islands</strong> <strong>Marine</strong> <strong>Assessment</strong>Alec Hughes157
Published by: The Nature Conservancy, Indo-Pacific Resource CentreAuthor Contact Details:Alec Hughes: P.O Box 59, Gizo, Western Province, <strong>Solomon</strong> <strong>Islands</strong>. Phone : +67 7 70899eMail: mastaliu@solomon.com.sbSuggested Citation:Hughes, A. 2006. Benthic Communities. In: Green, A., P. Lokani, W. Atu, P. Ramohia, P.Thomas and J. Almany (eds.) 2006. <strong>Solomon</strong> <strong>Islands</strong> <strong>Marine</strong> <strong>Assessment</strong>: Technical report ofsurvey conducted May 13 to June 17, 2004. TNC Pacific Island Countries Report No. 1/06.© 2006, The Nature ConservancyAll Rights Reserved.Reproduction for any purpose is prohibited without prior permission.Design: Jeanine AlmanyArtwork: Nuovo DesignMaps: Stuart Sheppard & Jeanine AlmanyCover Photo: © David Wachenfeld, Triggerfish ImagesAvailable from:Indo-Pacific Resource CentreThe Nature Conservancy51 Edmondstone StreetSouth Brisbane, QLD 4101AustraliaOr via the worldwide web at: www.conserveonline.org158
Benthic CommunitiesContentsExecutive Summary .........................................................................................................................160Introduction......................................................................................................................................161Methods................................................................................................................................................. 162Survey Techniques .................................................................................................................................164Data Analysis ...........................................................................................................................................165Results .....................................................................................................................................................165Summary of the Major Lifeforms Across Each of the 6 Regions..............................................165Region 1: Florida <strong>Islands</strong>, Russell <strong>Islands</strong>, Savo Island and Guadalcanal Island................. 166Region 2: Isabel Island and Arnavon <strong>Islands</strong>.................................................................................168Region 3: Choiseul Island and Shortland <strong>Islands</strong>......................................................................... 169Region 4: Vella Lavella Island, Gizo Island, New Georgia Island and Marovo Lagoon.... 171Region 5: Makira Island, Three Sister <strong>Islands</strong> and Uki Ni Masi <strong>Islands</strong>...............................172Region 6: Malaita Island ......................................................................................................................174Discussion .............................................................................................................................................175General Country Trend for Coral Cover ........................................................................................ 175Habitat Trends ....................................................................................................................................... 175Substrate Composition Within the Archipelago...........................................................................176References ............................................................................................................................................180Appendices .............................................................................................................................................181159
<strong>Solomon</strong> <strong>Islands</strong> <strong>Marine</strong> <strong>Assessment</strong> Technical ReportExecutive SummaryCoral reefs are a key part of the ecological system that supports vitally important foodsupplies and resources for economic activities. Little scientific information has so far beenavailable on the status of <strong>Solomon</strong> <strong>Islands</strong> coral reefs. Apart from a British Society fundedexpedition back in the 1960s, no systematic surveys of the reefs have been carried out. Thiscomponent of the <strong>Marine</strong> <strong>Assessment</strong> of the <strong>Solomon</strong> <strong>Islands</strong> was aimed at collecting data onthe substrate composition and condition of the coral reefs at 66 sites located within shelteredand exposed habitats around the country.Hard coral cover across <strong>Solomon</strong> <strong>Islands</strong> ranged between 47% and 29%, decreasing fromwest to east. The highest hard coral cover was found in Western, Isabel and ChoiseulProvinces respectively which roughly constitute the western half of the archipelago. Makiraand Malaita had less living coral cover, with Malaita having the highest non-living cover ofthe regions surveyed. Macroalgae cover in general was lower than coral cover at all sites.Coral cover was highest in areas located in clear, well-flushed waters, which were typical ofthose in exposed sites as opposed to those in sheltered sites. As a result, regions which hadmore sites surveyed in exposed areas had higher coral cover.Placing this data alongside information on human population size and density, and proximityto logging operations and urban centres suggests that live coral cover decreases with greaterintensity of human impact and less effective flushing and supply of fresh nutrients from openoceansources. Though this is not surprising, and by itself does not offer anyrecommendations about remedial action, it provides a possible first step towards a sciencebasedapproach to conservation of coral reefs so as to support the food and economic needs ofthe growing population.160
Benthic CommunitiesIntroductionThe <strong>Solomon</strong> <strong>Islands</strong> archipelago comprises 6 major islands, 30 medium size islands andnumerous smaller islands making a total of 922 islands. The 6 main islands (Guadalcanal,New Georgia, Malaita, Isabel, Choiseul and Makira) run in a double chain oriented south eastof Bougainville, Papua New Guinea (Figure 1).Figure 1. Map of the <strong>Solomon</strong> <strong>Islands</strong> <strong>Marine</strong> <strong>Assessment</strong> survey routeThe <strong>Solomon</strong>s are on the interface of the Indo-Australian and Pacific Plates which accountsfor volcanic activity past and present. The islands are the result of past volcanic activities.Morton (1974) describes the living coral reefs of <strong>Solomon</strong> <strong>Islands</strong> as being generallyassociated with uplifted shores and attached either to volcanic coastlines or growing upon theseaward members of successively elevated coral limestone benches. Sulu and others (2000)highlight some of the larger regions of coral reefs found in the country. Such areas are foundwithin:• Shortland <strong>Islands</strong>• Choiseul Island – inside barrier reefs along the northeastern shore• Manning Strait – between Choiseul and Isabel <strong>Islands</strong>, and along the south westernshore of Isabel Island• New Georgia Island Group – Gizo Island through to Vonavona Lagoon• Marovo Lagoon and Vangunu Island (also within the New Georgia Group)• Lau and Langa Langa Lagoon on Malaita Island• Marau Sound on the eastern end of Guadalcanal Island.Coral reef systems however are not limited to these areas and are spread right throughout thearchipelago. The Royal Society produced a report in 1974 on the only extensive survey everdone in the <strong>Solomon</strong> <strong>Islands</strong> in which they surveyed 36 reefs. As a result of this survey,Morton (1974) distinguished the reefs of the <strong>Solomon</strong> <strong>Islands</strong> as belonging to four distinct161
<strong>Solomon</strong> <strong>Islands</strong> <strong>Marine</strong> <strong>Assessment</strong> Technical Reportclasses with reference primarily to their sheltered/exposure characteristics. Below are thefollowing classes:• Broad fringing reefs in sheltered embayments• Sheltered reefs in land enclosed waters• Narrow fringing reefs of north-facing or leeward coasts• Reefs of exposed (south facing) weather coasts.Since then no other surveys of this magnitude have been carried out. <strong>Solomon</strong> <strong>Islands</strong> as anation has grown significantly over the last thirty years with an annual population growth rateof 2.8 percent (Otter, 2002). With the growing population has come steadily increasingpressure on its resource both on land and sea. It is of vital importance to the country that theseresources are effectively managed and monitored to ensure that they can continue to supportthe population in years to come.Coral reefs are an essential component of the ecological system that supports food fisheriesand commercial fishing in the lagoons and nearshore and offshore waters of <strong>Solomon</strong><strong>Islands</strong>.The aim of this report is provide an analysis of the substrate composition and presentcondition of coral reefs throughout the main part of the <strong>Solomon</strong> <strong>Islands</strong> archipelago, as aninput towider studies on resource management..Data presented here should be treated as a general overview of the substrate composition of<strong>Solomon</strong> <strong>Islands</strong> only. In order to assess local impacts, more detailed and site specific surveyswill need to be done in the area of interest.MethodsA total of 66 sites were surveyed during the <strong>Solomon</strong> <strong>Islands</strong> <strong>Marine</strong> <strong>Assessment</strong> over a 4week period (Figure 2). These sites were distributed throughout the archipelago from west toeast. For the purpose of data comparison the survey area was split into 6 regions (Figure 3).These regions were established according to the timing of the survey. For example Region 2was the second lot of sites that were surveyed, Region 3 was the third and so forth. The onlyexception lies with Region 1 which had sites surveyed at the start, in the middle, and at theend of the assessment period.162
Benthic CommunitiesFigure 2. Map of the <strong>Solomon</strong> <strong>Islands</strong> showing the survey sites.163
<strong>Solomon</strong> <strong>Islands</strong> <strong>Marine</strong> <strong>Assessment</strong> Technical ReportFigure 3. Map of <strong>Solomon</strong> <strong>Islands</strong> showing the different regions surveyed.Sites were generally of two habitat types, exposed or sheltered. Sheltered sites were identifiedas being within a protected system such as a lagoon or leeward side of an island/reef withrelatively low wave energy. Such reefs tended to be behind barrier reefs or tucked inside abay. Exposed sites were those with high wave energy and generally were on outer slopes ofbarrier reefs and fringing reefs on the windward side of islands/reefs. Efforts were made tosurvey both habitat types on each day, preferably with the exposed and sheltered habitats inclose proximity to each other. This provided a general overview of both habitat types in eachregion. Where this was not possible, efforts were made to survey one habitat type, whicheverof these the reef topography allowed.SURVEY TECHNIQUESFive 50m transects were laid at a depth profile of 8-10m for each site. Data was collected atthree points at every 2m interval, for a total of 25 intervals on each transect. At each interval,two points were taken 1m on either side of the transect tape and the third directly below thetape. This resulted in a total of 75 points for each transect, and a total of 375 points for eachsite.Corals and other substrate forms were recorded at the growth form level consistent with thecategories used by the Australian Institute of <strong>Marine</strong> Science (AIMS) survey manual (Englishet al, 1997; Appendix 1). For ease of presentation these were further grouped into 4 supercategories: Corals, Macroalgae, Non-living and Others (Appendix 1).Data sheets were pre-printed on underwater paper and attached to plastic slates via bull dogclips and rubber bands. On average there were two 90 minute dives per day. At the end ofeach dive, data was entered into Microsoft Excel.164
Benthic CommunitiesDATA ANALYSISData analysis was carried out using Microsoft Excel to investigate trends in substrate coveracross the 66 sites. This was done in the following manner:Major LifeformsLarge scale: Summary of the 4 major categories between each of the 6 regions.Small scale: Summary of the 4 major lifeforms within each region site by siteCoral LifeformsLarge scale: A summary of coral lifeforms between each of the 6 regionsSmall scale: Summary of coral lifeforms within each region site by site and finally acomparison of the different coral lifeforms which were dominant within each of the differenthabitant types.ResultsSUMMARY OF THE MAJOR LIFEFORMS ACROSS EACH OF THE 6 REGIONS60.0050.0040.0030.0020.0010.000.00Region 1 Region 2 Region 3 Region 4 Region 5 Region 6Coral 32.86 40.44 39.70 47.49 29.36 31.56M-algae 23.86 21.90 21.47 16.47 31.44 22.00N-living 34.42 29.21 28.14 21.77 32.92 45.69Others 8.48 8.20 10.15 14.50 6.15 10.74Coral M-algae N-living OthersFigure 4. Overall trends of the four major lifeforms of the six regions.Coral CoverOverall coral cover was highest amongst the 6 regions in Region 4 followed by Regions 2 and3 with similar cover, 40.44 % ± 5.61 and 39.70 % ± 4.21 (Figure 4). Region 5 had the lowestcover 29.36 % ± 4.21. Except for Region 1, all the other regions had higher coral cover inexposed locations (Figure 5).165
<strong>Solomon</strong> <strong>Islands</strong> <strong>Marine</strong> <strong>Assessment</strong> Technical ReportMacroalgae CoverMacroalgae cover was highest in Region 5 with an average of 31.44 % ± 2.68 (Figure 4).Macroalgal cover remains relatively constant between the other regions except for Region 4which has the lowest average 16.47% ± 3.87. Within most of the regions there was a highercoverage of this lifeform in exposed areas (Figure 5).Non-living CoverRegion 6 has the highest non-living cover 45.69% ± 6.23. Relatively similar coverage wasencountered in the other regions, whilst Region 4 had the lowest cover 21.77% ± 8.51 (Figure4). Sheltered sites had more nonliving substrate than exposed sites (Figure 5).OthersHighest others lifeform was recorded in Region 4 with a mean of 14.50 ± 5.72. Averagesranged between 8.48 – 10.15 % for the other regions except for Region 5 which had thelowest 6.15% ± 1.21 (Figure 4). Those in lifeforms in this category were encountered morefrequently in sheltered habitats (Figure 5).605040Percentage3020100Sheltered Exposed Sheltered Exposed Sheltered Exposed Sheltered Exposed Sheltered Exposed Sheltered ExposedRegion 1 Region 2 Region 3 Region 4 Region 5 Region 6Coral 33.69 32.34 39.23 42.05 31.92 47.48 37.18 52.65 24.36 34.36 25.59 37.54M-algae 23.64 24.04 16.94 28.5 31.92 27.69 15.04 17.18 30.77 32.12 12.72 31.28N-living 28.51 38.11 36.37 19.66 15.26 14.02 26.75 19.27 36.86 28.97 49.23 42.15Others 13.23 5.51 6.53 10.43 42.26 10.56 21.03 11.24 7.76 4.55 12.46 9.03Coral M-algae N-living OthersFigure 5. A mean representation of the substrate composition within the two habitat types of the 6geographical regions visited during the survey.REGION 1: FLORIDA ISLANDS, RUSSELL ISLANDS, SAVO ISLAND AND GUADALCANAL ISLANDA total of 13 sites were surveyed throughout this region, which is located roughly in thecentre of the main archipelago (Figure 3). Of these 13 sites, 5 were in sheltered habitats andthe remaining 8 were in exposed habitats (Figure 6).166
Benthic Communities120%100%Percentage cover80%60%40%20%0%TulagiSwitzerKombuanaLisamataMbutalaAlokanMbanikaHonoaWainipareoNughiGhavutuSavoTambeaBonegiSheltered Exposed Exposed Sheltered Exposed Sheltered Exposed Sheltered Exposed Sheltered Exposed Exposed ExposedFlorida<strong>Islands</strong>Florida<strong>Islands</strong>Russell<strong>Islands</strong>Russell<strong>Islands</strong>Russell<strong>Islands</strong>Russell<strong>Islands</strong>Guadal -canalGuadal -canalFlorida<strong>Islands</strong>Florida<strong>Islands</strong>SavoIslandGuadal -canalGuadal -canalSitesFigure 6. Substrate composition of sites in Region 1.Region 1: CoralCoral M-algae N-living OthersCoral cover was variable for the sites surveyed with an average of 32.86% ± 4.57 cover forthe 13 sites (Figure 4). Lowest coral cover was recorded in Tulaghi Switzer Island (10.26%)while Ghavutu recorded the highest cover (57.8%) (Figure 6). Coral cover was very similarbetween the exposed, 32.34% and sheltered 33.69% habitats (Figure 5).Within exposed sites ACB and CM registered higher values, 7.38% ± 3.73 and 8.38% ± 2.61respectively, than the rest of the lifeforms. Kombuana had the highest values of ACB, 29.23%± 10.97, however this was not consistent. Lisamata had the highest values for CM, 22.56% ±2.91 (Appendix 2, A)In sheltered sites CB and CM had similar values of 10.56% ± 4.09 each which were thehighest for sites in this habitat type. Out of the 5 sheltered sites Wainipareo (22.32% ± 2.31)and Mbutata (21.28% ± 1.98) had the highest values for CB. While the high reading for CMwas due to the a high cover at Ghavutu (24.62% ± 2.76) followed by Mbutata (13.59% ±1.97) (Appendix 2, B)Region 1: MacroalgaeThroughout the 13 sites, macroalgae dominated 23.86% ± 3.8 of benthic cover (Figure 4).Highest cover was recorded at Honoa (42.82%) on Guadalcanal while moderately mediumcover were recorded elsewhere in the region (20-40%) except for Ghavutu in the Florida<strong>Islands</strong> which had the lowest cover of the region (3.08%) (Figure 6). Exposed habitats hadsimilar macroalgae cover (24.04%) to sheltered sites (23.64%) (Figure 5).167
<strong>Solomon</strong> <strong>Islands</strong> <strong>Marine</strong> <strong>Assessment</strong> Technical ReportRegion 1: Non-livingNon-living cover was variable amongst the sites and amounted to 34.42% ± 5.9 of thesubstrate (Figure 4). Bonegi, on Guadalcanal had the highest recording (88.46%) andLisamata in the Russell <strong>Islands</strong> had the least (8.21%) (Figure 6). Exposed habitats recordedmore non-living data (38.11%) than sheltered habitats (28.51%) (Figure 5).Region 1: OthersAverage reading for other lifeforms was 8.48% ± 2.65 (Figure 4). Highest cover was atMbanika, Russell <strong>Islands</strong> (40.77%), while lowest cover was at Bonegi (0.51%), Guadalcanal.All other sites recorded similar coverage (2-12%) (Figure 6). Coverage was lower in exposedsites (5.51%) compared to sheltered sites (13.23%) (Figure 5).REGION 2: ISABEL ISLAND AND ARNAVON ISLANDSA total of 14 sites were surveyed within this region, 6 of which were exposed habitat and 8sheltered habitat (Figure 7).120%100%Percentage cover80%60%40%20%0%BualaTirahiTanabafeBabaoSaraoPalunuhukuraMatavaghiRapitaKaleVakaoSibau IsMalakobiTumaKerehikapaExposed Sheltered Exposed Sheltered Exposed ShelteredShelteredSheltered Exposed Sheltered Exposed Sheltered Exposed ShelteredIsabel Isabel Isabel Isabel Isabel Isabel Isabel Isabel Isabel Isabel Isabel Isabel Arnavon<strong>Islands</strong>SitesFigure 7. Substrate composition for Region 2.Region 2: CoralCoral M-algae N-living OthersCoral cover was relatively constant for 9 sites and was approximately 40.44% ± 5.61 (Figure4). Tanabafe had the highest reading (54.36%) followed closely by Tuma (51.4%), with thelowest reading taken at Sibau (16.67%) (Figure 7). Higher coral cover occurred on exposedsites (42.05%) compared to sheltered sites (39.23%) (Figure 5).Arnavon<strong>Islands</strong>168
Benthic CommunitiesCM (7.89% ± 3.51), ACB (6.97% ± 5.06) and CE (5.73% ± 3.59) had higher values for thisregion however this was not representative of all sites in the region. There was a very highcover of ACB (32.05% ± 2.5) at Buala however the other five exposed sites had less than 5%cover. Tuma had the highest CE cover out of the exposed sites (22.05% ± 2.76). Tanabafehad consistent high CM cover (20.51% ± 0.26) followed by Kale (16.15% ± 4.95)(Appendix 2, C).Sheltered sites in Region 2 had average consistent cover of CM (9.31% ± 0.33), CB (7.05%± 0.29) and CF (7.03 ± 0.31). Tirahi had the highest CM cover (18.59% ± 4.97), Vakaosecond (17.68% ± 4.58) and Babao (14.36% ± 2.48). CB cover was highest at Kerehikapa(14.62% ± 5.93), Malakobi (12.05% ± 3.41) and Rapita (11.03% ± 4.74) (Appendix 2, D).Region 2: MacroalgaeAlgae cover was variable throughout the sites and accounted for 21.90% ± 3.72 of thesubstrate surveyed (Figure 4). Sibau recorded the highest abundance (58.97%) while Rapitahad the lowest (0.26%) (Figure 7). There were a lot more macroalgae on exposed sites(28.50%) than sheltered sites (16.94%) (Figure 5).Region 2: Non-livingNon-living cover represented 29.21% ± 5.69 of the total substrate cover surveyed in Region 2(Figure 4). Rapita had the highest cover (62.8%), while Tuma had the lowest (5.13%) (Figure7). Sheltered sites had higher non-living coverage (36.37%) compared to exposed sites(19.66%) (Figure 7).Region 2: OthersOthers accounted for 8.20% ± 2.35 of total substrate (Figure 4). Kale on Isabel had thehighest cover (20.51%) while Kerehikapa in the Arnavon <strong>Islands</strong> had the lowest cover(2.31%). Most other sites had less than 10% cover (Figure 7). Higher readings were recordedon sheltered sites (10.43%) as opposed to exposed sites (6.53%) (Figure 5).REGION 3: CHOISEUL ISLAND AND SHORTLAND ISLANDSTwelve sites were surveyed within the Region with 8 of these on Choiseul and the remaining4 within the Shortland <strong>Islands</strong>. Of the 12 sites, 6 were exposed habitats and the other sixsheltered habitats (Figure 8).169
<strong>Solomon</strong> <strong>Islands</strong> <strong>Marine</strong> <strong>Assessment</strong> Technical Report120%100%Percentage cover80%60%40%20%0%RaveraveOndolouBoe BoePoroTaro IsPutuputurauSirovangaVurangoRohae 1Rohae 2OnuaFaisaExposed Sheltered Sheltered Exposed Exposed Sheltered Exposed Sheltered Exposed Sheltered Exposed ShelteredChoiseul Choiseul Choiseul Choiseul Choiseul Choiseul Choiseul Choiseul Shortland<strong>Islands</strong>Shortland<strong>Islands</strong>Shortland<strong>Islands</strong>Shortland<strong>Islands</strong>SitesFigure 8. Substrate composition in Region 3.Coral M-algae N-living OthersRegion 3: CoralCoral cover was inconsistent and amounted to 39.7% ± 4.21 of the area surveyed (Figure 4).Of these Sirovanga had the highest cover (68.97%), and Faisi had the lowest (19.49%)(Figure 8). Exposed habitats exhibited higher abundance of coral cover (47.48%), while thecoral cover in sheltered habitats was less (31.92%) (Figure 5).Coral lifeforms with high cover throughout exposed areas of the region were ACE (8.68% ±0.52), CE (8.57% ± 0.41), CS (7.31% ± 0.52) and CM (7.12% ± 0.32). ACE was highest inSirovanga (26.92% ± 2.56). Poro (18.97% ± 2.67) had the most CE occurrence. Raverave(26.41% ± 3.36) had exceptionally high CS cover compared to the other five exposed sites(Appendix 2, E).Average cover of coral types within the sheltered areas were dominated by CM (7.65% ±0.35), CE (5.85% ± 0.40) and ACB (4.96% ± 0.43). There was a consistent CM cover at allsites but Rohae 2 (14.36% ± 2.45) had the highest cover. Boe Boe (14.62% ± 2.21) had goodCE cover followed by Ondolou (11.28% ± 2.93) (Appendix 2, F).Region 3: MacroalgaeVariable algal cover occurred throughout the 12 sites averaging at 21.47% ± 4.21(Figure 4).Highest cover occurred at the exposed Rohae 1 (38.72%) while lower cover occurred at thesheltered site at Taro Island (8.46%) (Figure 8). Exposed sites (27.69%) in general had higheralgal occurrences than sheltered sites (15.26%) (Figure 5).Region 3: Non-livingNon-living cover accounted for 28.14% ± 4.18 of the total substrate composition (Figure 4).Faisi had the most abundant non-living cover (56.14%) while Poro had the lowest cover170
Benthic Communities(3.08%) (Figure 8). Higher occurrences of non-living cover were noted in sheltered sites(42.26%) as compared to exposed sites (14.02%) (Figure 5).Region 3: OthersThis category made up a small percentage of the substrate and had a fairly even distributionthroughout the sites averaging at 10.15% ± 2.32 (Figure 4). Onua accounted for the highestreading (18.21%) while Rohae 1 had the least (1.79%) (Figure 8). There were slightly moreoccurrences on the Sheltered sites (10.56%) than the sheltered sites (9.74%) (Figure 5).REGION 4: VELLA LAVELLA ISLAND, GIZO ISLAND, NEW GEORGIA ISLAND AND MAROVO LAGOONA total of 9 sites were surveyed within this region. Of the 9 sites, 3 were sheltered and 6 wereexposed sites (Figure 9).140%120%100%Percentage cover80%60%40%20%0%Vella Lavella Njari Munda Haipe Veru Landoro Lumalihe Toatelave MbiliExposed Exposed Sheltered Exposed Exposed Exposed Sheltered Exposed ShelteredVella Lavella Gizo Munda Munda Marovo Marovo Marovo Marovo MarovoSitesFigure 9. Substrate composition of Region 4.Region 4: CoralCoral M-algae N-living OthersCoral cover accounted for 47.49% ± 7.58 of the survey area (Figure 4). Haipe which is aplatform reef, had the highest cover (66.92%) with the lowest cover recorded on the shelteredsite at Munda (23.85%) (Figure 9). Exposed sites had more cover (52.65%) compared tosheltered sites (37.18%) (Figure 5).Within the exposed sites the most common coral type was the CM (19.72% ± 0.39). All othercoral types had less than 10% cover. Toatelave (27.60% ± 4.36) had the highest occurrencefollowed by Landoro (25.64% ± 4.88). Though it wasn’t significant for the region there was ahigh cover of ACT at Haipe (17.95% ± 2.26) (Appendix 2, G).171
<strong>Solomon</strong> <strong>Islands</strong> <strong>Marine</strong> <strong>Assessment</strong> Technical ReportCM (19.19 ± 0.10) was the dominant lifeform within the sheltered regions. CTU (7.52 ± 0.51)was second, the rest of the coral types registered less than 2% cover each. All three shelteredsites had consistent CM cover. Lumalihe (24.62% ± 2.12) had the highest followed by Mbilli(19.74% ± 1.93) and Munda (13.21% ± 2.04). A high occurrence of CTU was found inLumalihe (22.56% ± 4.01) (Appendix 2, H).Region 4: MacroalgaeMacroalgae covered 16.47% ± 3.87 of area surveyed (Figure 4). Munda had the highest cover(24.36%) followed closely by Veru Pt (23.85%) and lowest cover was at Lumalihe passage(7.69%) (Figure 9). Exposed and sheltered sites had 17.18% and 15.04% cover respectively(Figure 5).Region 4: Non-livingNon-living cover had a mean of 21.77% ± 8.51 and was variable among the sites (Figure 4).Mbili passage had the most cover (33.59%) while Veru had the lowest (3.33%) (Figure 9).The non-living cover for sheltered and exposed sites was also variable with sheltered sitesrecorded a mean cover of 26.75% and exposed sites with 19.27% respectively (Figure 5).Region 4: OthersAn average of 14.50% ± 5.72 cover was recorded. Of this the highest was recorded for MundaBar (29.49%) and the lowest for Landoro (2.56%) (Figure 9). Sheltered sites had higheroccurrences (21.03%) while exposed sites (11.24%) (Figure 5).REGION 5: MAKIRA ISLAND, THREE SISTER ISLANDS AND UKI NI MASI ISLANDSThis is the far most region surveyed. A total of 8 sites were surveyed, 4 in sheltered areas and4 in exposed area (Figure 10).172
Benthic Communities120%100%80%Percentage cover60%40%20%0%Haurmanu Marautewa Naone Na Mugha Malaupaina 1 Malaupaina 2 Pio PawaExposed Sheltered Exposed Sheltered Exposed Sheltered Exposed ShelteredMakira Makira Makira Makira Three Sisters<strong>Islands</strong>SitesThree Sisters<strong>Islands</strong>Uki Ni MasiIslandUki Ni MasiIslandFigure 10. Substrate composition for Region 5Region 5: CoralCoral M-algae N-living OthersCoral lifeforms made up 29.36% ± 3.67 of the surveyed sites (Figure 4). Pio had the highestcover (56.41%) and Haurimanu had the least (13.33%) (Figure 10). Exposed sites had highercover (34.36%) than sheltered sites (24.36%) (Figure 5).Of the four exposed sites in the region the most common were CM (7.82% ± 0.51), ACT(6.54% ± 0.53), ACS (5.64% ± 0.56) and ACB (5.51% ± 0.43). CM was most abundant in Pio(13.14% ± 0.47). Similar values were recorded for ACT in Pio (10.51% ± 0.38) and Naone(10.26% ± 0.47). For ACS, Pio (10.26% ± 0.51) again had the highest cover with Malaupaina1 (9.49% ± 0.61) having the second highest which also had the highest ACB cover (8.97% ±0.74) (Appendix 2, I).Sheltered sites were dominated by CM (6.32% ± 0.61) which was highest in Marautewa(8.46% ± 0.59) . Though not significant for the region, Marautewa also had significantly moreCB (8.46% ± 0.59) cover than the other sites (Appendix 2, J).Region 5: MacroalgaeMacroalgae accounted for 31.44% ± 5.56 of area surveyed (Figure 4). Highest cover occurredon Marautewa Island (50.51%) while Ugi had the lowest cover (16.15%) (Figure 10).Exposed sites had more cover (32.12%) than sheltered sites (30.77%) (Figure 10).Region 5: Non-livingThere were more non-living benthic structures on the reefs around Makira province than otherstructures with an average of 32.92% ± 6.08 cover (Figure 4). Ugi had the highest cover(45.13%) of the surveyed sites while Marautewa Island had the lowest (14.62%) (Figure 10).Sheltered sites had more cover (36.86%) than exposed sites (28.97%) (Figure 5).173
<strong>Solomon</strong> <strong>Islands</strong> <strong>Marine</strong> <strong>Assessment</strong> Technical ReportRegion 5: OthersThese benthic structures made up 6.15% ± 1.21 of the substrate area surveyed (Figure 4).Three Sisters group of islands had the highest percentage cover (15.38%) while Haurimanuhad the least (1.28%) (Figure 10). Sheltered sites had more cover (7.76%) than exposed sites(4.55%) (Figure 5).REGION 6: MALAITA ISLANDThe most populated region located in the north eastern corner of the country. A total of 10sites were surveyed with 5 in sheltered areas and 5 in exposed areas (Figure 11).140%120%100%Percentage cover80%60%40%20%`0%Airasi Maroria Arai Anuta Leli 1 Leli 2 Suafa 1 Suafa 2 Falaubulu 1 Falaubulu 2Sheltered Exposed Sheltered Exposed Exposed Sheltered Exposed Sheltered Exposed ShelteredMalaita Malaita Malaita Malaita Malaita Malaita Malaita Malaita Malaita MalaitaSitesFigure 11. Substrate composition in Region 6.Region 6: CoralCoral M-algae N-living OthersMalaita had some of the lowest coral covers recorded during the survey with a consistentcover of 31.56% ± 4.25 (Figure 4). Toi was an exception with very high coral cover (73.33%)whilst Falaubulu 2 had the lowest cover (11.79%) (Figure 11). Exposed sites had more cover(37.54%) compared to sheltered sites (25.59%) (Figure 5).Throughout the exposed sites CM (9.08% ± 0.41) and CE (5.08% ± 0.34) were the dominantlifeforms. Anuta (14.10% ± 0.54) had highest CM cover followed by Falaubulu 1 (11.28% ±0.36) and Suafa 1 (10.77% ± 0.48). Suafa 1 also had the highest CE (10.26% ± 0.34) and CS(8.97% ± 0.39) cover (Appendix 2, K).CM (12% ± 0.46) was again the dominant form in the sheltered sites. The highest cover wasat Arai (17.44 ± 0.49), Suafa 2 (14.87% ± 0.52) and Falaubulu (14.10% ± 0.23) (Appendix 2,L).174
Benthic CommunitiesRegion 6: MacroalgaeMacroalgae accounted for 22.00% ± 3.85 of sites surveyed (Figure 4). Highest cover occurredfor Leli 1 (36.67%) while Suafa 2 had the lowest cover (5.38%). Two sites, Airasi andFalaubulu Island had no macroalgae recorded (Figure 11). Macroalgae were found to beabundant at exposed sites (31.28%) than in sheltered sites (12.72%) (Figure 5).Region 6: Non-livingNon-living benthic structures accounted for 45.69% ± 6.23 of the total substrate coversurveyed for the reefs in this region (Figure 4). Falaubulu 2 had the most non-living surfacearea (80.51%) while Maroria had the least (22.82%) (Figure 11). Sheltered sites had morenon-living cover (49.23%) than exposed sites (42.15%) (Figure 5).Region 6: OthersThese benthic structures accounted for 10.74% ± 2.87 of the substrate (Figure 4). Arai had thehighest cover (22.05%) while Leli 1 the lowest (3.33%) (Figure 11). Sheltered sites hadhigher percentage cover (12.46%) than exposed site (9.03%) (Figure 5).DiscussionGENERAL COUNTRY TREND FOR CORAL COVERThe average coral cover for the <strong>Solomon</strong> <strong>Islands</strong> ranges between 29.4% and- 47.5% with ageneral trend of decreasing hard coral cover as the focus shifts from the western half to theeastern half of the archipelago. This decreasing coral cover is most likely linked to the changein topography of sites selected in the western and eastern ends of the country. The structureand composition of a coral reef in species and growth forms, results – as is well known –primarily from its place on a spectrum of relative exposure to waves and surge. As well as byexposure, reef structure and composition will be greatly influenced by the considerable effectsof freshwater run-off and sediments from the land, greatest in volcanic islands withconsiderable watershed area and streams of significant size and smallest in low-pitched sandcays, often with fringing reefs of very great extent (Morton, 1974).HABITAT TRENDSSites located in exposed habitats had higher coral cover than those in sheltered sites, whichmay be attributed to the location of the sites. There is a higher tendency for reefs located inlagoons and near large land masses to be periodically affected by extreme weather eventsresulting in masses of freshwater and sediments flowing over and damaging coral reefs(Wilkinson, 1999). Those located in exposed areas tend to experience higher wave energy andstronger currents and are thus better at flushing out sediments and have clearer waters. Thismay help to explain why certain regions which had more sites surveyed in exposed sites (dueto logistical regions) had higher coral cover. For example, caution must be exercised whenviewing the trends for Region 4, as some trends may not be true representations of thehabitats found within that region.Overall the most dominant coral type found within sheltered and exposed habitats of all sixregions was the coral massive (CM) represented by species within the Faviddae175
<strong>Solomon</strong> <strong>Islands</strong> <strong>Marine</strong> <strong>Assessment</strong> Technical ReportFamily(Favites, Goniastrea and Cyphastrea) and Family Mussidae (Lobophyllia andSymphyllia).On their own, the various different lifeforms of the Family Acroporidae which stood outamongst the regions were the branching, encrusting, digitate and tabulate forms. Acroporaspecies were visibly more abundant within exposed habitats than in sheltered habitats. Whenthe different Acropora lifeforms cover were accumulated it showed a significant presence ofthe Family Acropora as a whole, especially within the exposed habitats.In areas such as Region 6 the low presence of Acropora could possibly be due to therelatively high human activities taking place on the reefs such as the intense harvesting ofAcropora branching species for the very popular betel nut trade, especially in such denselypopulated region such as Malaita.SUBSTRATE COMPOSITION WITHIN THE ARCHIPELAGOCentral <strong>Solomon</strong>s: Region 1 (Central and Guadalcanal Province)In 1999 Central province had a population of 21, 577 with a population density of 35 peopleper km 2 , while Guadalcanal had a population of 60, 275 with a population density of 11people per km 2 (<strong>Solomon</strong> <strong>Islands</strong> Government, 2000).Guadalcanal Island is much bigger than the islands of Central Province combined. Its coralreef area is made up of intermittent narrow fringing reefs. The mountainous ridges ofGuadalcanal have rivers that drain out onto the northern and southern sides of the island.Marau Sound lagoon differs from the rest of the province as it is studded with dozens of smallislands and sand cays surrounded by intact coral reefs with healthy coral cover. CentralProvince is made up of the Savo, Russell and Florida islands. Unlike the mountainous islandof Guadalcanal these smaller islands, except for Savo , are surrounded by fringing reefs andhave patch reef networks within their small lagoons.Coral CoverThe overall low coral cover within Region 1 does not represent the level of cover found ineach of the two provinces. The low, and at times, almost non existent coral cover on thenorthern coast of Guadalcanal is characteristic of reefs which are situated close to riversystems. The presence of rivers along the coastline will tend to limit coral populationsdistribution especially “in times of extreme weather events resulting in freshwater andsediments flowing over and damaging the coral reefs (Wilkinson, 1999)”. There exists arelatively large river known as Bonegi river, which is a popular weekend hangout forresidents of the nearby national capital, Honiara. The freshwater influx from the river wouldbe a contributing factor to the low coral cover in that area. Overfishing of marine resources inorder to supply the increasing population of the capital, Honiara, has placed further pressureon the reef health along the Guadalcanal coastline. The exception here is that of Wainipareo,located in the sheltered but well flushed waters of Marau Lagoon, which had the highest coverin the province.The use of dynamite to catch fish has been a problem within the Florida <strong>Islands</strong> (Sulu,unpublished, 2001). Dynamite fishing is preferred by fishermen who are skilled in locatingschools of fish due to its high profitability , but it is an indiscriminate form of fishing whichcan kill non commercial species and corals (Alcala and Gomez, 1987). In areas such as theTulaghi Switzer Island, dynamite fishing has destroyed the reef resulting in the low coralcover and a higher occurrence of non living substrate. Apart from this, the majority of176
Benthic Communitiesexposed sites were located on fringing reefs on the outskirts of the province located awayfrom any major anthropogenic influences in areas exposed to high water movement, clarityand thus higher coral cover than Guadalcanal province.Macro Algae CoverThe absence or low presence of competition from corals and predation by herbivorouspredators can result in increased algal biomass on coral reefs (Sammarco, 1982; Jompa andMcCook, 2002). The high algal cover at Honoa, which is typical of the exposed coastline ofGuadalcanal, could be a direct sign of overfishing in order to supply the high demand for reeffish in Honiara. In the sheltered areas of the Central Province the levels maybe due to theincrease in suspended nutrients linked to freshwater runoff which affect coral photosynthesisand increase algal production. Several sites in Central Province had rates of algae cover thatwere as high or higher than coral cover indicating overfishing. One exception exists atGavutu, where there is a very low algal cover while there is a high coral cover. It is possiblethat this site is hasn’t been overfished and there is a strong coral recruitment to the area withhealthy herbivorous population keeping the algal cover down. Apart from this, the levels ofalgae on the reefs in the region were in proportion to the level of coral cover.Non Living CoverThe high non living cover is expected of an area exposed to dynamite fishing, such as theTulagi Switzer island site. The remaining sheltered sites in the province had levels of nonliving cover relative to coral abundance. Exposed sites, especially on the Guadalcanal Islandand Savo Island, were high in non living cover possibly due to the constant pounding fromwaves during heavy seas.Western <strong>Solomon</strong>s: Regions 2, 3 and 4 (Isabel, Choiseul and Western Provinces)Coral reefs are found throughout most of the coastlines of the three provinces within the threeregions. Isabel Province (Region 2) is the longest island in the country and has fringing reefshugging it’s coastline on both the northern and southern end. Population density in 1999 wasabout 5 person per square kilometre, similar to Choiseul Province in Region 3 (<strong>Solomon</strong><strong>Islands</strong> Government, 2000). Due to the topography of the area, the north eastern end of Isabeland the south western end of Choiseul have a high level of coral reef area which continuesalong the northern end of Choiseul right up around the northern tip. In 1999 Western Province(Region 4) had a higher population density of 8 persons per square kilometre with 87% of thehouseholds consuming fish most of the time (Otter, 2002). Region 4 harbours the largest reefarea of the 3 regions. Stretching from Vella Lavella to Marovo Lagoon it encompasses 3lagoon systems surrounded by fringing reefs and barrier reefs. The lagoons are rich withislands and have patch reefs distributed throughout their system. The province contains twourban centres, Gizo and Noro, and is home to a number of logging operations.Coral CoverChoiseul and Isabel province share various similarities in topography, population density andin this case, coral cover. However when the sites in Shortland <strong>Islands</strong> (Region 3) are includedthe coral cover remains reduces slightly. The lower cover found in sheltered sites locatedcloser to the mainland are most likely a result of experiencing a greater influence from landthrough freshwater influx causing sedimentation and nutrients to be resuspended (Wilkinson,1999).The sites within Region 4 were located mainly in exposed habitats, such as Haipe reef,contributing to the overall high coral cover observed throughout the region. Within Marovo177
<strong>Solomon</strong> <strong>Islands</strong> <strong>Marine</strong> <strong>Assessment</strong> Technical Reportlagoon a site within Mbili passage was the only one situated close to a logging operation.Coral cover here dropped with visible signs of high sedimentation and bleaching levels. Bycontrast Toatelave Island which is located at the entrance to Mbili passage had high coralcover due to the strong incoming and outgoing currents which rapidly disperse sedimentationinto oceanic depths beyond possible resuspension through wave and current action. Lafranchi(1999) reported that logging operations can increase the level of sedimentation causing anincrease in turbidity reducing the level of sunlight that reaches the coral resulting in coraldying.Though in a sheltered area the site in Lumelihe Passage, Marovo lagoon, is located well awayfrom any logging activity and experiences a high water movement through the passage fromcurrents permitting a significantly higher coral cover presence with little sign ofsedimentation. The low cover in Munda is due to the location of the site itself. Its closeproximity to Munda community means that it is a popular spot for line fishing and spearfishing activities. This is also the same area where the tuna fishing boats from the nearby tunacannery in Noro come to collect their baitfish at night..Macro Algae CoverMacro algal cover in general was lower than coral cover throughout region except in thesheltered site on Munda Bar. Heavy fishing pressure from the fishing communities aroundMunda district has affected the coral – algal distribution on the reef. Signs of overgrowth oncertain coral colonies may indicate the lack of herbivores on the reefs which is perfectlypossible considering the numerous small fishery outlets around Munda.Haipe reef is a popular fishing spot for fishermen from Munda and Rendova however theexpected trends of overfishing do not show and macro algae cover is quite low. This maybedue to high recruitment rates of herbivorous species and the very high coral cover whichcurrently persists.Non Living CoverApart from the high levels of non living substrate in Mbili Passage and at Munda due tologging and overfishing the rest of the region had reasonable levels. In Gizo several outbreaksof crown of thorns in the past have affected coral health its surrounding reefs. Theseoutbreaks are still occurring around popular dive spots with increasing frequency, which hasprompted concerns from within the local tourism industry (pers comm. Danny Kennedy).Eastern <strong>Solomon</strong>s: Regions 5 and 6 (Malaita and Makira Province)MALAITAMalaita has the largest population of any island in the country, which when coupled with itshigh population density, means that there will be a substantial impact on the surroundingmarine ecosystems. In the past, dynamite fishing and artificial island construction hasoccurred within Langa Langa lagoon, Lau Lagoon and in the Fanalei/Walende region in SouthMalaita (Sulu et al. 2000). As the population continues to increase the demand for land andfood supply will place further pressure upon the coral reefs.Coral CoverThe population pressure in Malaita has inevitably had a big impact on the surrounding coralreefs, which shows up in the generally low coral cover at the sites. Low coral cover in theFalaubulu area in Langa Langa Lagoon is a result of the removal of corals for artificial island178
Benthic Communitiesconstruction and of dynamite fishing practices. Toi island situated outside of Lau Lagoon withits’ high coral cover is further away from human settlements, and probably has lessanthropogenic interference unlike Suafa, which is in Lau Lagoon.Macro Algae CoverThe similar levels, and sometimes higher levels, of macro algal cover to coral cover indicatean imbalance on the coral reefs around Malaita. This is quite possibly due to overfishing,destruction of coral habitats, sedimentation and nutrient eutrophication allowing for higheralgae growth.Non Living CoverHigh non living cover in Falaubulu is linked to the lack of coral cover through destructivefishing practices and removal of coral for artificial island construction. Airasi is situatedwithin Are Are Lagoon with high level of sedimentation and a substrate comprised of silt. Thesite is prone to heavy sedimentation during rainy periods with a sandy/silty bottom that iseasily stirred up in strong currents. Due to turbidity levels coral cover is restricted and limitedalong the survey depth profile with high levels of non living/abiotic substrate betweenexisting coral lifeforms.MAKIRAThe mountainous ridges of the island drain out towards the northern coastline possiblyprohibiting any major coral growth unlike the southern coastline which is made up of adiscontinuous chain of fringing reefs.In 1999 Makira had a population of 31,006 with apopulation density of 10 per square kilometre.Coral CoverThe generally higher coral cover in the exposed sites reflects better coral growingopportunities than those in sheltered sites except for Marautewa Island Higher Coral cover onthe outer islands, such as Pio Island, in the northern end of Makira are probably a result ofless freshwater run off and sedimentation associated with coastlines of high mountainousislands and lower levels of anthropogenic activities.Macro Algae CoverHigh algal presence in relation to coral possibly indicates the lack of herbivorous predatorsand or nutrient eutrophication or past natural events leading to coral die off and hence algalgrowth.Non Living CoverThis appears to be closely linked areas of low coral cover and high macro algae cover. PioIsland with it’s high coral, and Marautewa Island are the only sites with low non living coverdue perhaps to a more ecologically stable environment and its location which is reasonably farfrom dense human populations.179
<strong>Solomon</strong> <strong>Islands</strong> <strong>Marine</strong> <strong>Assessment</strong> Technical ReportReferencesAlcala, A.C. and E. D. Gomez. 1987. Dynamiting Coral Reefs for Fish: a ResourcedestructiveMethod. in B. Salvat, (Ed.). Human Impacts on Coral Reefs: Facts andRecommendations. Antenne Museum E.P.H.E. Moorea, French Polynesia. 51-60,Jompa, J and McCook, L.J. 2002. Effects of competition and herbivory on interactionsbetween a hard coral and a brown alga. J. Exp. Mar. Bio. Ecol 3835, 1-15Lafranchi, C (1999). <strong>Islands</strong> Adrift? Comparing Industrial and Small Scale Economic Optionsfor Marovo Lagoon Region of the <strong>Solomon</strong> <strong>Islands</strong>. Greenpeace Pacific.Morton, J.E., 1974. The coral reefs of the British <strong>Solomon</strong> <strong>Islands</strong>: A comparative study oftheir composition and ecology. Proc. 2 nd Int. Coral Reef Symp, 2, 31-53.Otter, M (2002). <strong>Solomon</strong> <strong>Islands</strong> Human Development Report 2002. Building a Nation.Volume 1, Main Report.Personal Communication. Danny Kennedy. Dive Gizo. www.divegizo.com.Sammarco, P.W. 1982. Echinoid grazing as a structuring force in coral communities:whole reef manipulations. J. Exp. Mar. Biol. Ecol. 45, 245-272Sulu, R.; Hay, C.; Ramohia, P. and Lam. M. 2000. The Status of <strong>Solomon</strong> <strong>Islands</strong>’ CoralReefs. A Report prepared for the Global Coral Reef Monitoring Network, Townsville,Queensland, AustraliaSulu, R. 2001. Unpublished report. Report on visit to Ngella group for the idenitification andselection of GCRMN monitoring sites.<strong>Solomon</strong> <strong>Islands</strong> Government. Report on the 1999 population and housing census. Basic tableand census description.Wilkinson, C.R. 1999. Global and local threats to coral reef functioning and existence: reviewand predictions. Mar. Freshwater. Res. 50, 867-878180
Benthic CommunitiesAppendicesAppendix 1.CODE LIFEFORM MAJOR CATEGORYACB Acropora Branching CORALACE Acropora Encrusting CORALACD Acropora Digitate CORALACT Acropora Tabular CORALACS Acropora Submassive CORALCB Coral Branching CORALCE Coral Encrusting CORALCF Coral Foliose CORALCM Coral Massive CORALCS Coral Submassive CORALCMR Mushroom Coral CORALCHL Blue Coral CORALCME Fire Coral CORALCTU Organ Pipe Coral CORALDCA Dead Coral with Algae MACROALGAEAA Algal Assemblage MACROALGAECA Coraline Algae MACROALGAEHA Halimeda Algae MACROALGAEMA Macroalgae MACROALGAETA Turf Algae MACROALGAES Sand NON-LIVINGR Rubble NON-LIVINGSI Silt NON-LIVINGDC Dead Coral NON-LIVINGRCK Rock NON-LIVINGSC Soft coral OTHERSSP Sponge OTHERSZO Zoanthids OTHERSOT Others OTHERS181
<strong>Solomon</strong> <strong>Islands</strong> <strong>Marine</strong> <strong>Assessment</strong> Technical ReportAppendix 2.A)REGION 1 EXPOSEDFlorida Guadalcanal Russell <strong>Islands</strong> Savo IslandMean Kombuana Nughi Bonegi Honoa Tambea Alokan Lismata SavoACB 29.23 7.69 0.00 0.00 0.00 17.69 6.67 1.54ACD 4.10 0.00 0.00 2.44 0.00 4.10 3.33 0.77ACE 0.77 0.00 0.00 1.03 0.00 0.00 0.77 2.56ACS 7.69 0.51 0.00 0.77 0.00 8.85 3.85 0.00ACT 3.85 0.00 0.00 0.51 0.00 1.03 4.23 1.28CB 0.26 0.77 0.26 6.92 2.56 1.54 4.36 10.77CE 0.00 0.00 0.00 2.31 2.31 3.08 1.79 8.21CF 2.82 0.00 0.00 0.00 0.51 0.77 4.62 2.31CM 6.41 1.28 0.00 3.08 10.90 10.00 22.56 12.82CME 0.00 0.77 0.00 1.28 0.00 0.00 1.28 0.26CMR 0.00 1.03 0.00 0.26 0.00 0.77 0.26 1.28CS 0.00 0.00 0.26 0.77 0.51 0.51 0.77 2.82CTU 0.00 0.00 0.00 0.00 0.26 0.00 0.00 0.00Florida Guadalcanal Russell <strong>Islands</strong> Savo IslandStd Error Kombuana Nughi Bonegi Honoa Tambea Alokan Lismata SavoACB 10.87 3.32 0.00 0.00 0.00 6.97 1.37 0.94ACD 2.12 0.00 0.00 0.64 0.00 1.03 1.32 0.77ACE 0.51 0.00 0.00 0.66 0.00 0.00 0.51 1.07ACS 4.61 0.51 0.00 0.33 0.00 4.47 1.46 0.00ACT 0.00 0.00 0.00 0.33 0.00 0.48 1.59 0.81CB 0.26 0.77 0.26 4.01 0.81 1.03 0.96 3.50CE 0.00 0.00 0.00 0.72 0.75 1.93 1.12 1.65CF 2.00 0.00 0.00 0.00 0.51 0.77 0.65 1.03CM 2.29 0.81 0.00 0.81 2.73 5.12 2.91 3.11CME 0.00 0.77 0.00 0.81 0.00 0.00 0.70 0.26CMR 0.00 1.03 0.00 0.29 0.00 0.51 0.26 0.57CS 0.00 0.00 0.26 0.55 0.31 0.51 0.51 1.31CTU 0.00 0.00 0.00 0.00 0.26 0.00 0.00 0.00REGION 1 EXPOSED- OVERALLMean Std Dev Std ErrorACB 7.85 10.56 3.73ACD 1.84 1.86 0.66ACE 0.64 0.89 0.31ACS 2.71 3.67 1.30ACT 1.36 1.72 0.61CB 3.43 3.75 1.33CE 2.21 2.71 0.96CF 1.38 1.70 0.60CM 8.38 7.39 2.61CME 0.45 0.58 0.20CMR 0.45 0.51 0.18CS 0.71 0.91 0.32CTU 0.03 0.09 0.03182
Benthic CommunitiesB)REGION 1 SHELTEREDFlorida <strong>Islands</strong>Guadalcanal Russell <strong>Islands</strong>MeanGhavutu Tulaghi Switzer Wainipareo Mbanika MbutataACB 0.77 3.59 4.10 0.26 0.77ACD 0.51 0.51 0.00 0.77 0.26ACE 0.00 0.00 0.26 0.26 0.00ACS 0.51 0.77 0.26 0.00 0.51ACT 1.03 1.54 1.79 0.00 0.51CB 8.46 0.00 22.82 0.26 21.28CE 4.62 0.00 2.05 0.77 2.05CF 4.87 1.79 2.05 0.26 0.51CM 24.62 1.54 3.85 9.23 13.59CME 0.00 0.26 0.00 2.56 0.00CMR 1.54 0.00 1.03 0.00 1.03CS 6.15 0.26 3.08 0.00 3.59Std ErrorFlorida <strong>Islands</strong>Guadalcanal Russell <strong>Islands</strong>Ghavutu Tulaghi Switzer Wainipareo Mbanika MbutataACB 0.77 1.79 2.48 0.26 0.51ACD 0.31 0.51 0.00 0.77 0.26ACE 0.00 0.00 0.26 0.26 0.00ACS 0.51 0.77 0.26 0.00 0.31ACT 0.63 0.48 0.65 0.00 0.51CB 2.28 0.00 2.31 0.26 1.93CE 0.65 0.00 0.65 0.77 1.26CF 1.96 0.77 0.65 0.26 0.51CM 2.76 0.75 1.40 4.43 1.97CME 0.00 0.26 0.00 1.22 0.00CMR 1.03 0.00 0.75 0.00 0.48CS 3.75 0.26 1.32 0.00 2.20REGION 1 SHELTERED- OVERALLMean Std Dev Std ErrorACB 1.90 1.80 0.81ACD 0.41 0.29 0.13ACE 0.10 0.14 0.06ACS 0.41 0.29 0.13ACT 0.97 0.73 0.33CB 10.56 11.04 4.94CE 1.90 1.75 0.78CF 1.90 1.84 0.82CM 10.56 9.15 4.09CME 0.56 1.12 0.50CMR 0.72 0.69 0.31CS 2.62 2.55 1.14183
<strong>Solomon</strong> <strong>Islands</strong> <strong>Marine</strong> <strong>Assessment</strong> Technical ReportC)REGION 2 EXPOSEDArnavonMean<strong>Islands</strong>TumaIsabelBuala Kale Sarao Sibau TanabafeACB 2.56 32.05 0.51 4.62 0.26 1.79ACD 0.00 2.82 4.10 5.64 0.00 10.51ACE 0.00 0.00 3.33 7.69 0.00 5.90ACS 0.00 9.49 1.28 4.10 0.00 6.15ACT 0.26 3.33 0.77 9.62 1.28 5.90CB 11.28 0.00 2.69 2.82 1.03 0.00CE 22.05 0.26 1.03 0.51 9.74 0.77CF 5.64 0.51 1.28 0.26 0.00 1.03CM 0.26 0.26 16.15 7.18 2.99 20.51CME 0.00 0.00 0.00 1.03 0.00 0.26CMR 2.56 1.28 1.28 2.31 0.00 1.03CS 6.92 0.26 0.51 0.51 3.33 0.51Arnavon<strong>Islands</strong> IsabelStd Error Tuma Buala Kale Sarao Sibau TanabafeACB 1.67 2.50 0.51 3.10 0.26 0.77ACD 0.00 0.94 0.75 1.55 0.00 2.20ACE 0.00 0.00 0.65 3.01 0.00 2.21ACS 0.00 2.55 0.81 1.64 0.00 0.94ACT 0.26 1.50 0.51 2.41 0.00 1.44CB 1.64 0.00 0.31 0.85 0.63 0.00CE 2.76 0.26 0.63 0.51 2.61 0.77CF 2.21 0.51 0.81 0.26 0.00 0.63CM 0.26 0.26 4.94 0.51 0.88 1.34CME 0.00 0.00 0.00 1.03 0.00 0.26CMR 0.81 0.57 0.99 1.74 0.00 0.48CS 1.19 0.26 0.51 0.31 0.96 0.51REGION 2 EXPOSED- OVERALLMean Std Dev Std ErrorACB 6.97 12.39 5.06ACD 3.85 3.96 1.62ACE 2.82 3.39 1.38ACS 3.50 3.81 1.56ACT 3.53 3.64 1.48CB 2.97 4.26 1.74CE 5.73 8.79 3.59CF 1.45 2.11 0.86CM 7.89 8.59 3.51CME 0.21 0.41 0.17CMR 1.41 0.93 0.38CS 2.01 2.67 1.09184
Benthic CommunitiesD)REGION 2 SHELTEREDArnavonMean<strong>Islands</strong>KerehikapaIsabelBabao Malakobi Matavaghi Palunuhukura Rapita Tirahi VakaoACB 1.92 9.74 6.15 5.64 1.03 1.79 0.96 1.79ACD 0.00 5.13 0.00 1.54 3.33 1.28 1.60 1.28ACE 0.00 1.28 0.00 5.38 2.82 2.05 1.28 0.51ACS 0.00 3.33 0.00 7.18 7.69 4.17 6.41 3.59ACT 0.00 2.31 0.00 2.18 6.15 0.77 0.32 0.00CB 14.62 0.51 12.05 1.28 4.74 11.03 8.33 3.85CE 5.90 0.26 4.87 0.26 0.51 0.51 0.64 0.51CF 20.77 2.82 0.00 5.77 7.05 5.13 6.73 7.95CM 1.03 14.36 1.54 8.72 5.90 6.67 18.59 17.69CME 0.00 0.26 0.00 0.00 0.26 0.00 0.00 0.51CMR 0.26 0.77 0.51 1.79 1.67 1.03 2.24 0.77CS 2.05 0.26 0.00 0.26 0.00 0.26 0.64 1.03Arnavon<strong>Islands</strong> IsabelStd Error Kerehikapa Babao Malakobi Matavaghi Palunuhukura Rapita Tirahi VakaoACB 0.81 4.56 5.54 1.55 0.48 1.26 0.55 1.50ACD 0.00 1.94 0.00 0.75 1.04 0.57 0.86 0.99ACE 0.00 0.57 0.00 3.57 1.31 0.51 0.47 0.51ACS 0.00 0.87 0.00 3.41 0.91 1.18 0.57 0.94ACT 0.00 0.48 0.00 0.38 4.92 0.77 0.29 0.00CB 5.93 0.51 3.41 0.57 0.94 4.74 1.78 1.15CE 1.93 0.26 1.74 0.26 0.31 0.51 0.57 0.51CF 9.28 1.24 0.00 1.78 3.65 3.07 1.27 2.08CM 0.48 2.48 0.63 1.24 1.93 1.83 4.97 4.58CME 0.00 0.26 0.00 0.00 0.26 0.00 0.00 0.51CMR 0.26 0.31 0.31 0.51 1.24 0.48 0.72 0.51CS 1.44 0.26 0.00 0.26 0.00 0.26 0.57 0.75REGION 2 SHELTERED- OVERALLMean Std Dev Std ErrorACB 6.97 12.39 0.44ACD 3.85 3.96 0.25ACE 2.82 3.39 0.23ACS 3.50 3.81 0.24ACT 3.53 3.64 0.24CB 2.97 4.26 0.26CE 5.73 8.79 0.37CF 1.45 2.11 0.18CM 7.89 8.59 0.37CME 0.21 0.41 0.08CMR 1.41 0.93 0.12CS 2.01 2.67 0.2185
<strong>Solomon</strong> <strong>Islands</strong> <strong>Marine</strong> <strong>Assessment</strong> Technical ReportE)REGION 3 EXPOSEDChoiseulShortland <strong>Islands</strong>MeanPoro Raverave Sirovanga Taro Onua Rohae1ACB 1.28 0.77 3.59 2.31 0.00 1.28ACD 2.31 4.62 4.36 3.85 3.33 8.97ACE 9.74 0.00 26.92 4.62 0.77 10.00ACS 2.82 0.00 13.85 6.41 2.31 6.15ACT 1.79 1.03 9.74 4.36 5.45 1.54CB 0.00 0.77 0.26 0.00 0.00 0.51CE 18.97 12.56 4.49 6.92 3.85 4.62CF 1.79 0.26 0.00 0.26 1.03 0.77CM 8.21 3.33 4.17 5.45 13.33 8.21CME 0.00 0.00 0.00 0.00 0.00 0.51CMR 0.26 0.00 0.26 0.77 0.00 0.26CS 1.54 26.41 2.82 8.72 0.00 4.36CTU 0.00 0.00 0.26 0.26 0.00 0.00ChoiseulShortland <strong>Islands</strong>Std Error Poro Raverave Sirovanga Taro Onua Rohae1ACB 0.99 0.51 1.03 1.10 0.00 0.41ACD 0.75 0.96 0.87 0.70 1.04 1.46ACE 3.33 0.00 2.56 1.50 0.77 0.63ACS 1.37 0.00 2.91 2.15 1.74 2.24ACT 0.87 0.48 1.55 1.04 0.98 0.63CB 0.00 0.77 0.26 0.00 0.00 0.31CE 2.67 1.59 0.74 0.87 0.57 0.87CF 0.77 0.26 0.00 0.26 1.03 0.51CM 2.38 0.31 0.98 0.86 2.01 1.26CME 0.00 0.00 0.00 0.00 0.00 0.31CMR 0.26 0.00 0.26 0.51 0.00 0.26CS 0.26 3.36 0.48 1.03 0.00 0.51CTU 0.00 0.00 0.26 0.26 0.00 0.00REGION 3 EXPOSED- OVERALLMean Std Dev Std ErrorACB 1.54 1.26 0.19ACD 4.57 2.31 0.25ACE 8.68 9.90 0.52ACS 5.26 4.86 0.37ACT 3.99 3.32 0.30CB 0.26 0.32 0.09CE 8.57 6.03 0.41CF 0.68 0.66 0.14CM 7.12 3.66 0.32CME 0.09 0.21 0.08CMR 0.26 0.28 0.09CS 7.31 9.82 0.52CTU 0.09 0.13 0.06186
Benthic CommunitiesF)REGION 3 SHELTEREDChoiseulShortland <strong>Islands</strong>MeanBoe Boe Ondolou Putuputurau Vurango Faisi Rohae 2ACB 0.77 7.44 17.18 2.56 0.00 1.79ACD 0.00 1.54 0.00 0.00 1.54 1.28ACE 0.00 0.00 2.31 3.33 0.26 0.26ACS 0.00 0.00 0.26 0.26 0.51 1.79ACT 0.51 2.05 0.00 0.51 1.03 2.05CB 1.54 1.03 3.33 1.28 0.51 11.28CE 14.62 11.28 2.56 4.10 0.51 2.05CF 2.05 4.36 1.28 4.87 0.77 6.41CM 9.74 5.38 1.28 9.23 5.90 14.36CME 0.00 0.00 0.00 1.03 3.85 0.00CMR 0.00 0.00 0.26 0.26 1.03 1.03CS 0.26 7.69 1.54 1.28 0.00 1.28CTU 0.00 0.00 0.26 1.03 0.00 0.51ChoiseulShortland <strong>Islands</strong>Std Error Boe Boe Ondolou Putuputurau Vurango Faisi Rohae 2ACB 0.77 3.23 4.54 1.67 0.00 0.31ACD 0.00 1.24 0.00 0.00 0.75 0.70ACE 0.00 0.00 1.24 1.04 0.26 0.26ACS 0.00 0.00 0.26 0.26 0.51 0.51ACT 0.31 0.51 0.00 0.51 1.03 0.87CB 0.48 0.48 1.55 0.81 0.51 1.59CE 2.21 2.93 1.15 0.48 0.51 0.77CF 0.87 1.65 0.99 1.83 0.77 2.26CM 2.31 1.24 0.57 1.48 2.01 2.45CME 0.00 0.00 0.00 0.63 2.92 0.00CMR 0.00 0.00 0.26 0.26 1.03 0.48CS 0.26 4.59 0.26 0.81 0.00 0.41CTU 0.00 0.00 0.26 0.48 0.00 0.51REGION 3 SHELTERED- OVERALLMean Std Dev Std ErrorACB 4.96 6.53 0.43ACD 0.73 0.80 0.15ACE 1.03 1.43 0.20ACS 0.47 0.68 0.14ACT 1.03 0.86 0.15CB 3.16 4.09 0.34CE 5.85 5.71 0.40CF 3.29 2.25 0.25CM 7.65 4.49 0.35CME 0.81 1.54 0.21CMR 0.43 0.48 0.12CS 2.01 2.85 0.28CTU 0.30 0.41 0.11187
<strong>Solomon</strong> <strong>Islands</strong> <strong>Marine</strong> <strong>Assessment</strong> Technical ReportG)REGION 4 EXPOSEDNew GeorgiaMeanNjari Landoro Toatelave Veru Haipe Vella LavellaACB 6.92 2.82 3.08 5.90 6.15 1.28ACD 1.54 0.77 2.05 7.44 8.72 4.36ACE 0.77 0.77 1.79 1.28 0.26 2.05ACS 3.59 1.79 2.82 2.05 4.62 0.51ACT 0.90 4.36 4.36 11.03 17.95 6.41CB 6.92 3.85 0.77 0.77 0.51 10.00CE 0.51 1.54 3.08 8.46 3.59 0.77CF 2.31 5.26 1.03 3.59 3.85 0.51CM 13.85 25.64 27.69 15.90 17.56 17.69CME 0.26 0.26 1.92 0.26 1.03 1.03CMR 3.59 1.28 0.00 0.00 0.00 0.77CS 0.51 1.03 2.31 0.00 0.26 0.26CTU 0.00 1.79 0.51 0.00 0.00 0.00New GeorgiaStd Error Njari Landoro Toatelave Veru Haipe Vella LavellaACB 2.09 1.69 1.50 0.87 1.88 0.81ACD 0.94 0.31 0.96 1.88 1.92 0.65ACE 0.31 0.51 0.51 0.81 0.26 0.65ACS 1.48 0.51 1.59 0.87 2.49 0.51ACT 0.38 2.80 1.04 2.77 2.26 2.03CB 2.09 1.62 0.51 0.77 0.51 3.72CE 0.31 0.75 0.51 0.65 1.92 0.31CF 1.03 2.15 0.63 1.48 1.99 0.31CM 2.12 4.88 4.36 1.88 2.96 1.48CME 0.26 0.26 0.57 0.26 0.75 0.48CMR 1.24 0.70 0.00 0.00 0.00 0.31CS 0.31 0.26 1.18 0.00 0.26 0.26CTU 0.00 0.65 0.00 0.00 0.00 0.00REGION 4 EXPOSED- OVERALLMean Std Dev Std ErrorACB 4.36 2.26 0.25ACD 4.15 3.30 0.30ACE 1.15 0.68 0.14ACS 2.56 1.44 0.20ACT 7.50 6.10 0.41CB 3.80 3.93 0.33CE 2.99 2.95 0.29CF 2.76 1.81 0.22CM 19.72 5.59 0.39CME 0.79 0.67 0.14CMR 0.94 1.40 0.20CS 0.73 0.85 0.15CTU 0.38 0.72 0.14188
Benthic CommunitiesH)REGION 4 SHELTEREDNew GeorgiaMean Lumalihe Mbili MundaACB 0.00 0.77 0.00ACD 0.77 0.00 1.28ACE 0.77 0.26 0.77ACS 0.77 0.00 0.26ACT 0.00 0.77 2.82CB 2.56 0.77 0.77CE 0.77 1.41 0.26CF 1.79 0.26 0.00CM 24.62 19.74 13.21CME 0.26 3.33 0.00CMR 0.00 0.51 0.64CS 4.10 0.26 0.26CTU 22.56 0.00 0.00New GeorgiaStd Error Lumalihe Mbili MundaACB 0.00 0.77 0.00ACD 0.51 0.00 0.81ACE 0.51 0.26 0.77ACS 0.77 0.00 0.26ACT 0.00 0.77 2.82CB 0.81 0.77 0.77CE 0.51 0.87 0.26CF 1.12 0.26 0.00CM 2.12 1.93 2.04CME 0.26 1.32 0.00CMR 0.00 0.51 0.57CS 1.59 0.26 0.26CTU 4.01 0.00 0.00REGION 4 SHELTERED- OVERALLMean Std Dev Std ErrorACB 0.26 0.44 0.22ACD 0.68 0.41 0.21ACE 0.60 0.26 0.17ACS 0.34 0.39 0.21ACT 1.20 1.46 0.40CB 1.37 0.02 0.05CE 0.81 0.31 0.18CF 0.68 0.59 0.26CM 19.19 0.10 0.10CME 1.20 0.70 0.28CMR 0.38 0.32 0.19CS 1.54 0.77 0.29CTU 7.52 2.31 0.51189
<strong>Solomon</strong> <strong>Islands</strong> <strong>Marine</strong> <strong>Assessment</strong> Technical ReportI)REGION 5 EXPOSEDMakiraThree Sisters <strong>Islands</strong> Uki Ni MasiMean Haurmanu Naone Malaupaina 1 PioACB 1.79 5.90 8.97 5.38ACD 1.28 0.77 1.79 5.00ACE 0.00 0.00 1.03 0.51ACS 0.00 2.82 9.49 10.26ACT 2.82 10.26 2.56 10.51CB 0.51 1.79 0.00 3.59CE 1.28 4.10 1.03 4.36CF 0.51 0.26 0.00 0.77CM 4.36 4.81 8.97 13.14CME 0.00 0.77 0.00 1.03CMR 0.00 0.26 0.26 0.77CS 0.77 2.31 1.03 1.54CTU 0.00 0.00 0.00 0.26MakiraThree Sisters <strong>Islands</strong> Uki Ni MasiStd Error Haurmanu Naone Malaupaina 1 PioACB 0.24 0.48 0.74 0.37ACD 0.27 0.21 0.37 0.39ACE 0.00 0.00 0.30 0.21ACS 0.00 0.33 0.61 0.51ACT 0.36 0.47 0.27 0.38CB 0.21 0.29 0.00 0.41CE 0.19 0.33 0.26 0.43CF 0.17 0.15 0.00 0.26CM 0.33 0.40 0.48 0.47CME 0.00 0.17 0.00 0.30CMR 0.00 0.15 0.15 0.26CS 0.21 0.28 0.21 0.29CTU 0.00 0.00 0.00 0.15REGION 5 EXPOSED- OVERALLMean Std Dev Std ErrorACB 5.51 2.94 0.43ACD 2.21 1.91 0.35ACE 0.38 0.49 0.18ACS 5.64 5.03 0.56ACT 6.54 4.44 0.53CB 1.47 1.60 0.32CE 2.69 1.78 0.33CF 0.38 0.33 0.14CM 7.82 4.11 0.51CME 0.45 0.53 0.18CMR 0.32 0.32 0.14CS 1.41 0.68 0.21CTU 0.06 0.13 0.09190
Benthic CommunitiesJ)REGION 5 SHELTEREDMakiraThree Sisters <strong>Islands</strong> Uki Ni Masi IslandMean Marautewa Na Mugha Malaupaina 2 PawaACB 0.77 2.82 3.08 2.82ACD 0.00 2.05 1.03 2.31ACE 0.00 0.00 1.28 0.00ACS 0.00 1.79 1.54 2.31ACT 0.51 1.54 1.28 2.05CB 8.46 0.26 3.08 2.31CE 2.56 1.03 0.00 0.77CF 1.03 1.54 0.00 0.00CM 14.10 4.36 0.00 6.84CS 2.82 0.26 7.95 0.26MakiraThree Sisters <strong>Islands</strong> Uki Ni Masi IslandStd Error Marautewa Na Mugha Malaupaina 2 PawaACB 0.26 0.34 0.42 0.33ACD 0.00 0.34 0.30 0.37ACE 0.00 0.00 0.34 0.00ACS 0.00 0.40 0.37 0.45ACT 0.17 0.33 0.34 0.34CB 0.59 0.15 0.45 0.36CE 0.42 0.30 0.00 0.26CF 0.24 0.30 0.00 0.00CM 0.28 0.38 0.00 0.36CS 0.33 0.15 0.79 0.15REGION 5 SHELTERED- OVERALLMean Std Dev Std ErrorACB 2.37 1.08 0.26ACD 1.35 1.05 0.26ACE 0.32 0.64 0.20ACS 1.41 0.99 0.25ACT 1.35 0.64 0.20CB 3.53 3.50 0.47CE 1.09 1.08 0.26CF 0.64 0.77 0.22CM 6.32 5.91 0.61CS 2.82 3.63 0.48191
<strong>Solomon</strong> <strong>Islands</strong> <strong>Marine</strong> <strong>Assessment</strong> Technical ReportK)REGION 6 EXPOSEDMalaitaMean Anuta Falaubulu 1 Leli 1 Maroria Suafa 1ACB 0.00 0.77 2.31 6.67 3.59ACD 4.10 1.03 2.31 5.13 4.36ACE 1.79 0.00 1.28 1.54 1.03ACS 0.00 3.85 5.13 0.00 2.56ACT 3.08 0.77 2.56 3.33 0.77CB 0.26 3.33 2.31 5.38 0.77CE 3.59 3.08 3.85 4.62 10.26CF 0.00 0.26 2.05 0.51 0.77CM 14.10 11.28 4.10 5.13 10.77CMR 0.51 0.00 0.00 0.51 0.00CS 1.28 0.51 1.28 0.00 8.97MalaitaStd Error Anuta Falaubulu 1 Leli 1 Maroria Suafa 1ACB 0.00 0.26 0.28 0.28 0.41ACD 0.36 0.30 0.36 0.36 0.31ACE 0.40 0.00 0.34 0.33 0.21ACS 0.00 0.25 0.54 0.00 0.38ACT 0.29 0.26 0.32 0.33 0.17CB 0.15 0.38 0.24 0.38 0.26CE 0.40 0.37 0.35 0.36 0.34CF 0.00 0.15 0.36 0.21 0.26CM 0.54 0.36 0.41 0.23 0.48CMR 0.17 0.00 0.00 0.21 0.00CS 0.27 0.17 0.30 0.00 0.39REGION 6 EXPOSED- OVERALLMean Std Dev Std ErrorACB 2.67 2.63 0.32ACD 3.38 1.68 0.26ACE 1.13 0.69 0.17ACS 2.31 2.29 0.30ACT 2.10 1.25 0.22CB 2.41 2.06 0.29CE 5.08 2.95 0.34CF 0.72 0.80 0.18CM 9.08 4.28 0.41CMR 0.21 0.28 0.11CS 2.41 3.71 0.39192
Benthic CommunitiesL)REGION 6 SHELTEREDMalaitaMean Airasi Arai Falaubulu 2 Leli 2 Suafa 2ACB 8.21 0.00 0.00 6.92 3.33ACD 0.77 0.51 0.00 0.51 0.00ACS 1.54 0.26 0.00 0.00 0.51ACT 4.10 0.26 0.00 0.26 0.00CB 0.51 1.54 3.33 9.23 3.59CE 3.08 1.54 0.00 0.77 5.38CF 1.03 0.26 0.00 2.05 0.00CM 9.23 17.44 14.10 4.36 14.87CME 0.51 0.00 0.00 2.05 0.00CMR 0.77 0.00 0.00 1.79 1.03CS 1.03 2.56 0.00 2.31 2.05MalaitaStd Error Airasi Arai Falaubulu 2 Leli 2 Suafa 2ACB 0.54 0.00 0.00 0.51 0.47ACD 0.26 0.21 0.00 0.21 0.00ACS 0.29 0.15 0.00 0.00 0.17ACT 0.38 0.15 0.00 0.15 0.00CB 0.21 0.29 0.47 0.54 0.31CE 0.34 0.30 0.00 0.26 0.46CF 0.24 0.15 0.00 0.34 0.00CM 0.48 0.49 0.23 0.28 0.52CME 0.21 0.00 0.00 0.37 0.00CMR 0.21 0.00 0.00 0.29 0.30CS 0.24 0.33 0.00 0.32 0.31REGION 6 SHELTERED- OVERALLMean Std Dev Std ErrorACB 3.69 3.81 0.39ACD 0.36 0.34 0.12ACS 0.46 0.64 0.16ACT 0.92 1.78 0.27CB 3.64 3.37 0.37CE 2.15 2.13 0.29CF 0.67 0.88 0.19CM 12.00 5.20 0.46CME 0.51 0.89 0.19CMR 0.72 0.76 0.17CS 1.59 1.06 0.21193
June 2006TNC Pacifi c Island CountriesReport No 1/06<strong>Solomon</strong> <strong>Islands</strong>GovernmentChapter 5Fisheries Resources:Coral Reef Fishes<strong>Solomon</strong> <strong>Islands</strong> <strong>Marine</strong> <strong>Assessment</strong>Alison Green, Peter Ramohia,Michael Ginigele & Tingo Leve195
Published by: The Nature Conservancy, Indo-Pacific Resource CentreAuthor Contact Details:Alison Green : The Nature Conservancy, 51 Edmondstone Street, South Brisbane, QLD 4101Australiae-Mail : agreen@tnc.orgPeter Ramohia : The Nature Conservancy, PO BOX 759, Honiara, <strong>Solomon</strong> <strong>Islands</strong>e-Mail : peter_tnc@solomon.com.sbMichael Ginigele : c/o Agnes Lodge, PO Box 9, Munda, Western Province, <strong>Solomon</strong><strong>Islands</strong>.Tingo Leve : World Wide Fund <strong>Solomon</strong> <strong>Islands</strong> Program, PO Box 97, Gizo, WesternProvince, <strong>Solomon</strong> <strong>Islands</strong>.Suggested Citation:Green, A., P. Ramohia, M. Ginigele and T. Leve, E. 2006. Fisheries Resources: Coral ReefFishes. In: Green, A., P. Lokani, W. Atu, P. Ramohia, P. Thomas and J. Almany (eds.) 2006.<strong>Solomon</strong> <strong>Islands</strong> <strong>Marine</strong> <strong>Assessment</strong>: Technical report of survey conducted May 13 to June17, 2004. TNC Pacific Island Countries Report No. 1/06.© 2006, The Nature ConservancyAll Rights Reserved.Reproduction for any purpose is prohibited without prior permission.Design: Jeanine AlmanyArtwork: Nuovo DesignMaps: Stuart Sheppard & Jeanine AlmanyCover Photo: © Emre TurakAvailable from:Indo-Pacific Resource CentreThe Nature Conservancy51 Edmondstone StreetSouth Brisbane, QLD 4101AustraliaOr via the worldwide web at: www.conserveonline.org196
Fisheries Resources: Coral Reef FishesContentsList of Appendices ................................................................................................................................... 198Summary........................................................................................................................................................ 199Introduction............................................................................................................................................203Methods....................................................................................................................................................... 206Survey Area and Sites..................................................................................................................................206Survey Methods............................................................................................................................................206Coral Reef Fish Communities ............................................................................................................206Key Fisheries Species: Food Fishes.................................................................................................... 210Key Fisheries Species: Large and Vulnerable Reef Fishes............................................................212Key Fisheries Species: Aquarium Fishes............................................................................................212Reptiles and Mammals...........................................................................................................................212Results........................................................................................................................................................... 214Coral Reef Fish Communities ..................................................................................................................214Species Richness.......................................................................................................................................214Density........................................................................................................................................................214Biomass.......................................................................................................................................................216Key Fisheries Species: Food Fishes Sighted on Transect Swims....................................................220Density.......................................................................................................................................................220Biomass.......................................................................................................................................................221Key Fisheries Species: Large, Vulnerable Reef Fishes Sighted on Long Swims ..........................237Density........................................................................................................................................................237Biomass.......................................................................................................................................................237Key Fisheries Species: Aquarium Fishes................................................................................................ 244Density....................................................................................................................................................... 244Reptiles and Mammals ................................................................................................................................245Density........................................................................................................................................................245Discussion ................................................................................................................................................... 256Coral Reef Fish Communities ..................................................................................................................256Key Fisheries Species: Food Fishes..........................................................................................................257Key Fisheries Species: Large and Vulnerable Reef Fishes ................................................................ 259Key Fisheries Species: Aquarium Fishes................................................................................................260Reptiles and Mammals ................................................................................................................................261Conservation and Management Recommendations...........................................................................261Acknowledgements................................................................................................................................ 263References ...................................................................................................................................................264Appendices ...................................................................................................................................................267197
<strong>Solomon</strong> <strong>Islands</strong> <strong>Marine</strong> <strong>Assessment</strong> Technical ReportList of AppendicesAppendix 1. Families and species recorded in the survey of coral reef resources in the <strong>Solomon</strong><strong>Islands</strong>, and constants used to convert size (length) to biomass. (page 267)Appendix 2. Mean density of each of the most abundant families of reef fishes on sheltered andexposed reef slopes (10m) in the <strong>Solomon</strong> <strong>Islands</strong>. (page 275)Appendix 3. Mean biomass of each of the most abundant families of reef fishes on sheltered andexposed reef slopes (10m) in the <strong>Solomon</strong> <strong>Islands</strong>. (page 280)Appendix 4. Mean density of key families of food fishes on sheltered and exposed reef slopes (10m) inthe <strong>Solomon</strong> <strong>Islands</strong> (page 285)Appendix 5. Mean density of each genera of food fishes in two key families (snappers and groupers)of reef fishes on sheltered and exposed reef slopes (10m) in the <strong>Solomon</strong> <strong>Islands</strong>. (page 290)Appendix 6. Mean density of each genera of food fishes in four key families (parrotfishes,surgeonfishes, emperors and fusiliers) of reef fishes on sheltered and exposed reef slopes (10m) in the<strong>Solomon</strong> <strong>Islands</strong>. (page 295)Appendix 7. Mean density of three key species targeted by the live reef food fish trade on shelteredand exposed reef slopes (10m) in the <strong>Solomon</strong> <strong>Islands</strong>. (page 300)Appendix 8. Mean density of large reef fishes (30cm or more in size) of sharks, rays and some keyfamilies of bony fishes on sheltered and exposed reef slopes (10m) in the <strong>Solomon</strong> <strong>Islands</strong>. (page 301)Appendix 9. Mean biomass of key families of food fishes on sheltered and exposed reef slopes (10m)in the <strong>Solomon</strong> <strong>Islands</strong>. (page 302)Appendix 10. Mean biomass of each genera of food fishes in two key families (snappers and groupers)of reef fishes on sheltered and exposed reef slopes (10m) in the <strong>Solomon</strong> <strong>Islands</strong>. (page 307)Appendix 11. Mean biomass of each genera of food fishes in four key families (parrotfishes,surgeonfishes, emperors and fusiliers) of reef fishes on sheltered and exposed reef slopes (10m) in the<strong>Solomon</strong> <strong>Islands</strong>. (page 312)Appendix 12. Mean biomass of three key species targeted by the live reef food fish trade on shelteredand exposed reef slopes (10m) in the <strong>Solomon</strong> <strong>Islands</strong>. (page 317)Appendix 13. Mean biomass of large reef fishes (30cm or more in size) of sharks, rays and some keyfamilies of bony fishes on sheltered and exposed reef slopes (10m) in the <strong>Solomon</strong> <strong>Islands</strong>. (page 318)Appendix 14. Mean density of large vulnerable reef fishes on sheltered and exposed reef slopes (10m)in the <strong>Solomon</strong> <strong>Islands</strong>. (page 319)Appendix 15. Mean biomass of large vulnerable reef fishes on sheltered and exposed reef slopes (10m)in the <strong>Solomon</strong> <strong>Islands</strong>. (page 321)Appendix 16. Mean density of aquarium fishes on sheltered and exposed reef slopes (10m) in the<strong>Solomon</strong> <strong>Islands</strong>. (page 323)198
Fisheries Resources: Coral Reef FishesSummaryReef fin-fish are the mainstay of subsistence and artisanal fisheries in the <strong>Solomon</strong> <strong>Islands</strong>,comprising a major component of the protein diet of <strong>Solomon</strong> Islanders. These resources arealso becoming an important source of income for inhabitants of many coastal communities.This survey represents the first broad scale, quantitative survey of coral reef fish communitiesand fisheries resources conducted in the <strong>Solomon</strong> <strong>Islands</strong>. The survey results will greatlyincrease our understanding of the status of these critically important marine resources, andhelp provide a scientific basis for their effective management.Quantitative surveys were conducted at 66 sites throughout seven of the nine provinces in the<strong>Solomon</strong> <strong>Islands</strong>: Isabel, Choiseul, Western, Central, Guadalcanal, Malaita and Makira.Coral reef fish communities and key fisheries resources were assessed using underwatervisual census methods along five replicate transects on reef slopes at depths of approximately10m at each site. Study sites were distributed to provide maximum geographic coverage ofthe main islands, and exposures around the islands, within the study area. A restricted list of37 families (383 species) was used, comprising only those amenable to underwater visual censustechniques. Of these, 23 families (67 species or species groups) and 12 families (42 species orspecies groups) were considered food and aquarium fishes respectively. A total of 110,640 reeffishes were counted during the survey, and their size estimated for biomass estimates.The status of coral reef fish communities was assessed based on their species richness, densityand biomass, while the status of food fish populations was assessed based on their density andbiomass. Aquarium fish populations were assessed based on their density only, sinceaquarium fishes are sold by the “piece” and not by weightThe status of coral reef fish communities and fisheries resources was highly variable amongprovinces, islands and sites. In general (see Table 1):• Coral reef fish communities were in good condition throughout most of the <strong>Solomon</strong><strong>Islands</strong>, with those in the Central (Russell <strong>Islands</strong> and Savo Island), Choiseul, Isabel(particularly the Arnavon <strong>Islands</strong>), Makira (particularly the offshore islands of ThreeSisters and Ugi), and Western Provinces (both New Georgia and the Shortland<strong>Islands</strong>), tending to be in better condition (in terms of fish species richness, densityand biomass) than those in Guadalcanal, Malaita and Central (Florida <strong>Islands</strong>)Provinces.• Healthy populations of food fishes were encountered in some locations in Central(Russell <strong>Islands</strong>), Choiseul, Isabel (particularly the Arnavon <strong>Islands</strong>), Makira (MakiraIsland), and Western Provinces. In contrast, healthy populations of food fishes werenot observed in Central (Florida <strong>Islands</strong> and Savo <strong>Islands</strong>), Guadalcanal, Makira(Three Sisters <strong>Islands</strong> and Ugi Island) and Malaita Provinces. Similar patterns wererecorded for four of the five major food fish families (snappers, surgeonfishes,emperors and parrotfishes). This pattern was most pronounced for key fisheriesspecies of parrotfishes (including the humphead parrotfish), which were not observedon Guadalcanal at all. The other major food fish family (groupers) was uncommonthroughout the survey area, with the highest densities recorded in the ArnavonCommunity <strong>Marine</strong> Conservation Area.• Large bony reef fishes (>30cm) were most abundant in Western, Makira, Isabel,Choiseul and Central Provinces, with few recorded in Guadalcanal or MalaitaProvinces.• Large and vulnerable reef fish species, particularly those targeted by the live reef foodfish trade (LRFFT) eg humphead wrasse, were uncommon or rare throughout thesurvey area, with most recorded in the northwestern provinces (particularly Choiseul,Western and Isabel Provinces). Large groupers also targeted by the LRFFT (brown199
<strong>Solomon</strong> <strong>Islands</strong> <strong>Marine</strong> <strong>Assessment</strong> Technical Reportmarbled grouper, camouflage grouper, and square-tailed coral grouper) were rarethroughout the survey area, as were barramundi cod, giant trevally, sharks and rays.Large and vulnerable emperor species were most abundant in Makira, Choiseul, andIsabel Provinces.• Healthy populations of aquarium fishes were encountered in some locations,particularly in Central (Russell <strong>Islands</strong> and Savo Island), Choiseul, Isabel, Makira(particularly Three Sisters <strong>Islands</strong> and Ugi Island), and Western Provinces (NewGeorgia and Shortland <strong>Islands</strong>). In contrast, only low densities of aquarium fishspecies were encountered in Guadalcanal and Malaita Provinces, and some locationsin Central (Florida <strong>Islands</strong>), Makira (Makira Island) and Isabel (Arnavon <strong>Islands</strong>)Provinces. The most abundant families were damselfishes, wrasses, surgeonfishes andfairy basslets, which accounted for most of the variation among provinces, islandsand sites, while other target families (butterflyfishes, angelfishes and hawkfishes)were less abundant. Key target species such as anemonefishes, blue-girdled angelfish,and emperor angelfish, were uncommon or rare throughout the survey area. Twoother key target species, the blue devil and blue tang, were not included in thissurvey, since they tend to occur in habitat types and depths not included in this study.The reasons for the varying status of coral reef fish communities and key fisheries resourcesthroughout the <strong>Solomon</strong> <strong>Islands</strong> cannot be determined with certainty, because of the lack ofprevious surveys and historical catch data for the study area. However, the variation at thesite level (within provinces and islands), was most likely due to the variation in coral reefhabitats among sites.However, some of the variation among provinces was also likely to be due to the impact ofhuman activities, particularly fishing, on reef fish populations, since the healthiest populationsof food fishes were observed in areas with small human populations, while those in worsecondition were located in or close to the most heavily populated provinces of Guadalcanal andMalaita, including areas where the coral reef habitat was in otherwise good condition.200
Fisheries Resources: Coral Reef FishesTable 1. Provinces and major islands or island groups where healthy coral reef communities orpopulations of key fisheries species were encountered.Province Island orIsland GroupCoralReefFishComm.FoodFishPops.LargeReefFishes(>30cm)Large,vulnerablereef fishesAquariumFishesCentral Russell <strong>Islands</strong> Yes Yes YesFlorida <strong>Islands</strong> No No Yes NoNoSavo Island Yes NoYesChoiseul Choiseul Yes Yes Yes Yes YesGuadalcanal Guadalcanal No No No No NoIsabel Isabel Yes Yes YesYes YesArnavon <strong>Islands</strong> Yes YesNoMakira Makira Yes Yes NoYesThree Sisters <strong>Islands</strong> Yes No No YesUgi Island Yes NoYesMalaita Malaita No No No No NoWestern* New Georgia Yes Yes YesYes YesShortland <strong>Islands</strong> Yes YesYes* Sites were excluded where no surveys were conducted for small or medium sized fishes.A high human population implies high fishing pressure on reef fish stocks and other marineresources. Two provinces, Guadalcanal and Malaita, host the two largest populated urbancenters in the <strong>Solomon</strong> <strong>Islands</strong> - Honiara and Auki respectively. The demand for reef fish inthese areas is high and expected to increase as these urban areas grow. Unlike otherprovinces such as the Western, Isabel or Choiseul, which have large extensive coral reefsystems and therefore a large unit area of coral reef per number of people, both Malaita(excluding Ontong Java) and Guadalcanal have less extensive reef systems and therefore asmall unit area of coral reef per number of people. With the current high population levels inthese provinces, the level of fishing pressure on reef fish stocks and other marine resources inthese and nearby provinces may already be too high. The use of highly efficient anddestructive fishing methods, particularly blast fishing, gill netting, night spear fishing andtargeting spawning aggregation sites, may be exacerbating the problem, particularly for largeand vulnerable species.In summary, the results of this survey indicate that overfishing of reef fish populations mayalready be occurring in some provinces, particularly in Guadalcanal, Malaita and Central(Florida <strong>Islands</strong>) Provinces. Given the rapidly rising population in the <strong>Solomon</strong> <strong>Islands</strong>, thisproblem is likely to become more serious and widespread in future.Because of the importance of coral reef fish resources to the livelihood of the <strong>Solomon</strong> Islandpeople, it is very important that these resources are managed to ensure their long termsustainability. As the country’s population increases, the reliance on reef fish resources isalso expected to increase. In light of this inevitable scenario, the government is strongly urgedto undertake appropriate measures to safeguard its coral reef fisheries resources. This studyhas helped provide a scientific basis for the National Government to reassess the status ofthese resources, and the management arrangements for these fisheries.We recommend that the National Government consider the following management actions toensure the long term sustainability of these critically important resources:• Ban the use of highly efficient and destructive fishing methods, particularly gillnetsand night spear fishing;• Undertake a nationwide education and awareness program to help fishermenunderstand the importance of conservation and management of fisheries resources,and the important habitats these resources depend on for their well being;201
<strong>Solomon</strong> <strong>Islands</strong> <strong>Marine</strong> <strong>Assessment</strong> Technical Report• Implement an education and awareness program on blast fishing targeted towardsensuring that young people understand the effect of these methods on marineresources and their habitats, and that this activity is prohibited and penalties apply forbreaching the law;• Recruit more enforcement officers to work closely with other law enforcementagencies and rural fishing communities to monitor and enforce fisheries laws andregulations;• Facilitate and support the establishment of <strong>Marine</strong> Protected Areas to protect keyfisheries species (food and aquarium fishes);• Protect large and vulnerable fish species (humphead parrotfish, humphead wrasse andlarge groupers) through the protection of fish spawning aggregation sites, and theimplementation of the National Management and Development Plan for the Live ReefFood Fish Fishery;• Develop Management and Development Plans for other food fishes and the AquariumIndustry;• Speed-up the appointment and establishment of the Fishery Advisory Council asprovided for under the Fisheries Act 1998, to ensure proper Fisheries Managementand Development Plans are implemented;• Develop alternative offshore fisheries such as, raft fishing for tuna, squid fishing anddeep water snapper fishing to ease fishing pressure on the inshore resources; and• Establish long term monitoring of key fisheries resources, and their use in subsistenceand artisanal fisheries in the <strong>Solomon</strong> <strong>Islands</strong>202
Fisheries Resources: Coral Reef FishesIntroductionFisheries in the <strong>Solomon</strong> <strong>Islands</strong> comprise two distinct sectors: the industrial sector which ispredominantly off-shore and depends on the abundant tuna resources found in the country’sexclusive economic zone (EEZ), and the subsistence-artisanal sector which is based oninshore resources found in the coastal regions. Although the off-shore fisheries contributemore to the national economy in terms of foreign exchange earning (Gillett and Lightfoot2002), the subsistence-artisanal sector is by far the most important to the bulk of thepopulation with annual production estimated at SI$60 million (Kile 2000) and US$9.963million (Gillett and Lightfoot 2002). This sector provides food, income and employment formany inhabitants of coastal communities throughout the country, and will become increasingimportant as the population of the <strong>Solomon</strong> <strong>Islands</strong> increases.Reef fin-fishes are the mainstay of the subsistence-artisanal fisheries in the <strong>Solomon</strong> <strong>Islands</strong>,and have always formed a major component of the protein diet of <strong>Solomon</strong> Islanders (Leqataet al. 1990, Leqata and Oreihaka 1995, Oreihaka and Ramohia 2000). Reef fin-fish resourcesare also becoming an important source of income for inhabitants of many coastalcommunities. Many rural fishers now have access to provincial fisheries centres and urbanmarket outlets where they sell reef fish and other marine products, and a substantial amount ofincome is now generated each year through fish sales to these centres. For example, betweenApril 1, 2001 and February 28, 2003, six fisheries centres supported by the European Unionin Isabel, Malaita, Western and Central <strong>Islands</strong> provinces produced 132.092mt of reef fishworth SI$909,778 (Russell and Buga 2004).The Live Reef Food Fish Trade (LRFFT: Donnelly et al. 2000; Donnelly 2000; Kile et al.2000) and Aquarium Trade (Kinch 2004a, b) have also attracted some commercialopportunities for fishers in rural coastal communities. However in the case of the LRFFT,these economic opportunities have often come at a significant ecological and social cost(Johannes & Lam, 1999; Donnelly, 2000; Donnelly et al., 2000). In order to be cost effective,LRFFT operations in the <strong>Solomon</strong> <strong>Islands</strong> have been pulse fishing events that target grouperspawning aggregations during known reproductive seasons. This fishing practice is extremelydestructive and can eliminate breeding populations of fish in as little as two or three years(Johannes, 1997; Sadovy & Vincent, 2002). For example, between 1996 and 1997 localfishers from Roviana Lagoon in the Western <strong>Solomon</strong>’s dramatically overfished a historicallylarge grouper aggregation site in order to supply a LRFFT operation. This aggregation site hasbeen monitored continuously since May 2004, but to date has shown few if any signs ofrecover (Hamilton et al., 2005). The long term ecological and economic implication ofdestroying spawning aggregations means that we strongly recommended that this fishery isnot engaged with in the future.Despite being a major provider of food and income, the status of the reef fin-fish stocks in<strong>Solomon</strong> <strong>Islands</strong> is not well understood. This relates to both the small scale multi-speciesnature of most coastal fisheries in the <strong>Solomon</strong> <strong>Islands</strong> and the limited amount of funds thathave been committed to this type of work.Although there is little quantitative data available on reef fin-fish population dynamics in the<strong>Solomon</strong> <strong>Islands</strong>, many coastal communities have detailed bodies of local knowledge abouttheir environment, and researchers have frequently drawn on local knowledge to assist themin their research. Past experience has shown the local knowledge of <strong>Solomon</strong> Islandcommunities can be very valuable for providing detailed information on; harvesting strategies(Aswani, 1998; Johannes et al. 2000), the locations of critical habitats such as nursery andspawning areas (Johannes 1989; Johannes and Hviding 2001; Hamilton, 2004; Hamilton etal., 2005), and changes in the status of local fisheries over time (Hamilton, 2003; Hamilton2004). The general lack of understanding of reef fin-fish population dynamics is closely203
<strong>Solomon</strong> <strong>Islands</strong> <strong>Marine</strong> <strong>Assessment</strong> Technical Reportrelated to the absence of empirical data and the complexity of reef fin-fish communities. Asummary of some of the work undertaken on reef fin-fish resources since the mid 1980s isprovided below.• A Baitfish Research Project funded by the Australian Centre for AgriculturalResearch (ACIAR) was carried out between 1986 and 1990. This study investigatedthe important baitfish species in the commercial bait fishery, and the predatoryspecies that feed on them. This study also investigated which of the major baitfishpredators were also important food fishes in the subsistence-artisanal fisheries.(Blaber et al. 1990a, b; Leqata et al. 1990). In addition to these investigations, thestudy also established a checklist of coral reef and mangrove fish species for sixlocations in the country: Munda, Vonavona, Kolombangara, Rendova, Guadalcanaland Tulagi (Blaber et al. 1991). A total of 774 species from 91 families wererecorded.• Stock assessment aspects of the coral reef fin-fisheries were addressed during anotherACIAR funded project which was completed in 1995 (Legata and Oreihaka 1995;Samoilys et al., 1995). This study investigated the application of Underwater VisualCensus (UVC) to assess reef fin-fish stocks and demonstrate how UVC estimates ofbiomass can be used to predict catch rates or potential yields.• Various aspects of the LRFFT industry were studied through another ACIAR fundedproject (Sustainable Management of the Live Reef Fish Trade-Based Fishery in<strong>Solomon</strong> <strong>Islands</strong>) commissioned in 1998 at three locations in the country, namelyRoviana Lagoon, Marovo Lagoon and Ontong Java. This study focused on thebiology of LRFFT species, and the socio-economic and management aspects of thefishery (Donnelly 2000; Donnelly et al. 2000; Kile et al. 2000).• A rapid ecological assessment of marine resources of Rennell Island andIndispensable reef was conducted in 1994, which recorded 170 species of reef fishes(Cole 1994).• In 1998, a coral reef fish biodiversity survey was jointly conducted in the Santa Cruz<strong>Islands</strong>, Temotu province by the Australian Museum, Smithsonian Institution, FieldMuseum of Natural History, Milwaukee Public Museum and the Department ofFisheries and <strong>Marine</strong> Resources (DFMR) of the <strong>Solomon</strong> <strong>Islands</strong> Government(McGrouther 1999). This study recorded 725 species of reef fishes, which includedmany new species.• The feasibility of a new artisanal fishery based on the capture and culture of presettlementcoral reef fish targeted for the LRFFT has been investigated in <strong>Solomon</strong><strong>Islands</strong> by the WorldFish Centre (Bell et al. 1999: Hair et al. 2002, Hair and Doherty2004). This project was carried out in the Western province and Ontong Java inMalaita province.• Hamilton (2003; 2004) investigated the age-based demographics and status of thehumphead parrotfish (Bolbometopon muricatum) stocks in the New Georgia region ofthe Western <strong>Solomon</strong> <strong>Islands</strong>. He found that the population turnover rates for thisspecies are slow. This biological factor, coupled with the technological and socialshifts that have occurred in subsistence fisheries in recent decades, has resulted in thisspecies being rapidly overfished in Roviana Lagoon.• Indigenous knowledge of spawning aggregations of the longfin emperor speciesLethrinus erythropterus was investigated in Roviana lagoon by Hamilton (2005).204
Fisheries Resources: Coral Reef FishesAlthough these studies have been very useful in contributing to our understanding of differentaspects of reef fin fish resources in <strong>Solomon</strong> <strong>Islands</strong>, many are dated, location and speciesspecific or based on export data (fisheries dependent).Coral reef fish resources are facing high exploitation pressures in the <strong>Solomon</strong> <strong>Islands</strong> due tothe increasing human population, the change from subsistence to a cash economy, and the useof highly efficient and destructive fishing methods (particularly blast fishing, gill nets, andnight spear fishing). Effective fisheries management will be required for the sustainablemanagement of these critically important resources in the long term.The <strong>Solomon</strong> <strong>Islands</strong> <strong>Marine</strong> <strong>Assessment</strong> has also demonstrated that the coral reefcommunities in the <strong>Solomon</strong> <strong>Islands</strong> are highly diverse and a high priority for marineconservation (see Executive Summary this report). As such, there is an urgent need for moreup to date and detailed information on the status of coral reef fish communities and thepopulations of key fisheries species, to provide a more scientific basis for the effectiveconservation and management of these resources in the <strong>Solomon</strong> <strong>Islands</strong>.This study represents the first broad scale survey of coral reef fish communities andpopulations of key fisheries species in the <strong>Solomon</strong> <strong>Islands</strong>. The primary objective was toconduct a quantitative baseline assessment of the status of these resources throughout themain island chain of the <strong>Solomon</strong> <strong>Islands</strong>, encompassing seven of the nine provinces. Theresults will help provide a scientific basis for the conservation and management of coral reeffish communities and fisheries resources through fisheries management at the national,provincial and community levels; education and awareness programs for communities andschools; and the development of a National Biodiversity Strategic Action Plan (NBSAP) for<strong>Solomon</strong> <strong>Islands</strong>. This survey will also establish a baseline for the long term monitoring ofthese resources.205
<strong>Solomon</strong> <strong>Islands</strong> <strong>Marine</strong> <strong>Assessment</strong> Technical ReportMethodsSURVEY AREA AND SITESThe survey focused on the core island group of the <strong>Solomon</strong> <strong>Islands</strong>, from Choiseul andShortland <strong>Islands</strong> in the northwest to the Makira in the southeast (Figure 1). Sixty-six sites weresurveyed in seven provinces: Isabel, Choiseul, Western, Central, Guadalcanal, Malaita andMakira (Figures 1 & 2).Study sites were distributed to provide maximum geographic coverage of the main islands andisland groups within the study area. The number of sites sampled in each island or groupdepended on its size and habitat complexity, and as well as logistic constraints (time andweather). Four to 12 sites were surveyed on each of the large islands and groups (Isabel,Choiseul, New Georgia, Guadalcanal, Makira and Malaita), and one to four sites were surveyedon each of the smaller islands (Arnavons, Shortlands, Russells, Floridas, Three Sisters, Ugi, andSavo <strong>Islands</strong>).Survey sites were also selected to represent both exposed and sheltered habitats on each island orisland group. Exposed sites were located on the outside of reefs, where exposure to waves andoceanic influences were high. Sheltered sites were located in protected lagoons and bays, whereexposure to wave activity and oceanic influences was low. Of the 66 sites surveyed, 35 and 31were located in exposed and sheltered areas respectively.SURVEY METHODSCoral Reef Fish CommunitiesCoral reef fish communities were surveyed using underwater visual census techniques along fivereplicate transects on the reef slope (depth=10m) at each site. Fishes were surveyed by three passesalong the transect counting different species in each pass, using different transect dimensions foreach group (based on their behaviour, size and abundance):• Large, highly mobile species that are most likely to be disturbed by the passage of a diver(such as parrotfishes, snappers and emperors) were surveyed on the first pass using transectdimensions of 50m x 5m.• Medium sized mobile species (including most surgeonfishes, butterflyfishes and wrasses)that are less disturbed by the presence of a diver, were counted on the second pass usingtransect dimensions of 50m x 3m.• Small, site attached species (mostly damselfishes) that are least disturbed by the presence ofa diver, were counted on the third pass using transect dimensions of 30m x 1m.Small and medium sized reef fishes were not surveyed at four sites in the Western Province dueto logistic constraints (Figure 1): two sites in the Shortland <strong>Islands</strong> (Sites 27 and 28: Onua andFaisi respectively) and two sites in New Georgia (Sites 29 and 30: Vella Levella and Njarirespectively).206
Fisheries Resources: Coral Reef FishesFigure 1. Survey track (in red) and location of each survey site in the <strong>Solomon</strong> <strong>Islands</strong>.207
<strong>Solomon</strong> <strong>Islands</strong> <strong>Marine</strong> <strong>Assessment</strong> Technical ReportFigure 2. <strong>Solomon</strong> Island Provinces.During each pass of the transect, the number of individuals of each species was counted andrecorded onto underwater paper. The size of each individual (length in cm) was also estimatedand recorded. Fish identifications were based on Allen (2003).Transect lengths were measured using 50m tapes, and transect widths were estimated usingknown body proportions. Transect tapes were laid during the first pass by an assistant followingthe observer (to minimize disturbance to the fish communities being counted). The tapes thenremained in situ until all the surveys were completed at that site. Fish counts (i.e. each pass of thetransect) were separated by a waiting period of ~5 minutes between counts. Benthic communitiesand key macroinvertebrates were surveyed along the same transects after the fish counts werecompleted (see Benthic Communities this report; and Fisheries Resources: CommerciallyImportant Macroinvertebrates this report).A restricted list of 37 families was used comprising only those families that are amenable tovisual census techniques, because they are relatively large, diurnally active and conspicuous incoloration and behaviour (Table 2). This method excludes species that are not amenable to thetechnique because they are very small, nocturnal or cryptic in behaviour (eg gobies, blennies,cardinalfish).Reef fish communities were compared among provinces, islands and sites based on their speciesrichness, density and biomass. Where: fish species richness was the total number of speciesrecorded on the transects, and fish density was converted to the number of individuals per hectare(ha). Fish biomass was calculated by converting estimated fish lengths to weights using theallometric length-weight conversion formulae [weight (kg) = (total length in cm x constant a) b ]208
Fisheries Resources: Coral Reef Fisheswhere a and b are constants for each species. Constants were not available for most species in the<strong>Solomon</strong> <strong>Islands</strong>, so they were obtained from New Caledonia (Kulbicki unpubl data: Appendix1), which was the closest geographic area where this information was available. Where constantswere not available for a species, the constants for a similar species (usually a congeneric species)were used.This survey established a quantitative baseline for the long term monitoring of coral reef fishes inthe <strong>Solomon</strong> <strong>Islands</strong>.Table 2. Reef fish families surveyed in the <strong>Solomon</strong> <strong>Islands</strong>.ClassFamilyFamily Common Name(common name)Chondrichtyes(sharks and rays)Osteichthyes(bony fishes)CarcharinidaeGinglymostomatidaeHemigaleidaeMyliobatidaeAcanthuridaeAulostomidaeBalistidaeCaesionidaeCarangidaeChaetodontidaeDiodontidaeEcheneidaeEphippidaeFistularidaeHaemulidaeKyphosidaeLabridaeLethrinidaeLutjanidaeMalacanthidaeMonacanthidaeMugilidaeMullidaeNemipteridaeOstracidaePinguipedidaePomacanthidaePomacentridaeScaridaeScomberidaeScorpaenidaeSerranidaeSiganidaeSphyraenidaeSynodontidaeTetraodontidaeZanclidaewhaler or requiem sharksnurse sharksweasel sharkseagle rayssurgeonfishes and unicornfishestrumpetfishestriggerfishesfusilierstrevalliesbutterflyfishesporcupinefishessuckerfishbatfishesflutemouthssweetlipsdrummerswrassesemperorssnapperssand tilefishesleatherjacketsmulletsgoatfishescoral breamsboxfishessandperchesangelfishesdamselfishesparrotfishesmackerelsscorpionfishesgroupersrabbitfishesbarracudaslizardfishespuffersmoorish idol209
<strong>Solomon</strong> <strong>Islands</strong> <strong>Marine</strong> <strong>Assessment</strong> Technical ReportKey Fisheries Species: Food FishesKey food fish species were defined as those targeted by commercial, artisanal and subsistencefisheries, which comprise important components of the catch in the <strong>Solomon</strong> <strong>Islands</strong>. A list ofthese species was compiled based on advice from the <strong>Solomon</strong> <strong>Islands</strong> Department of Fisheriesand <strong>Marine</strong> Resources, local scientists, managers and fishermen (Table 3). All key fisheriesspecies were counted (and their size estimated) during the survey of the coral reef fishcommunities described above (see Coral Reef Fish Communities).Key fisheries species were compared among provinces, islands and sites based on the density andbiomass of all species and key families (see Coral Reef Fish Communities above for calculations).Bony fishes and cartilaginous fishes (sharks and rays) were analysed separately. Density andbiomass of large bony food fishes (30cm or more in size) were compared among provinces, so asnot to identify individual sites where they were abundant.Table 3. Key species of food fishes in the <strong>Solomon</strong> <strong>Islands</strong>.Taxa/Family Species Common NameSharks All species SharksMobulidae (manta rays) Manta spp. Manta raysMyliobatidae (eagle rays) Aetobatus narinari Spotted eagle rayLabridae (wrasses) Cheilinus undulatesHumphead wrasseScaridae (parrotfishes)Serranidae (groupers)Haemulidae (sweetlips)Cheilinus fasciatusBolbometopon muricatumHipposcarus longicepsChlorurus microrhinosPlectropomus areolatusPlectropomus laevisPlectropomus oligacanthusPlectropomus leopardusEpinephelus fuscoguttatusEpinephelus polyphekadionEpinephelus lanceolatusCromileptes altivelisVariola loutiVariola albimarginataEpinephalus merra/quoyanusCephalopholis argusCephalopholis cyanostigmaCephalopholis miniataPlectorhinchus albovittatusPlectorhinchus vittatusPlectorhinchus lineatusPlectorhinchus chaetodonoidesRedbreasted wrasseHumphead parrotfishPacific longnose parrotfishSteephead parrotfishSquaretail coral grouperBlacksaddle coral grouperHighfin coral grouperLeopard coral grouperBrown-marbled grouperCamouflage grouperGiant grouperBarramundi codYellow-edged lyretailWhite-edged lyretailHoneycomb groupersPeacock grouperBluespotted grouperCoral grouperGiant sweetlipsOriental sweetlipsDiagonal-banded sweetlipsMany-spotted sweelips210
Fisheries Resources: Coral Reef FishesTaxa/Family Species Common NameLutjanidae (snappers) Aprion virescensLutjanus gibbusLutjanus boharLutjanus argentimaculatusMacolor nigerMacolor macularisSymphorichthys spilurusSmall yellow and spot (= L.monostigma, L. fulviflamma, L.ehrenbergii etc)Small & yellow lines(= L. quinquelineatus, L. kasmira)Lethrinidae (emperors)Acanthuridae(surgeonfishes)Siganidae (rabbitfishes)Mullidae (goatfishes)Lethrinus olivaceusLethrinus erythropterusLethrinus rubrioperculatusLethrinus xanthochilusMonotaxis grandoculisSmall lethrinids (Lethrinus spp.)Naso hexacanthusNaso lituratusNaso unicornisNaso brevirostrisLarge ringtails (Acanthurusxanthopterus, A. mata, A. nigricauda A.dussumieri, A. blochi, A. fowleri etc)Small surgeonfish: Acanthurus lineatusand Ctenochaetus speciesSiganus lineatusSiganus vermiculatusSiganus fuscescensSiganus puellusParupeneus bifasciatus/trifasciatusParupeneus cyclostomusParupeneus barberinusParupeneus vanicolensisGreen jobfishHumpback snapperRed snapperMangrove red snapperBlack snapperMidnight snapperSailfin snapperLongspot/blackspot/onespotsnapperFive-lined/bluestripe snapperLongface emperorLongfin emperorSpotcheek emperorYellowlip emperorHumpnose bigeye breamSmall emperorsSleek unicornfishOrangespine unicornfishBluespine unicornfishSpotted unicornfishRingtailsLined surgeonfish andBristletoothLined rabbitfishVermiculate rabbitfishDusky rabbitfishMasked rabbitfishDoublebar/Indian doublebargoatfishGoldsaddle goatfishDash-dot goatfishYellowfin goatfishKyphosidae (drummers) Kyphosus spp. DrummerOstracidae (boxfishes) Ostracion cubicus Yellow boxfishCaesionidae (fusiliers) Caesio cuning Yellowtail fusilierBalistidae (triggerfishes)Balistoides viridescensPseudobalistes flavimarginatusBalistapus undulatusTitan triggerfishYellowmargin triggerfishOrange-lined triggerfishChanidae (milkfishes) Channos channos MilkfishHolocentridae(soldierfishes andsquirrelfishes 1 )Sargocentron spiniferumSabre squirrelfishCarangidae (trevally)Caranx ignobilisCaranx sexfasciatusCaranx papuensisCaranx melampygusGiant trevallyBigeye trevallyBrassy trevallyBluefin trevallySphyraenidae (barracudas) Sphyraena spp. Barracuda1 Not counted in this survey, because they are nocturnal and not amenable to visual census methods.211
<strong>Solomon</strong> <strong>Islands</strong> <strong>Marine</strong> <strong>Assessment</strong> Technical ReportKey Fisheries Species: Large and Vulnerable Reef FishesKey fisheries species of food fish that are large and particularly vulnerable to overfishing werecounted (and their size estimated) using long swim methods specifically developed for thispurpose (Choat and Spears 2003). They included:• Sharks (all species), manta rays (Manta spp.) and eagle rays (Aetobatus narinari);• Maori wrasse (Cheilinus undulatus);• Humphead parrotfish (Bolbometopon muricatum) and steephead parrotfish (Chlorurusmicrorhinos);• Large groupers (Epinephelus fuscoguttatus, Epinephelus polyphekadion, Epinepheluslanceolatus, Cromileptes altivelis, Variola louti and Variola albimarginata);• Giant trevally (Caranx ignobilis); and• Large and uncommon emperors (Lethrinus olivaceus, Lethrinus erythropterus, Lethrinusrubrioperculatus and Lethrinus xanthochilus).This method was developed to improve estimates of the abundance of these species, since theytend to be uncommon and clumped in distribution, so smaller transects dimensions (eg 50m x 5m)are not suitable for obtaining reasonable estimates of their abundance. In this method, theobserver surveys a wide area during a single pass of the reef slope over a set time period (15mins) scanning the reef slope for these species. When a standard width is used (20m), theseestimates can be converted to a standardised area (density per hectare).Density and biomass of large, vulnerable species were compared among provinces only, so as notto identify individual sites where they are abundant.Key Fisheries Species: Aquarium FishesAquarium fishes were defined as those targeted for export by the aquarium trade in the <strong>Solomon</strong><strong>Islands</strong>. A list of these species was defined based on advice from the <strong>Solomon</strong> <strong>Islands</strong>Department of Fisheries and <strong>Marine</strong> Resources, local scientists, managers and fishermen (Table4). These species were counted (and their size estimated) during the survey of the coral reef fishcommunities described above (see Coral Reef Fish Communities).Aquarium fish densities were compared among provinces, islands and sites based on the densityof all species, key families and key species. Data analysis focused on density only, sinceaquarium fish are sold by the “piece” and not by weight.Reptiles and MammalsObservations of rare and threatened species (sea turtles, crocodile, dugong, and cetaceans) wererecorded during the long swims (see Key Fisheries Species: Large and Vulnerable Reef Fishesabove).212
Fisheries Resources: Coral Reef FishesTable 4. Key species of aquarium fishes in the <strong>Solomon</strong> <strong>Islands</strong>.Family Taxa SpeciesAcanthuridaeAcanthurus spp.Paracanthurus hepatusZebrasoma spp.All Acanthurus speciesParacanthurus hepatusAll Zebrasoma speciesBalistidaeBalistoides spp.Odonus nigerRhinecanthus spp.Sufflamen spp.All Balistoides speciesOdonus nigerAll Rhinecanthus speciesAll Sufflamen speciesChaetodontidae All species All chaetodontid speciesCirrhitidaeCirrhitichthys spp.Paracirrhites spp.All Cirrhitichthys speciesAll Paracirrhites speciesHaemulidae Plectorhinchus spp. All Plectorhinchus speciesLabridaeAnampses spp.Bodianus spp.Cirrhilabrus spp.Coris gaimardHalichoeres spp.Labrichthyes spp.Labroides spp.Labropsis spp.Macropharyngodon spp.Pseudocheilinus hexataeniaStethojulis spp.Thalassoma spp.All Anampses speciesAll Bodianus speciesAll Cirrhilabrus speciesCoris gaimardAll Halichoeres speciesAll Labrichthyes speciesAll Labroides speciesAll Labropsis speciesAll Macropharyngodon speciesAll Pseudocheilinus hexataeniaAll Stethojulis speciesAll Thalassoma speciesMonacanthidae Oxymonacanthus longirostris Oxymonacanthus longirostrisPomacanthidaeApolemichthys spp.Centropyge spp.Pygoplites spp.Pomacanthus navarchusPomacanthus imperatorPomacanthus spp.All Apolemichthys speciesAll Centropyge speciesAll Pygoplites speciesAll Pomacanthus navarchusAll Pomacanthus imperatorAll Pomacanthus speciesPomacentridaeAmphprion spp.Chromis viridisChromis spp.Chrysiptera cyaneaChyrisptera spp.Dascyllus spp.Plectroglyphidodon dickiiPremnas biaculeatusAll Amphprion speciesAll Chromis viridisAll Chromis speciesAll Chrysiptera cyaneaAll Chyrisptera speciesAll Dascyllus speciesAll Plectroglyphidodon dickiiPremnas biaculeatusScaridae Cetoscarus bicolor Cetoscarus bicolorSerranidaeCephalopholis spp.Pseudanthias spp.All Cephalopholis spp.All Pseudanthias spp.Tetraodontidae Arothron spp. All Arothron spp.213
<strong>Solomon</strong> <strong>Islands</strong> <strong>Marine</strong> <strong>Assessment</strong> Technical ReportResultsA total of 110,640 coral reef fishes were counted on reef slopes at 66 sites in seven provinces inthe <strong>Solomon</strong> <strong>Islands</strong>. The following is a general description the coral reef fish communities (allspecies recorded), and key fisheries species (food fishes and aquarium fishes) based on thetransect data. Special consideration is given to large, vulnerable species that are particularlyvulnerable to overfishing based on the long swim data. Observations of rare and threatenedspecies (dugong and turtle) from the long swim data are also recorded.Small to medium size reef fishes were not surveyed at four sites in the Western Province due tologistic constraints (Figure 1): two sites in the Shortland <strong>Islands</strong> (Sites 27 and 28: Onua andFaisi respectively) and two sites in New Georgia (Sites 29 and 30: Vella Levella and Njarirespectively). Therefore, the following results should be considered an underestimate for thosesites.CORAL REEF FISH COMMUNITIESCoral reef fish communities are described based on their species richness, density and biomass.Species RichnessA total of 37 families and 383 species were counted during this survey (Appendix 1). Speciesrichness varied among provinces, islands and sites (Figure 3), ranging from 20 to 50 species atmost sites. There was no clear pattern associated with province or island, although speciesrichness tended to be highest in the Central (Russell <strong>Islands</strong> and Savo Island), Choiseul, Isabel(Arnavon <strong>Islands</strong>), Makira (particularly Ugi Island), and Western Provinces (both New Georgiaand Shortland <strong>Islands</strong>). With some exceptions, species richness tended to be higher at exposedthan sheltered sites in adjacent areas.DensityBony fishes were most abundant, accounting for 99.9% of the fish counted (Table 5). The mostabundant families were damselfishes, fusiliers, surgeonfishes, snappers and wrasses, followed byfairy basslets, parrotfishes and emperors. Sharks and rays were uncommon, accounting for lessthan 0.1% of the fishes counted (Table 5).Density was highly variable among provinces, islands, exposures and sites (Figure 4). Thehighest densities were recorded in Central, Choiseul, Isabel (including the Arnavon <strong>Islands</strong>),Makira (particularly the offshore islands of Three Sisters and Ugi Island) and the WesternProvinces, with lower densities recorded in Guadalcanal and Malaita. There was no clear patternassociated with exposure, with higher densities recorded on exposed sites at some locations and atsheltered sites at others, although the highest overall densities were recorded at sheltered sites. Ingeneral, sites with the highest densities were due to high densities damselfishes, with fusiliers,snappers, surgeonfishes, fairy basslets, wrasses, emperors, parrotfishes, drummers, andtriggerfishes also abundant at some sites (Appendix 2).214
Fisheries Resources: Coral Reef FishesTable 5. Relative abundance of each fish family in the <strong>Solomon</strong> <strong>Islands</strong>.Order Family Common Name RelativeDensity(% of total)RelativeBiomass(% of total)Bony Fishes Pomacentridae Damselfishes 67.7 5.7Caesionidae Fusiliers 7.8 8.2Acanthuridae Surgeonfishes 4.8 10.6Lutjanidae Snappers 4.5 21.2Labridae Wrasses 4.2 1.3Serranidae (Anthiinae) Fairy Basslets 2.1 0.1Scaridae Parrotfishes 2.1 14.6Lethrinidae Emperors 2.0 7.8Chaetodontidae Butterflyfishes 0.8 0.8Balistidae Triggerfishes 0.7 2.8Kyphosidae Drummers 0.7 3.9Mullidae Goatfishes 0.6 0.7Pomacanthidae Angelfishes 0.5 0.4Siganidae Rabbitfishes 0.4 1.4Carangidae Trevallies 0.2 1.3Serranidae (Epinephelinae) Groupers 0.2 0.8Nemipteridae Coral Breams 0.1 0.1Haemulidae Sweetlips 0.1 1.2Chanidae Milkfish 0.1 0.1Zanclidae Moorish Idols 0.1 0.1Cirrhitidae Hawkish 0.1
<strong>Solomon</strong> <strong>Islands</strong> <strong>Marine</strong> <strong>Assessment</strong> Technical ReportBiomassBony fishes accounted for most of the biomass (84.0%: Table 5), although sharks and rays werealso important (15.9%: Table 5). Most of the biomass of bony fishes was accounted for bysnappers, parrotfishes, surgeonfishes, fusiliers and emperors, with damselfishes, drummers,sharks and triggerfishes also important (Table 5, Appendix 3). While most of the biomass ofsharks and rays was accounted for by manta rays, with whaler sharks also important.Biomass was highly variable among provinces, islands, exposures and sites (Figure 5). Theparticularly high biomass at Site 55 on Malaita was due to the presence of the largemanta ray, while the high biomass at Site 27 in the Shortland <strong>Islands</strong> was due to the presence oflarge schools of snappers, emperors, surgeonfishes, and parrotfishes (Appendices 2 and 3).The highest biomass of bony fishes was recorded in the Central (Russell <strong>Islands</strong> Sites 38 and 41),Choiseul (Sites 17, 21, and 22), Isabel (Site 11, and Site 15 in the Arnavon <strong>Islands</strong>), Makira (Site44) and Western Provinces (New Georgia Site 29, and Site 27 in the Shortland <strong>Islands</strong>: Appendix3).216
Fisheries Resources: Coral Reef Fishes6050403020100Figure 3. Mean species richness (+ se) of coral reef fishes on sheltered and exposed reef slopes (10m)in the <strong>Solomon</strong> <strong>Islands</strong>.Floridas (1)Floridas (2)Floridas (62)Floridas (63)Russells (38)Russells (39)Russells (40)Russells (41)Savo (64)Choiseul (17)Choiseul (18)Choiseul (19)Choiseul (20)Choiseul (21)Choiseul (22)Choiseul (23)Choiseul (24)Guadalcanal (42)Guadalcanal (43)Guadalcanal (65)Guadalcanal (66)Arnavons (15)Arnavaons (16)Isabel (3)Isabel (4)Isabel (5)Isabel (6)Isabel (7)Isabel (8)Isabel (9)Isabel (10)Isabel (11)Isabel (12)Isabel (13)Isabel (14)Makira (44)Makira (45)Makira (46)Makira (47)Three Sisters (48)Three Sisters (49)Ugi (50)Ugi (51)Maliata (52)Maliata (53)Malaita (54)Malaita (55)Malaita (56)Malaita (57)Malaita (58)Malaita (59)Malaita (60)Malaita (61)New Georgia (29)New Georgia (30)New Georgia (31)New Georgia (32)New Georgia (33)New Georgia (34)New Georgia (35)New Georgia (36)New Georgia (37)Shortlands (25)Shortlands (26)Shortlands (27)Shortlands (28)Central Choiseul Guadal Isabel Makira Malaita WesternProvinceshelteredexposedspecies richness (per transect)217
<strong>Solomon</strong> <strong>Islands</strong> <strong>Marine</strong> <strong>Assessment</strong> Technical Report140000120000100000800006000040000200000Figure 4. Mean density (+ se) of coral reef fishes on sheltered and exposed reef slopes (10m)in the <strong>Solomon</strong> <strong>Islands</strong>.Floridas (1)Floridas (2)Floridas (62)Floridas (63)Russells (38)Russells (39)Russells (40)Russells (41)Savo (64)Choiseul (17)Choiseul (18)Choiseul (19)Choiseul (20)Choiseul (21)Choiseul (22)Choiseul (23)Choiseul (24)Guadalcanal (42)Guadalcanal (43)Guadalcanal (65)Guadalcanal (66)Arnavons (15)Arnavaons (16)Isabel (3)Isabel (4)Isabel (5)Isabel (6)Isabel (7)Isabel (8)Isabel (9)Isabel (10)Isabel (11)Isabel (12)Isabel (13)Isabel (14)Makira (44)Makira (45)Makira (46)Makira (47)Three Sisters (48)Three Sisters (49)Ugi (50)Ugi (51)Maliata (52)Maliata (53)Malaita (54)Malaita (55)Malaita (56)Malaita (57)Malaita (58)Malaita (59)Malaita (60)Malaita (61)New Georgia (29)New Georgia (30)New Georgia (31)New Georgia (32)New Georgia (33)New Georgia (34)New Georgia (35)New Georgia (36)New Georgia (37)Shortlands (25)Shortlands (26)Shortlands (27)Shortlands (28)Central Choiseul Guadal Isabel Makira Malaita WesternProvinceshelteredexposeddensity (per ha)218
Fisheries Resources: Coral Reef Fishes50000450004000035000300002500020000150001000050000Figure 5. Mean biomass (+ se) of coral reef fishes on sheltered and exposed reef slopes (10m)in the <strong>Solomon</strong> <strong>Islands</strong>.Floridas (1)Floridas (2)Floridas (62)Floridas (63)Russells (38)Russells (39)Russells (40)Russells (41)Savo (64)Choiseul (17)Choiseul (18)Choiseul (19)Choiseul (20)Choiseul (21)Choiseul (22)Choiseul (23)Choiseul (24)Guadalcanal (42)Guadalcanal (43)Guadalcanal (65)Guadalcanal (66)Arnavons (15)Arnavaons (16)Isabel (3)Isabel (4)Isabel (5)Isabel (6)Isabel (7)Isabel (8)Isabel (9)Isabel (10)Isabel (11)Isabel (12)Isabel (13)Isabel (14)Makira (44)Makira (45)Makira (46)Makira (47)Three Sisters (48)Three Sisters (49)Ugi (50)Ugi (51)Maliata (52)Maliata (53)Malaita (54)Malaita (55)Malaita (56)Malaita (57)Malaita (58)Malaita (59)Malaita (60)Malaita (61)New Georgia (29)New Georgia (30)New Georgia (31)New Georgia (32)New Georgia (33)New Georgia (34)New Georgia (35)New Georgia (36)New Georgia (37)Shortlands (25)Shortlands (26)Shortlands (27)Shortlands (28)Central Choiseul Guadal Isabel Makira Malaita WesternProvinceshelteredexposedbiomass (kg/ha)219
<strong>Solomon</strong> <strong>Islands</strong> <strong>Marine</strong> <strong>Assessment</strong> Technical ReportKEY FISHERIES SPECIES: FOOD FISHES SIGHTED ON TRANSECT SWIMSA total of 54,792 food fishes (bony fishes, sharks and rays), comprising 20 families and 87species, were counted throughout seven provinces during this survey. Populations of food fishesare described based on their distribution and abundance (density and biomass) throughout thesurvey area.DensityBony fishes were most abundant, accounting for 99.9% of the food fishes counted (Table 6). Themost abundant families were snappers, fusiliers and surgeonfishes, followed by emperors,parrotfishes, drummers, goatfishes and triggerfishes (Table 6). Sharks and rays were much lessabundant, accounting for less than 0.1% of the fishes counted (Table 6).Density of bony food fishes was highly variable among provinces, islands, exposures and sites(Figure 6). The highest densities were recorded in Western, Central (Russell <strong>Islands</strong>), Choiseul,Isabel (including Arnavon <strong>Islands</strong>), and Makira Provinces, with lower densities recorded inGuadalcanal, Malaita and Central (Florida <strong>Islands</strong>) Provinces. There was no clear patternassociated with exposure at adjacent sites, with higher densities recorded at exposed sites at somelocations and at sheltered sites at others. The high densities recorded at some sites were due tohigh densities of snappers, surgeonfishes, emperors, parrotfishes and fusiliers (e.g. ShortlandsSite 27), with drummers, goatfishes and triggerfishes also important at some sites (Appendix 4).The highest densities of key fisheries species of snappers, surgeonfishes, emperors, andparrotfishes were recorded in Western, Isabel (including Arnavon <strong>Islands</strong>), Choiseul, Central(Russell <strong>Islands</strong>), and Makira Provinces (Figures 7-10, Appendix 4). The most abundant generaof food fishes were (Appendices 5 and 6): Lutjanus and Macolor (snappers), Acanthurus,Ctenochaetus and Naso (surgeonfishes), Lethrinus and Monotaxis (emperors), Hipposcarus(parrotfishes) and Caesio (fusiliers).In contrast, only low densities of snappers, emperors and parrotfishes, were recorded inGuadalcanal and Malaita Provinces, and in the Florida <strong>Islands</strong> and Savo Island in CentralProvince (Figures 7, 9 and 10). This pattern was most pronounced for the key fisheries species ofparrotfishes (Figure 10), which were rare on Guadalcanal.Key fisheries species of grouper were not abundant in the survey area, with the highest densityrecorded in the Arnavon <strong>Islands</strong> (Figure 11), were Plectropomus and Variola were most abundant(Appendix 5). Only low densities of Epinephelus and Cromileptes were recorded throughout thesurvey area (Appendix 5), particularly those species targeted by the live reef food fish trade(Appendix 7): brown-marbled grouper (Epinephelus fuscoguttatus), camouflage grouper (E.polyphekadion), and squaretail coral grouper (Plectropomus areolatus).220
Fisheries Resources: Coral Reef FishesTable 6. Relative abundance of each family of food fish in the <strong>Solomon</strong> <strong>Islands</strong>.Order Family Common Name Relative Density(% of total)Relative Biomass(% of total)Bony Fishes Lutjanidae Snappers 24.76 25.40Caesionidae Fusiliers 22.72 4.92Acanthuridae Surgeonfishes 22.13 11.78Lethrinidae Emperors 9.75 8.96Scaridae Parrotfishes 5.14 14.25Kyphosidae Drummers 3.62 4.69Mullidae Goatfishes 2.57 0.64Balistidae Triggerfishes 2.57 3.07Siganidae Rabbitfishes 1.97 1.61Carangidae Trevally 1.24 1.52Labridae Wrasses 1.21 0.86Serranidae Groupers 0.89 0.86Haemulidae Sweetlips 0.68 1.46Chanidae Milkfishes 0.67 0.17Ostracidae Boxfishes 0.02 0.02Sphyraenidae Barracuda 0.01 0.67Total 99.9 80.9Sharks & Rays Carcharinidae Whaler sharks 0.03 3.60Hemigaleidae Weasel Sharks 0.02 0.36Unidentified Sharks Unidentified sharks 0.01 0.22Myliobatididae Eagle rays
<strong>Solomon</strong> <strong>Islands</strong> <strong>Marine</strong> <strong>Assessment</strong> Technical Reportfishes at most sites were due to a high biomass of snappers, parrotfishes, drummers, emperors,and surgeonfishes, with fusiliers and triggerfishes also important at some sites (Appendix 9).The highest biomass of key fisheries species of snappers, surgeonfishes, emperors, andparrotfishes were recorded in Western, Isabel (including Arnavon <strong>Islands</strong>), Choiseul, Makira andCentral Provinces (Russell <strong>Islands</strong>: Figures 14-17, Appendix 9). Genera that accounted for mostof the biomass of these families were (Appendices 10 and 11): Lutjanus and Macolor (snappers),Bolbometopon and Hipposcarus (parrotfishes). Acanthurus and Naso (surgeonfishes), andMonotaxis (emperors).In contrast, only low biomass of snappers, emperors and parrotfishes, were recorded inGuadalcanal and Malaita Provinces, and in the Florida <strong>Islands</strong> and Savo Island in CentralProvince (Figures 14-17, Appendix 9). This pattern was most pronounced for the key fisheriesspecies of parrotfishes (Figure 17), which were rare on Guadalcanal.Only low biomass of key fisheries species of grouper were recorded throughout the survey area,with the highest biomass recorded in the Arnavon <strong>Islands</strong> (Figure 18). The highest biomass wasrecorded by coral trout (Plectropomus) and lyretail groupers (Variola), with the highest biomassrecorded in the Arnavon <strong>Islands</strong>, Choiseul and New Georgia (Appendix 10). Only low biomassof Cephalopholis, Cromileptes and Epinephelus were recorded throughout the survey area(Appendix 10), particularly those species targeted by the live reef food fish trade (Appendix 12):brown-marbled grouper (Epinephelus fuscoguttatus), camouflage grouper (E. polyphekadion),and squaretail coral grouper (Plectropomus areolatus).The biomass of large reef fishes (30cm or more in size) was highest on exposed reefs slopes inmost provinces (Figure 19). Biomass was highest in Western Province, followed by Makira,Isabel, Choiseul and Central Provinces. Biomass was lowest in Guadalcanal and Malaita. Themoderate to high biomass of large reef fishes on the exposed reef slopes in most provinces wasdue to a high biomass of snappers, emperors, surgeonfishes and parrotfishes, with drummers andtriggerfishes also important in some locations (Appendix 13).Low to moderate biomass of sharks was recorded in all provinces except Malaita where no sharkswere recorded (Appendix 9 and 13). A high biomass of rays was recorded at one site in Malaita(Site 55) due to the presence of a large manta ray at that site. A low biomass of rays was alsorecorded at one site on Guadalcanal (Site 43).222
Fisheries Resources: Coral Reef Fishes450004000035000300002500020000150001000050000Figure 6. Mean density (+ se) of bony food fishes on sheltered and exposed reef slopes (10m)in the <strong>Solomon</strong> <strong>Islands</strong>.Floridas (1)Floridas (2)Floridas (62)Floridas (63)Russells (38)Russells (39)Russells (40)Russells (41)Savo (64)Choiseul (17)Choiseul (18)Choiseul (19)Choiseul (20)Choiseul (21)Choiseul (22)Choiseul (23)Choiseul (24)Guadalcanal (42)Guadalcanal (43)Guadalcanal (65)Guadalcanal (66)Arnavons (15)Arnavaons (16)Isabel (3)Isabel (4)Isabel (5)Isabel (6)Isabel (7)Isabel (8)Isabel (9)Isabel (10)Isabel (11)Isabel (12)Isabel (13)Isabel (14)Makira (44)Makira (45)Makira (46)Makira (47)Three Sisters (48)Three Sisters (49)Ugi (50)Ugi (51)Maliata (52)Maliata (53)Malaita (54)Malaita (55)Malaita (56)Malaita (57)Malaita (58)Malaita (59)Malaita (60)Malaita (61)New Georgia (29)New Georgia (30)New Georgia (31)New Georgia (32)New Georgia (33)New Georgia (34)New Georgia (35)New Georgia (36)New Georgia (37)Shortlands (25)Shortlands (26)Shortlands (27)Shortlands (28)Central Choiseul Guadal Isabel Makira Malaita WesternProvinceshelteredexposeddensity (per ha)223
<strong>Solomon</strong> <strong>Islands</strong> <strong>Marine</strong> <strong>Assessment</strong> Technical Report2500020000150001000050000Figure 7. Mean density (+ se) of key fisheries species of snappers on sheltered and exposed reef slopes(10m) in the <strong>Solomon</strong> <strong>Islands</strong>.Floridas (1)Floridas (2)Floridas (62)Floridas (63)Russells (38)Russells (39)Russells (40)Russells (41)Savo (64)Choiseul (17)Choiseul (18)Choiseul (19)Choiseul (20)Choiseul (21)Choiseul (22)Choiseul (23)Choiseul (24)Guadalcanal (42)Guadalcanal (43)Guadalcanal (65)Guadalcanal (66)Arnavons (15)Arnavaons (16)Isabel (3)Isabel (4)Isabel (5)Isabel (6)Isabel (7)Isabel (8)Isabel (9)Isabel (10)Isabel (11)Isabel (12)Isabel (13)Isabel (14)Makira (44)Makira (45)Makira (46)Makira (47)Three Sisters (48)Three Sisters (49)Ugi (50)Ugi (51)Maliata (52)Maliata (53)Malaita (54)Malaita (55)Malaita (56)Malaita (57)Malaita (58)Malaita (59)Malaita (60)Malaita (61)New Georgia (29)New Georgia (30)New Georgia (31)New Georgia (32)New Georgia (33)New Georgia (34)New Georgia (35)New Georgia (36)New Georgia (37)Shortlands (25)Shortlands (26)Shortlands (27)Shortlands (28)Central Choiseul Guadal Isabel Makira Malaita WesternProvinceshelteredexposeddensity (per ha)224
Fisheries Resources: Coral Reef Fishes180001600014000120001000080006000400020000Figure 8. Mean density (+ se) of key fisheries species of surgeonfishes on sheltered and exposed reef slopes(10m) in the <strong>Solomon</strong> <strong>Islands</strong>.Floridas (1)Floridas (2)Floridas (62)Floridas (63)Russells (38)Russells (39)Russells (40)Russells (41)Savo (64)Choiseul (17)Choiseul (18)Choiseul (19)Choiseul (20)Choiseul (21)Choiseul (22)Choiseul (23)Choiseul (24)Guadalcanal (42)Guadalcanal (43)Guadalcanal (65)Guadalcanal (66)Arnavons (15)Arnavaons (16)Isabel (3)Isabel (4)Isabel (5)Isabel (6)Isabel (7)Isabel (8)Isabel (9)Isabel (10)Isabel (11)Isabel (12)Isabel (13)Isabel (14)Makira (44)Makira (45)Makira (46)Makira (47)Three Sisters (48)Three Sisters (49)Ugi (50)Ugi (51)Maliata (52)Maliata (53)Malaita (54)Malaita (55)Malaita (56)Malaita (57)Malaita (58)Malaita (59)Malaita (60)Malaita (61)New Georgia (29)New Georgia (30)New Georgia (31)New Georgia (32)New Georgia (33)New Georgia (34)New Georgia (35)New Georgia (36)New Georgia (37)Shortlands (25)Shortlands (26)Shortlands (27)Shortlands (28)Central Choiseul Guadal Isabel Makira Malaita WesternProvinceshelteredexposeddensity (per ha)225
<strong>Solomon</strong> <strong>Islands</strong> <strong>Marine</strong> <strong>Assessment</strong> Technical Report120001000080006000400020000Figure 9. Mean density (+ se) of key fisheries species of emperors on sheltered and exposed reef slopes(10m) in the <strong>Solomon</strong> <strong>Islands</strong>.Floridas (1)Floridas (2)Floridas (62)Floridas (63)Russells (38)Russells (39)Russells (40)Russells (41)Savo (64)Choiseul (17)Choiseul (18)Choiseul (19)Choiseul (20)Choiseul (21)Choiseul (22)Choiseul (23)Choiseul (24)Guadalcanal (42)Guadalcanal (43)Guadalcanal (65)Guadalcanal (66)Arnavons (15)Arnavaons (16)Isabel (3)Isabel (4)Isabel (5)Isabel (6)Isabel (7)Isabel (8)Isabel (9)Isabel (10)Isabel (11)Isabel (12)Isabel (13)Isabel (14)Makira (44)Makira (45)Makira (46)Makira (47)Three Sisters (48)Three Sisters (49)Ugi (50)Ugi (51)Maliata (52)Maliata (53)Malaita (54)Malaita (55)Malaita (56)Malaita (57)Malaita (58)Malaita (59)Malaita (60)Malaita (61)New Georgia (29)New Georgia (30)New Georgia (31)New Georgia (32)New Georgia (33)New Georgia (34)New Georgia (35)New Georgia (36)New Georgia (37)Shortlands (25)Shortlands (26)Shortlands (27)Shortlands (28)Central Choiseul Guadal Isabel Makira Malaita WesternProvinceshelteredexposeddensity (per ha)226
Fisheries Resources: Coral Reef Fishes9000800070006000500040003000200010000Figure 10. Mean density (+ se) of key fisheries species of parrotfishes on sheltered and exposed reef slopes(10m) in the <strong>Solomon</strong> <strong>Islands</strong>.Floridas (1)Floridas (2)Floridas (62)Floridas (63)Russells (38)Russells (39)Russells (40)Russells (41)Savo (64)Choiseul (17)Choiseul (18)Choiseul (19)Choiseul (20)Choiseul (21)Choiseul (22)Choiseul (23)Choiseul (24)Guadalcanal (42)Guadalcanal (43)Guadalcanal (65)Guadalcanal (66)Arnavons (15)Arnavaons (16)Isabel (3)Isabel (4)Isabel (5)Isabel (6)Isabel (7)Isabel (8)Isabel (9)Isabel (10)Isabel (11)Isabel (12)Isabel (13)Isabel (14)Makira (44)Makira (45)Makira (46)Makira (47)Three Sisters (48)Three Sisters (49)Ugi (50)Ugi (51)Maliata (52)Maliata (53)Malaita (54)Malaita (55)Malaita (56)Malaita (57)Malaita (58)Malaita (59)Malaita (60)Malaita (61)New Georgia (29)New Georgia (30)New Georgia (31)New Georgia (32)New Georgia (33)New Georgia (34)New Georgia (35)New Georgia (36)New Georgia (37)Shortlands (25)Shortlands (26)Shortlands (27)Shortlands (28)Central Choiseul Guadal Isabel Makira Malaita WesternProvinceshelteredexposeddensity (per ha)227
<strong>Solomon</strong> <strong>Islands</strong> <strong>Marine</strong> <strong>Assessment</strong> Technical Report500450400350300250200150100500Figure 11. Mean density (+ se) of key fisheries species of groupers on sheltered and exposed reef slopes(10m) in the <strong>Solomon</strong> <strong>Islands</strong>.Floridas (1)Floridas (2)Floridas (62)Floridas (63)Russells (38)Russells (39)Russells (40)Russells (41)Savo (64)Choiseul (17)Choiseul (18)Choiseul (19)Choiseul (20)Choiseul (21)Choiseul (22)Choiseul (23)Choiseul (24)Guadalcanal (42)Guadalcanal (43)Guadalcanal (65)Guadalcanal (66)Arnavons (15)Arnavaons (16)Isabel (3)Isabel (4)Isabel (5)Isabel (6)Isabel (7)Isabel (8)Isabel (9)Isabel (10)Isabel (11)Isabel (12)Isabel (13)Isabel (14)Makira (44)Makira (45)Makira (46)Makira (47)Three Sisters (48)Three Sisters (49)Ugi (50)Ugi (51)Maliata (52)Maliata (53)Malaita (54)Malaita (55)Malaita (56)Malaita (57)Malaita (58)Malaita (59)Malaita (60)Malaita (61)New Georgia (29)New Georgia (30)New Georgia (31)New Georgia (32)New Georgia (33)New Georgia (34)New Georgia (35)New Georgia (36)New Georgia (37)Shortlands (25)Shortlands (26)Shortlands (27)Shortlands (28)Central Choiseul Guadal Isabel Makira Malaita WesternProvinceshelteredexposeddensity (per ha)228
Fisheries Resources: Coral Reef FishesFigure 12. Mean density (+ se) of large bony reef fishes (>30cm) onsheltered and exposed reef slopes (10m) in the <strong>Solomon</strong> <strong>Islands</strong>.5000density (per ha)4000300020001000shelteredexposed0Central Choiseul Guadal Isabel Makira Malaita WesternProvince229
<strong>Solomon</strong> <strong>Islands</strong> <strong>Marine</strong> <strong>Assessment</strong> Technical Report400003000020000100000Figure 13. Mean biomass (+ -se) of bony food fishes on protected and exposed reef slopes (10m) in the<strong>Solomon</strong> <strong>Islands</strong>.Floridas (1)Floridas (2)Floridas (62)Floridas (63)Russells (38)Russells (39)Russells (40)Russells (41)Savo (64)Choiseul (17)Choiseul (18)Choiseul (19)Choiseul (20)Choiseul (21)Choiseul (22)Choiseul (23)Choiseul (24)Guadalcanal (42)Guadalcanal (43)Guadalcanal (65)Guadalcanal (66)Arnavons (15)Arnavaons (16)Isabel (3)Isabel (4)Isabel (5)Isabel (6)Isabel (7)Isabel (8)Isabel (9)Isabel (10)Isabel (11)Isabel (12)Isabel (13)Isabel (14)Makira (44)Makira (45)Makira (46)Makira (47)Three Sisters (48)Three Sisters (49)Ugi (50)Ugi (51)Maliata (52)Maliata (53)Malaita (54)Malaita (55)Malaita (56)Malaita (57)Malaita (58)Malaita (59)Malaita (60)Malaita (61)New Georgia (29)New Georgia (30)New Georgia (31)New Georgia (32)New Georgia (33)New Georgia (34)New Georgia (35)New Georgia (36)New Georgia (37)Shortlands (25)Shortlands (26)Shortlands (27)Shortlands (28)Central Choiseul Guadal Isabel Makira Malaita WesternProvinceshelteredexposedbiomass (kg/ha)230
Fisheries Resources: Coral Reef Fishes1600014000120001000080006000400020000Figure 14. Mean biomass (+ se) of key fisheries species of snappers on sheltered and exposed reef slopes(10m) in the <strong>Solomon</strong> <strong>Islands</strong>.Floridas (1)Floridas (2)Floridas (62)Floridas (63)Russells (38)Russells (39)Russells (40)Russells (41)Savo (64)Choiseul (17)Choiseul (18)Choiseul (19)Choiseul (20)Choiseul (21)Choiseul (22)Choiseul (23)Choiseul (24)Guadalcanal (42)Guadalcanal (43)Guadalcanal (65)Guadalcanal (66)Arnavons (15)Arnavaons (16)Isabel (3)Isabel (4)Isabel (5)Isabel (6)Isabel (7)Isabel (8)Isabel (9)Isabel (10)Isabel (11)Isabel (12)Isabel (13)Isabel (14)Makira (44)Makira (45)Makira (46)Makira (47)Three Sisters (48)Three Sisters (49)Ugi (50)Ugi (51)Maliata (52)Maliata (53)Malaita (54)Malaita (55)Malaita (56)Malaita (57)Malaita (58)Malaita (59)Malaita (60)Malaita (61)New Georgia (29)New Georgia (30)New Georgia (31)New Georgia (32)New Georgia (33)New Georgia (34)New Georgia (35)New Georgia (36)New Georgia (37)Shortlands (25)Shortlands (26)Shortlands (27)Shortlands (28)Central Choiseul Guadal Isabel Makira Malaita WesternProvinceshelteredexposedbiomass (kg/ha)231
<strong>Solomon</strong> <strong>Islands</strong> <strong>Marine</strong> <strong>Assessment</strong> Technical Report6000500040003000200010000Figure 15. Mean biomass (+ se) of key fisheries species of surgeonfishes on sheltered and exposed reefslopes (10m) in the <strong>Solomon</strong> <strong>Islands</strong>.Floridas (1)Floridas (2)Floridas (62)Floridas (63)Russells (38)Russells (39)Russells (40)Russells (41)Savo (64)Choiseul (17)Choiseul (18)Choiseul (19)Choiseul (20)Choiseul (21)Choiseul (22)Choiseul (23)Choiseul (24)Guadalcanal (42)Guadalcanal (43)Guadalcanal (65)Guadalcanal (66)Arnavons (15)Arnavaons (16)Isabel (3)Isabel (4)Isabel (5)Isabel (6)Isabel (7)Isabel (8)Isabel (9)Isabel (10)Isabel (11)Isabel (12)Isabel (13)Isabel (14)Makira (44)Makira (45)Makira (46)Makira (47)Three Sisters (48)Three Sisters (49)Ugi (50)Ugi (51)Maliata (52)Maliata (53)Malaita (54)Malaita (55)Malaita (56)Malaita (57)Malaita (58)Malaita (59)Malaita (60)Malaita (61)New Georgia (29)New Georgia (30)New Georgia (31)New Georgia (32)New Georgia (33)New Georgia (34)New Georgia (35)New Georgia (36)New Georgia (37)Shortlands (25)Shortlands (26)Shortlands (27)Shortlands (28)Central Choiseul Guadal Isabel Makira Malaita WesternProvinceshelteredexposedbiomass (kg/ha)232
Fisheries Resources: Coral Reef Fishes800070006000500040003000200010000Figure 16. Mean biomass (+ se) of key fisheries species of emperors on sheltered and protected reef slopes(10m) in the <strong>Solomon</strong> <strong>Islands</strong>.Floridas (1)Floridas (2)Floridas (62)Floridas (63)Russells (38)Russells (39)Russells (40)Russells (41)Savo (64)Choiseul (17)Choiseul (18)Choiseul (19)Choiseul (20)Choiseul (21)Choiseul (22)Choiseul (23)Choiseul (24)Guadalcanal (42)Guadalcanal (43)Guadalcanal (65)Guadalcanal (66)Arnavons (15)Arnavaons (16)Isabel (3)Isabel (4)Isabel (5)Isabel (6)Isabel (7)Isabel (8)Isabel (9)Isabel (10)Isabel (11)Isabel (12)Isabel (13)Isabel (14)Makira (44)Makira (45)Makira (46)Makira (47)Three Sisters (48)Three Sisters (49)Ugi (50)Ugi (51)Maliata (52)Maliata (53)Malaita (54)Malaita (55)Malaita (56)Malaita (57)Malaita (58)Malaita (59)Malaita (60)Malaita (61)New Georgia (29)New Georgia (30)New Georgia (31)New Georgia (32)New Georgia (33)New Georgia (34)New Georgia (35)New Georgia (36)New Georgia (37)Shortlands (25)Shortlands (26)Shortlands (27)Shortlands (28)Central Choiseul Guadal Isabel Makira Malaita WesternProvinceshelteredexposedbiomass (kg/ha)233
<strong>Solomon</strong> <strong>Islands</strong> <strong>Marine</strong> <strong>Assessment</strong> Technical Report3500300025002000150010005000Figure 17. Mean biomass (+ se) of key fisheries species of parrotfishes on sheltered and protected reefslopes (10m) in the <strong>Solomon</strong> <strong>Islands</strong>.Floridas (1)Floridas (2)Floridas (62)Floridas (63)Russells (38)Russells (39)Russells (40)Russells (41)Savo (64)Choiseul (17)Choiseul (18)Choiseul (19)Choiseul (20)Choiseul (21)Choiseul (22)Choiseul (23)Choiseul (24)Guadalcanal (42)Guadalcanal (43)Guadalcanal (65)Guadalcanal (66)Arnavons (15)Arnavaons (16)Isabel (3)Isabel (4)Isabel (5)Isabel (6)Isabel (7)Isabel (8)Isabel (9)Isabel (10)Isabel (11)Isabel (12)Isabel (13)Isabel (14)Makira (44)Makira (45)Makira (46)Makira (47)Three Sisters (48)Three Sisters (49)Ugi (50)Ugi (51)Maliata (52)Maliata (53)Malaita (54)Malaita (55)Malaita (56)Malaita (57)Malaita (58)Malaita (59)Malaita (60)Malaita (61)New Georgia (29)New Georgia (30)New Georgia (31)New Georgia (32)New Georgia (33)New Georgia (34)New Georgia (35)New Georgia (36)New Georgia (37)Shortlands (25)Shortlands (26)Shortlands (27)Shortlands (28)Central Choiseul Guadal Isabel Makira Malaita WesternProvinceshelteredexposedbiomass (kg/ha)234
Fisheries Resources: Coral Reef Fishes250200150100500Figure 18. Mean biomass (+ se) of key fisheries species of groupers on sheltered and exposed reef slopes(10m) in the <strong>Solomon</strong> <strong>Islands</strong>.Floridas (1)Floridas (2)Floridas (62)Floridas (63)Russells (38)Russells (39)Russells (40)Russells (41)Savo (64)Choiseul (17)Choiseul (18)Choiseul (19)Choiseul (20)Choiseul (21)Choiseul (22)Choiseul (23)Choiseul (24)Guadalcanal (42)Guadalcanal (43)Guadalcanal (65)Guadalcanal (66)Arnavons (15)Arnavaons (16)Isabel (3)Isabel (4)Isabel (5)Isabel (6)Isabel (7)Isabel (8)Isabel (9)Isabel (10)Isabel (11)Isabel (12)Isabel (13)Isabel (14)Makira (44)Makira (45)Makira (46)Makira (47)Three Sisters (48)Three Sisters (49)Ugi (50)Ugi (51)Maliata (52)Maliata (53)Malaita (54)Malaita (55)Malaita (56)Malaita (57)Malaita (58)Malaita (59)Malaita (60)Malaita (61)New Georgia (29)New Georgia (30)New Georgia (31)New Georgia (32)New Georgia (33)New Georgia (34)New Georgia (35)New Georgia (36)New Georgia (37)Shortlands (25)Shortlands (26)Shortlands (27)Shortlands (28)Central Choiseul Guadal Isabel Makira Malaita WesternProvinceshelteredexposedbiomass (kg/ha)235
<strong>Solomon</strong> <strong>Islands</strong> <strong>Marine</strong> <strong>Assessment</strong> Technical ReportFigure 19. Mean biomass (+ se) of large bony reef fishes (>30cm) onsheltered and exposed reef slopes (10m) in the <strong>Solomon</strong> <strong>Islands</strong>.biomass (kg/ha)450040003500300025002000150010005000Central Choiseul Guadal Isabel Makira Malaita WesternProvinceshelteredexposed236
Fisheries Resources: Coral Reef FishesKEY FISHERIES SPECIES: LARGE, VULNERABLE REEF FISHES SIGHTED ON LONG SWIMSDensityThe density of large, vulnerable reef fishes sighted along long timed swims was low throughoutthe study area, and varied among provinces and exposures (Figure 20). Density was highest onexposed than sheltered reef slopes in most provinces, except Makira and Isabel. The highestdensities were recorded in Makira, Choiseul and Western Provinces, followed by Isabel,Guadalcanal, Malaita and Central Provinces.However, the species that comprised the highest densities varied among sites. For example, therelatively high density recorded on sheltered sites in Makira was largely comprised of emperors,particularly longface emperors (Appendix 14). In contrast, the relatively high density recorded onexposed sites in Choiseul Province was largely due to a mixture of groupers, humphead wrasses,steephead parrotfishes, and emperors, while the moderately high density recorded in WesternProvince was due to a mixture of parrotfishes and humphead wrasses.Different patterns of abundance were apparent when each species was considered individually.Humphead wrasses were more abundant on exposed than sheltered reef slopes in most provinces,except Central Province (Figure 21). The highest densities of this species were recorded inChoiseul and Central Provinces, followed by Western, Makira, Guadalcanal, Isabel and Malaita(Figure 21, Appendix 14).Humphead parrotfishes were also most abundant on exposed reef slopes, with the highest densityrecorded in the Western Province, followed by Isabel Province (Figure 22, Appendix 14). Thisspecies was less abundant in the other provinces, and was not recorded on Guadalcanal at all.Similarly, a low to moderate density of the steephead parrotfish was recorded in all provinces,except Guadalcanal (Appendix 14).Barramundi cod and giant trevally were rare throughout the survey area, and were only observedin Isabel Province (Appendix 14). Two species of grouper targeted by the live reef food fishtrade, the brown-marbled grouper and camouflage grouper were also rare, with only a fewindividuals recorded in a few provinces (Figures 23 and 24, Appendix 14). The yellow-edgedlyretail and white-edge lyretail were relatively more abundant, particularly in Choiseul,Guadalcanal, Central and Isabel Provinces (Appendix 14). In contrast, large emperors were mostabundant in Makira, Isabel, Choiseul, and Malaita Provinces.Sharks were uncommon, but recorded in low numbers in most Provinces except Central andIsabel. Rays were also uncommon, and were only recorded in Isabel and Western Provinces.BiomassA different pattern was apparent when biomass was considered (Figure 25). While the biomassof all large, vulnerable reef fishes combined also tended to be higher on the exposed thanprotected reef slopes, the highest biomass recorded was in the Western Province. This was due toa high biomass of humphead parrotfish, manta rays and humphead wrasse recorded in thatprovince (Appendix 15). Most of the biomass at the other sites was also accounted for byhumphead parrotfishes and humphead wrasses, except for Guadalcanal where a white tip reefshark was observed.237
<strong>Solomon</strong> <strong>Islands</strong> <strong>Marine</strong> <strong>Assessment</strong> Technical ReportDifferent patterns were apparent when each species was considered individually. The highestbiomass of humphead wrasse was recorded in Choiseul Province, followed by Western Province(Figure 26, Appendix 15), with lower densities recorded elsewhere. In contrast, biomass ofhumphead parrotfishes was highest in Western Province, followed by Isabel Province (Figure 27,Appendix 15). This species was less abundant in the other provinces, and was not recorded onGuadalcanal at all. Similarly, a low to moderate biomass of the steephead parrotfish wasrecorded in all provinces, except Guadalcanal (Appendix 15).Biomass of most other species was low throughout the survey area (Appendix 15), particularly fortwo species targeted by the live reef food fish trade: brown-marbled grouper and camouflagegrouper (Figures 28 and 29 respectively). Exceptions were the low to moderate biomass recordedfor longface emperor in Makira Province, manta rays in Western Province, and whitetip reefsharks in Guadalcanal.Figure 20. Mean density (+ se) of large, vulnerable reef fishes onsheltered and exposed reef slopes (10m) in the <strong>Solomon</strong> <strong>Islands</strong>.50density (per ha)40302010shelteredexposed0Central Choiseul Guadal Isabel Makira Malaita WesternProvince238
Fisheries Resources: Coral Reef FishesFigure 21. Mean density (+ se) of humphead wrasse on sheltered andexposed reef slopes (10m) in the <strong>Solomon</strong> <strong>Islands</strong>.density (per ha)76543210Central Choiseul Guadal Isabel Makira Malaita WesternProvinceshelteredexposedFigure 22. Mean density (+ se) of humphead parrotfish on sheltered andexposed reef slopes (10m) in the <strong>Solomon</strong> <strong>Islands</strong>.density (per ha)121086420Central Choiseul Guadal Isabel Makira Malaita WesternProvinceshelteredexposed239
<strong>Solomon</strong> <strong>Islands</strong> <strong>Marine</strong> <strong>Assessment</strong> Technical ReportFigure 23. Mean density (+ se) of brown-marbled grouper on sheltered andexposed reef slopes (10m) in the <strong>Solomon</strong> <strong>Islands</strong>.3density (per ha)21shelteredexposed0Central Choiseul Guadal Isabel Makira Malaita WesternProvinceFigure 24. Mean density (+ se) of camouflage grouper on sheltered andprotected reef slopes (10m) in the <strong>Solomon</strong> <strong>Islands</strong>.3density (per ha)21shelteredexposed0Central Choiseul Guadal Isabel Makira Malaita WesternProvince240
Fisheries Resources: Coral Reef FishesFigure 25. Mean biomass (+ se) of large, vulnerable reef fishes onsheltered and exposed reefs slopes (10m) in the <strong>Solomon</strong> <strong>Islands</strong>.biomass (kg/ha)30025020015010050shelteredexposed0Central Choiseul Guadal Isabel Makira Malaita WesternProvince241
<strong>Solomon</strong> <strong>Islands</strong> <strong>Marine</strong> <strong>Assessment</strong> Technical ReportFigure 26. Mean biomass (+ se) of humphead wrasse on sheltered andexposed reef slopes (10m) in the <strong>Solomon</strong> <strong>Islands</strong>.50biomass (kg/ha)40302010protectedexposed0Central Choiseul Guadal Isabel Makira Malaita WesternProvinceFigure 27. Mean biomass (+ se) of humphead parrotfish on sheltered andexposed reef slopes (10m) in the <strong>Solomon</strong> <strong>Islands</strong>.200biomass (kg/ha)15010050shelteredexposure0Central Choiseul Guadal Isabel Makira Malaita WesternProvince242
Fisheries Resources: Coral Reef FishesFigure 28. Mean biomass (+ se) of brown-marbled grouper on shelteredand exposed reef slopes (10m) in the <strong>Solomon</strong> <strong>Islands</strong>.biomass (kg/ha)5443322110Central Choiseul Guadal Isabel Makira Malaita WesternProvinceshelteredexposedFigure 29. Mean biomass (+ se) of camouflage grouper on sheltered andprotected reef slopes (10m) in the <strong>Solomon</strong> <strong>Islands</strong>.1.201.00biomass (kg/ha)0.800.600.400.20shelteredexposed0.00Central Choiseul Guadal Isabel Makira Malaita WesternProvince243
<strong>Solomon</strong> <strong>Islands</strong> <strong>Marine</strong> <strong>Assessment</strong> Technical ReportKEY FISHERIES SPECIES: AQUARIUM FISHESDensityDensity of aquarium fishes was highly variable among exposure, with no clear pattern apparent(Figure 30). Density was also highly variable among locations (provinces, islands, and sites),with the highest densities recorded in Isabel, Choiseul, Western, Makira, and Central (Russell<strong>Islands</strong>) Provinces, and with lower densities recorded Guadalcanal, Malaita and Central (Florida<strong>Islands</strong>) Provinces.The most abundant families of aquarium fishes were damselfishes, followed by wrasses,surgeonfishes, fairy basslets, butterflyfishes and angelfishes (Table 7). The most abundantspecies were a wrasse Cirrhilabrus punctatus, two species of damselfish (Chromis ternatensisand C. amboinensis), a surgeonfish (Acanthurus tuka), and a fairy basselet (Pseudanthias tuka),which each accounted for more than 5% of the total number counted (11%, 11%, 6%, 10% and10% respectively).Table 7. Relative densities of aquarium fish families in the <strong>Solomon</strong> <strong>Islands</strong>.FamilyCommonNameRelative Density(% of total)Pomacentridae Damselfishes 37.52Labridae Wrasses 22.13Acanthuridae Surgeonfishes 15.44Serranidae (Anthiinae) Fairy Basslets 12.57Chaetodontidae Butterflyfishes 5.14Pomacanthidae Angelfishes 2.93Balistidae Triggerfishes 1.69Haemulidae Sweetlips 1.17Cirrhitidae Hawkfishes 0.39Scaridae Parrotfishes 0.13Serranidae (Epinephelinae)TetraodontidaeGroupersPuffers0.080.06Monacanthidae Leatherjackets 0.04The key target species were much less abundant with anemonefishes accounting for only 0.4% ofthe total, and two species of angelfish (Pomacanthus navarchus and P. imperator) accounting for
Fisheries Resources: Coral Reef Fisheshighest densities of surgeonfishes were recorded at two sites in Choiseul (Site 21) and Western(Site 27) Provinces, with low to moderate densities recorded elsewhere (Figure 33), while thehighest density of fairy basslets was recorded in Western Province, followed by Central, Choiseuland Makira Provinces (Figure 34). No clear pattern of abundance was apparent for three of themain target families of aquarium fish, with a range of abundances recorded in each province(Figures 35-37).Different patterns were also apparent when some of the target species or species groups wereexamined individually. For example, anemonefishes were most abundant in Makira, followed byGuadalcanal, Central and Choiseul Provinces (Figure 38). While the blue-girdled angelfish(Pomacanthus navarchus) was only recorded in Central, Choiseul, Malaita, Western and IsabelProvinces (Figure 39), and the emperor angelfish (P. imperator) was only recorded in Choiseul,Guadalcanal and Isabel Provinces (Figure 40).REPTILES AND MAMMALSDensityOnly one dugong (Dugongidae, Dugong dugong) was observed during the long swim surveys inthe <strong>Solomon</strong> <strong>Islands</strong>. It was observed at Site 59 on the island of Malaita, and was estimated to be250cm in length.Eleven sea turtles were observed during the survey – four hawksbills, one green, and sixunidentified individuals (Table 8). Three turtles were observed in each of Isabel and ChoiseulProvinces, two in Central Province, and one in each of Western, Malaita and GuadalcanalProvinces. No crocodiles or cetaceans were recorded during the long swims.Table 8. Sea turtles observed on long swim surveys in the <strong>Solomon</strong> <strong>Islands</strong>.Province Site Species Size* NIsabel Isabel (Site 13) Unidentified 45 1Isabel Arnavon <strong>Islands</strong> (Site 15) Unidentified 60 1Isabel Arnavon <strong>Islands</strong> (Site 15) Unidentified 65 1Choiseul Choiseul (Site 22) Unidentified 35 1Choiseul Choiseul (Site 24) Unidentified 60 1Choiseul Choiseul (Site 24) Unidentified 65 1Western New Georgia (Site 33) Hawksbill (Eretmochelys imbricata) 50 1Central Russell <strong>Islands</strong> (Site 41) Hawksbill (Eretmochelys imbricata) 40 1Central Savo Island (Site 64) Hawksbill (Eretmochelys imbricata) 100 1Malaita Malaita (Site 53) Green (Chelonia mydas) 60 1Guadalcanal Guadalcanal (Site 65) Hawksbill (Eretmochelys imbricata) 100 1*Carapace length in cm.245
<strong>Solomon</strong> <strong>Islands</strong> <strong>Marine</strong> <strong>Assessment</strong> Technical Report1000009000080000700006000050000400003000020000100000Figure 30. Mean density (+ se) of reef fishes targeted by the aquarium trade on sheltered and exposed reefslopes (10m) in the <strong>Solomon</strong> <strong>Islands</strong>.Floridas (1)Floridas (2)Floridas (62)Floridas (63)Russells (38)Russells (39)Russells (40)Russells (41)Savo (64)Choiseul (17)Choiseul (18)Choiseul (19)Choiseul (20)Choiseul (21)Choiseul (22)Choiseul (23)Choiseul (24)Guadalcanal (42)Guadalcanal (43)Guadalcanal (65)Guadalcanal (66)Arnavons (15)Arnavaons (16)Isabel (3)Isabel (4)Isabel (5)Isabel (6)Isabel (7)Isabel (8)Isabel (9)Isabel (10)Isabel (11)Isabel (12)Isabel (13)Isabel (14)Makira (44)Makira (45)Makira (46)Makira (47)Three Sisters (48)Three Sisters (49)Ugi (50)Ugi (51)Maliata (52)Maliata (53)Malaita (54)Malaita (55)Malaita (56)Malaita (57)Malaita (58)Malaita (59)Malaita (60)Malaita (61)New Georgia (29)New Georgia (30)New Georgia (31)New Georgia (32)New Georgia (33)New Georgia (34)New Georgia (35)New Georgia (36)New Georgia (37)Shortlands (25)Shortlands (26)Shortlands (27)Shortlands (28)Central Choiseul Guadal Isabel Makira Malaita WesternProvinceshelteredexposeddensity (per ha)246
Fisheries Resources: Coral Reef Fishes9000080000700006000050000400003000020000100000Figure 31. Mean density (+ se) of damselfishes targeted by the aquarium trade on sheltered and exposedreef slopes (10m) in the <strong>Solomon</strong> <strong>Islands</strong>.Floridas (1)Floridas (2)Floridas (62)Floridas (63)Russells (38)Russells (39)Russells (40)Russells (41)Savo (64)Choiseul (17)Choiseul (18)Choiseul (19)Choiseul (20)Choiseul (21)Choiseul (22)Choiseul (23)Choiseul (24)Guadalcanal (42)Guadalcanal (43)Guadalcanal (65)Guadalcanal (66)Arnavons (15)Arnavaons (16)Isabel (3)Isabel (4)Isabel (5)Isabel (6)Isabel (7)Isabel (8)Isabel (9)Isabel (10)Isabel (11)Isabel (12)Isabel (13)Isabel (14)Makira (44)Makira (45)Makira (46)Makira (47)Three Sisters (48)Three Sisters (49)Ugi (50)Ugi (51)Maliata (52)Maliata (53)Malaita (54)Malaita (55)Malaita (56)Malaita (57)Malaita (58)Malaita (59)Malaita (60)Malaita (61)New Georgia (29)New Georgia (30)New Georgia (31)New Georgia (32)New Georgia (33)New Georgia (34)New Georgia (35)New Georgia (36)New Georgia (37)Shortlands (25)Shortlands (26)Shortlands (27)Shortlands (28)Central Choiseul Guadal Isabel Makira Malaita WesternProvinceshelteredexposeddensity (per ha)247
<strong>Solomon</strong> <strong>Islands</strong> <strong>Marine</strong> <strong>Assessment</strong> Technical Report14000.0012000.0010000.008000.006000.004000.002000.000.00Figure 32. Mean density (+ se) of wrasses targeted by the aquarium trade on sheltered and exposed reefslopes (10m) in the <strong>Solomon</strong> <strong>Islands</strong>.Floridas (1)Floridas (2)Floridas (62)Floridas (63)Russells (38)Russells (39)Russells (40)Russells (41)Savo (64)Choiseul (17)Choiseul (18)Choiseul (19)Choiseul (20)Choiseul (21)Choiseul (22)Choiseul (23)Choiseul (24)Guadalcanal (42)Guadalcanal (43)Guadalcanal (65)Guadalcanal (66)Arnavons (15)Arnavaons (16)Isabel (3)Isabel (4)Isabel (5)Isabel (6)Isabel (7)Isabel (8)Isabel (9)Isabel (10)Isabel (11)Isabel (12)Isabel (13)Isabel (14)Makira (44)Makira (45)Makira (46)Makira (47)Three Sisters (48)Three Sisters (49)Ugi (50)Ugi (51)Maliata (52)Maliata (53)Malaita (54)Malaita (55)Malaita (56)Malaita (57)Malaita (58)Malaita (59)Malaita (60)Malaita (61)New Georgia (29)New Georgia (30)New Georgia (31)New Georgia (32)New Georgia (33)New Georgia (34)New Georgia (35)New Georgia (36)New Georgia (37)Shortlands (25)Shortlands (26)Shortlands (27)Shortlands (28)Central Choiseul Guadal Isabel Makira Malaita WesternProvinceshelteredexposeddensity (per ha)248
Fisheries Resources: Coral Reef Fishes100009000800070006000500040003000200010000Figure 33. Mean density (+ se) of surgeonfishes targeted by the aquarium trade on sheltered and exposed reefslopes (10m) in the <strong>Solomon</strong> <strong>Islands</strong>.Floridas (1)Floridas (2)Floridas (62)Floridas (63)Russells (38)Russells (39)Russells (40)Russells (41)Savo (64)Choiseul (17)Choiseul (18)Choiseul (19)Choiseul (20)Choiseul (21)Choiseul (22)Choiseul (23)Choiseul (24)Guadalcanal (42)Guadalcanal (43)Guadalcanal (65)Guadalcanal (66)Arnavons (15)Arnavaons (16)Isabel (3)Isabel (4)Isabel (5)Isabel (6)Isabel (7)Isabel (8)Isabel (9)Isabel (10)Isabel (11)Isabel (12)Isabel (13)Isabel (14)Makira (44)Makira (45)Makira (46)Makira (47)Three Sisters (48)Three Sisters (49)Ugi (50)Ugi (51)Maliata (52)Maliata (53)Malaita (54)Malaita (55)Malaita (56)Malaita (57)Malaita (58)Malaita (59)Malaita (60)Malaita (61)New Georgia (29)New Georgia (30)New Georgia (31)New Georgia (32)New Georgia (33)New Georgia (34)New Georgia (35)New Georgia (36)New Georgia (37)Shortlands (25)Shortlands (26)Shortlands (27)Shortlands (28)Central Choiseul Guadal Isabel Makira Malaita WesternProvinceshelteredexposeddensity (per ha)249
<strong>Solomon</strong> <strong>Islands</strong> <strong>Marine</strong> <strong>Assessment</strong> Technical Report20000.0018000.0016000.0014000.0012000.0010000.008000.006000.004000.002000.000.00Figure 34. Mean density (+ se) of fairy basslets targeted by the aquarium trade on sheltered and exposedreef slopes (10m) in the <strong>Solomon</strong> <strong>Islands</strong>.Floridas (1)Floridas (2)Floridas (62)Floridas (63)Russells (38)Russells (39)Russells (40)Russells (41)Savo (64)Choiseul (17)Choiseul (18)Choiseul (19)Choiseul (20)Choiseul (21)Choiseul (22)Choiseul (23)Choiseul (24)Guadalcanal (42)Guadalcanal (43)Guadalcanal (65)Guadalcanal (66)Arnavons (15)Arnavaons (16)Isabel (3)Isabel (4)Isabel (5)Isabel (6)Isabel (7)Isabel (8)Isabel (9)Isabel (10)Isabel (11)Isabel (12)Isabel (13)Isabel (14)Makira (44)Makira (45)Makira (46)Makira (47)Three Sisters (48)Three Sisters (49)Ugi (50)Ugi (51)Maliata (52)Maliata (53)Malaita (54)Malaita (55)Malaita (56)Malaita (57)Malaita (58)Malaita (59)Malaita (60)Malaita (61)New Georgia (29)New Georgia (30)New Georgia (31)New Georgia (32)New Georgia (33)New Georgia (34)New Georgia (35)New Georgia (36)New Georgia (37)Shortlands (25)Shortlands (26)Shortlands (27)Shortlands (28)Central Choiseul Guadal Isabel Makira Malaita WesternProvinceshelteredexposeddensity (per ha)250
Fisheries Resources: Coral Reef Fishes10009008007006005004003002001000Figure 35. Mean density (+ se) of butterflyfishes targeted by the aquarium trade on sheltered and exposedreef slopes (10m) in the <strong>Solomon</strong> <strong>Islands</strong>.Floridas (1)Floridas (2)Floridas (62)Floridas (63)Russells (38)Russells (39)Russells (40)Russells (41)Savo (64)Choiseul (17)Choiseul (18)Choiseul (19)Choiseul (20)Choiseul (21)Choiseul (22)Choiseul (23)Choiseul (24)Guadalcanal (42)Guadalcanal (43)Guadalcanal (65)Guadalcanal (66)Arnavons (15)Arnavaons (16)Isabel (3)Isabel (4)Isabel (5)Isabel (6)Isabel (7)Isabel (8)Isabel (9)Isabel (10)Isabel (11)Isabel (12)Isabel (13)Isabel (14)Makira (44)Makira (45)Makira (46)Makira (47)Three Sisters (48)Three Sisters (49)Ugi (50)Ugi (51)Maliata (52)Maliata (53)Malaita (54)Malaita (55)Malaita (56)Malaita (57)Malaita (58)Malaita (59)Malaita (60)Malaita (61)New Georgia (29)New Georgia (30)New Georgia (31)New Georgia (32)New Georgia (33)New Georgia (34)New Georgia (35)New Georgia (36)New Georgia (37)Shortlands (25)Shortlands (26)Shortlands (27)Shortlands (28)Central Choiseul Guadal Isabel Makira Malaita WesternProvinceshelteredexposeddensity (per ha)251
<strong>Solomon</strong> <strong>Islands</strong> <strong>Marine</strong> <strong>Assessment</strong> Technical Report8007006005004003002001000Figure 36. Mean density (+ se) of angelfishes targeted by the aquarium trade on sheltered and exposed reefslopes (10m) in the <strong>Solomon</strong> <strong>Islands</strong>.Floridas (1)Floridas (2)Floridas (62)Floridas (63)Russells (38)Russells (39)Russells (40)Russells (41)Savo (64)Choiseul (17)Choiseul (18)Choiseul (19)Choiseul (20)Choiseul (21)Choiseul (22)Choiseul (23)Choiseul (24)Guadalcanal (42)Guadalcanal (43)Guadalcanal (65)Guadalcanal (66)Arnavons (15)Arnavaons (16)Isabel (3)Isabel (4)Isabel (5)Isabel (6)Isabel (7)Isabel (8)Isabel (9)Isabel (10)Isabel (11)Isabel (12)Isabel (13)Isabel (14)Makira (44)Makira (45)Makira (46)Makira (47)Three Sisters (48)Three Sisters (49)Ugi (50)Ugi (51)Maliata (52)Maliata (53)Malaita (54)Malaita (55)Malaita (56)Malaita (57)Malaita (58)Malaita (59)Malaita (60)Malaita (61)New Georgia (29)New Georgia (30)New Georgia (31)New Georgia (32)New Georgia (33)New Georgia (34)New Georgia (35)New Georgia (36)New Georgia (37)Shortlands (25)Shortlands (26)Shortlands (27)Shortlands (28)Central Choiseul Guadal Isabel Makira Malaita WesternProvinceshelteredexposeddensity (per ha)252
Fisheries Resources: Coral Reef Fishes250200150100500Figure 37. Mean density (+ se) of hawkfishes targeted by the aquarium trade on sheltered and exposedreef slopes (10m) in the <strong>Solomon</strong> <strong>Islands</strong>.Floridas (1)Floridas (2)Floridas (62)Floridas (63)Russells (38)Russells (39)Russells (40)Russells (41)Savo (64)Choiseul (17)Choiseul (18)Choiseul (19)Choiseul (20)Choiseul (21)Choiseul (22)Choiseul (23)Choiseul (24)Guadalcanal (42)Guadalcanal (43)Guadalcanal (65)Guadalcanal (66)Arnavons (15)Arnavaons (16)Isabel (3)Isabel (4)Isabel (5)Isabel (6)Isabel (7)Isabel (8)Isabel (9)Isabel (10)Isabel (11)Isabel (12)Isabel (13)Isabel (14)Makira (44)Makira (45)Makira (46)Makira (47)Three Sisters (48)Three Sisters (49)Ugi (50)Ugi (51)Maliata (52)Maliata (53)Malaita (54)Malaita (55)Malaita (56)Malaita (57)Malaita (58)Malaita (59)Malaita (60)Malaita (61)New Georgia (29)New Georgia (30)New Georgia (31)New Georgia (32)New Georgia (33)New Georgia (34)New Georgia (35)New Georgia (36)New Georgia (37)Shortlands (25)Shortlands (26)Shortlands (27)Shortlands (28)Central Choiseul Guadal Isabel Makira Malaita WesternProvinceshelteredexposeddensity (per ha)253
<strong>Solomon</strong> <strong>Islands</strong> <strong>Marine</strong> <strong>Assessment</strong> Technical ReportFigure 38. Mean density (+ se) of anenomefishes targeted by theaquarium trade on sheltered and exposed reef slopes (10m) in the <strong>Solomon</strong><strong>Islands</strong>.600density (per ha)500400300200100shelteredexposed0Central Choiseul Guadal Isabel Makira Malaita WesternProvince254
Fisheries Resources: Coral Reef FishesFigure 39. Mean density (+ se) of the blue-girdled angelfish targeted bythe aquarium trade on sheltered and exposed reef slopes (10m) in the<strong>Solomon</strong> <strong>Islands</strong>.20density (per ha)15105shelteredexposed0Central Choiseul Guadal Isabel Makira Malaita WesternProvinceFigure 40. Mean density (+ se) of the emperor angelfish targeted by theaquarium trade on sheltered and exposed reef slopes (10m) in the <strong>Solomon</strong><strong>Islands</strong>.density (per ha)302520151050Central Choiseul Guadal Isabel Makira Malaita WesternProvinceshelteredexposed255
<strong>Solomon</strong> <strong>Islands</strong> <strong>Marine</strong> <strong>Assessment</strong> Technical ReportDiscussionThis survey represents the first broad scale, quantitative survey of coral reef fish communities andfisheries resources conducted in the <strong>Solomon</strong> <strong>Islands</strong>. The results will contribute to ourunderstanding of the status of reef fish resources, which provide an important resource for thepeople of the <strong>Solomon</strong> <strong>Islands</strong>.The results suggest that overfishing of reef fish populations may be occurring in some provinces,particularly in Guadalcanal, Malaita and Central (Florida <strong>Islands</strong>) Provinces. Given the rapidlyrising population in the <strong>Solomon</strong> <strong>Islands</strong>, this problem may become more serious and widespreadin future. These results will help provide a scientific basis for the National Government to reviewthe status of key fisheries species (food and aquarium fishes), and for reassessing managementarrangements for these fisheries.The following is a summary of the results of the survey, and management recommendations forthe future.CORAL REEF FISH COMMUNITIESA total of 37 families and 383 species were counted during this survey. Since this study focusedon one habitat only (reef slopes at 10m), and did not include nocturnal and cryptic species that arenot amenable to visual census techniques, the survey included 45% and 38% of the total numberof families and species recorded in the <strong>Solomon</strong> <strong>Islands</strong> respectively, and 49% of the speciesobserved during the <strong>Solomon</strong> <strong>Islands</strong> <strong>Marine</strong> <strong>Assessment</strong> (82 families and 1019 species havebeen recorded for the <strong>Solomon</strong> <strong>Islands</strong>, of which 786 species were observed this survey: seeCoral Reef Fish Diversity this report). The most abundant families were damselfishes, fusiliers,surgeonfishes, snappers and wrasses, followed by fairy basslets, parrotfishes and emperors.There was a high degree in variability among coral reef fish communities both within and amongprovinces. In general, the coral reef fish communities were in good condition (in terms of fishspecies richness, density and biomass) throughout most of the <strong>Solomon</strong> <strong>Islands</strong>, with those in theCentral (Russell <strong>Islands</strong> and Savo Island), Choiseul, Isabel (particularly the Arnavon <strong>Islands</strong>),Makira (particularly the offshore islands of Three Sisters and Ugi), and Western Provinces (bothNew Georgia and the Shortland <strong>Islands</strong>), tending to be in better condition than those inGuadalcanal, Malaita and Central (Florida <strong>Islands</strong>) Provinces (Table 9). Similar patterns on thestatus of coral reef communities were recorded for other key components of these habitats (seeCoral Communities and Reef Health this report, and Benthic Communities this report).The reasons for the varying status of coral reef fish communities throughout the <strong>Solomon</strong> <strong>Islands</strong>cannot be determined with certainty, due to the lack of previous surveys for the area. However,the variation at the site level (within provinces and islands), is most likely due to the variation inthe coral reef habitat at each site, which is quite variable and ranges from low to high on mostislands or island groups (see Coral Communities and Reef Health this report, and BenthicCommunities this report). Some of the variation among provinces is also likely to be due to theimpact of human activities, particularly fishing, on reef fish populations (see below).256
Fisheries Resources: Coral Reef FishesTable 9. Species richness, density and biomass of coral reef fish communities in each major island orisland group surveyedProvince Island orIsland GroupSpecies Richness(per transect)Density(per ha)Biomass(kg/ha)Central Russell <strong>Islands</strong> High Medium-High Low-MediumFlorida <strong>Islands</strong> Medium Low-High LowSavo Island High High LowChoiseul Choiseul Medium-High Medium-High Low-MediumGuadalcanal Guadalcanal Low-Medium Low-Medium LowIsabel Isabel Medium-High Low-High Low-MediumArnavon <strong>Islands</strong> High Medium-High Low-MediumMakira Makira Medium-High Low-Medium Low-MediumThree Sisters <strong>Islands</strong> High Medium-High LowUgi Island High Medium-High LowMalaita Malaita Low-Medium Low-Medium Low-HighWestern* New Georgia Medium-High Medium-High Low-MediumShortland <strong>Islands</strong> Medium-High Medium Low-HighWhere: High, medium and low species richness equal >40, 20-40, and 60,000, 20-60,000, and 15,000, 5-15,000, and
<strong>Solomon</strong> <strong>Islands</strong> <strong>Marine</strong> <strong>Assessment</strong> Technical ReportIn contrast, the variation in food fish populations among provinces or major islands or islandgroups, may be due to a combined effect of the variation in coral reef habitat and the impact ofhuman activities, particularly fishing. This is likely because the healthiest populations of foodfishes (with medium to high densities and biomass) were observed in areas with small humanpopulations, while those in worse condition (where only low densities and biomass wererecorded) were located in or close to the most heavily populated areas in Guadalcanal andMalaita, including areas where the coral reef communities were otherwise healthy such as MarauSound on Guadalcanal, the Three Sisters <strong>Islands</strong> and Ugi Island in Makira Province, and SavoIsland in Central Province. The healthy condition of the food fish populations at one site onnorthwest side of Makira may be due in part to the protection afforded by the weather conditionson the exposed coastline.A high human population implies high fishing pressure on reef fish stocks and other marineresources. Two provinces, Guadalcanal and Malaita, host the two largest populated urban centersin the <strong>Solomon</strong> <strong>Islands</strong> - Honiara and Auki respectively. The demand for reef fish in these areas ishigh and expected to increase as these urban areas grow. Unlike other provinces such as theWestern, Isabel or Choiseul, which have large extensive coral reef systems and therefore largerunit areas of coral reef per number of people, both Malaita (excluding Ontong Java) andGuadalcanal have less extensive reef systems or small reef area per number of people. With thepresent high population levels of these provinces, the level of fishing pressure on reef fish stocksand other marine resources may already be too high, particularly in places like Langa Langa andLau Lagoons on Malaita, and Marau Sound on Guadalcanal.While it is easy to monitor the amount of catch that goes through provincial fisheries centres andmarine product buyers in urban areas like Honiara, Auki or Gizo, the largest portion goesunmonitored through public fish markets in urban areas and private sales. For example, there isno information on how much reef fish is going through the Honiara public fish market every year,although it is known that catches from nearby areas like the Florida <strong>Islands</strong> and Marau Soundmake up a large proportion of the sales (P. Ramohia pers. obs.). Furthermore, a great volume offish is consumed by fishers for subsistence purposes and never enters a market. During thissurvey, low densities and biomass have been recorded for reef food fishes in the Florida <strong>Islands</strong>,Marau Sound and other locations close to these urban areas, but whether this is due to highfishing effort to meet the high fish demand in Honiara or not is unknown due to a lack of baselineinformation for these areas. Appropriate steps need to be taken by the DFMR and Honiara CityCouncil to monitor this situation in future.258
Fisheries Resources: Coral Reef FishesTable 10. Density and biomass of bony food fishes in each province and major island or island groupsurveyed.Province Island or Island Group Density (per ha) Biomass (kg/ha)Central Russell <strong>Islands</strong> Low-High Low-HighFlorida <strong>Islands</strong> Low LowSavo Island Low LowChoiseul Choiseul Low-High Low-MediumGuadalcanal Guadalcanal Low LowIsabel Isabel Low-High Low-MediumArnavon <strong>Islands</strong> Medium-High Low-HighMakira Makira Low-Medium Low-HighThree Sisters <strong>Islands</strong> Low LowUgi Island Low LowMalaita Malaita Low LowWestern* New Georgia Medium-High Low-HighShortland <strong>Islands</strong> Medium-High Low-HighWhere: High, medium and low densities equal >15,000, 5-15,000, and 5,000, 2-5,000, and30cm) were recorded in Western,Isabel, Makira, Central and Choiseul Provinces, with less recorded in Guadalcanal or MalaitaProvince. The high densities and biomass recorded in some provinces were due to high densities ofsnappers, emperors, parrotfishes, drummers and emperor at some sites.Large and vulnerable reef fish species, particularly those targeted by the live reef food fish trade(LRFFT: humphead wrasse, humphead parrotfish, and large groupers) were uncommon or rarethroughout the survey area. Humphead wrasses and humphead parrotfishes were uncommonthroughout the survey area, with the highest densities and biomass recorded in Choiseul andWestern Provinces. Large groupers (brown-marbled grouper, camouflage grouper and squaretailcoral grouper) were rare throughout the survey area, as were barramundi cod, giant trevally,sharks and rays. Large and vulnerable emperor species were most abundant in Makira, Choiseul,and Isabel Provinces.The low densities and biomass of large reef fishes in some locations is of major concern, sincethey are particularly vulnerable to overfishing. Species targeted by the LRFFT form spawningaggregation at specific locations, which are particularly vulnerable to overfishing if their locationis known and unprotected. In the past, known spawning aggregations have been targeted by theLRFFT in some parts of the country such as Marovo Lagoon, Roviana Lagoon and Ontong Java.The adverse effect of this fishing practice has now been recognised, and a Management Plan hasbeen developed (but not yet implemented) by the DFMR, with the aim of managing this fisheryfor conservation and long term sustainable production. Because the LRFFT activities were moreor less localised at these locations and ceased some years prior to this survey, it is difficult to saywhether the low densities and biomass recorded for these species in the study area is related topast fishing activities or other factors. However, the higher density and biomass recorded in theACMCA for some grouper species could be attributed to the effect of more than 10 years ofprotection. Protecting spawning aggregations of key target species is crucial to the long termsustainability of these species, and important spawning aggregation sites should be identified and259
<strong>Solomon</strong> <strong>Islands</strong> <strong>Marine</strong> <strong>Assessment</strong> Technical Reportprotected through relevant national or provincial laws, and reinforced at the local communitylevel.Target species like parrotfishes and surgeonfishes, including large and vulnerable species such asthe humphead parrotfish, humphead wrasse or large groupers, are also extremely vulnerable tonight spear fishing (Hamilton 2003, Hamilton et al., 2005) and gill netting. These species aregood indicators of high fishing pressure and the fact that some species are absent or only presentin low densities or biomass in some areas suggests that these stocks may have been overexploited.Though the true extent of their use in the country is unknown, gill netting and night spear fishingare very popular in the <strong>Solomon</strong> <strong>Islands</strong>, and it will be difficult to control the use of thesemethods without intervention at the national or provincial levels and cooperation at the localcommunity level.KEY FISHERIES SPECIES: AQUARIUM FISHESHealthy populations of aquarium fishes (medium to high densities) were encountered in somelocations in this study, particularly in Central (Russell <strong>Islands</strong> and Savo Island), Choiseul, Isabel,Makira (particularly Three Sisters <strong>Islands</strong> and Ugi Island), and Western Provinces (New Georgiaand Shortland <strong>Islands</strong>: Table 11). In contrast, only low densities of aquarium populations ofaquarium fishes were encountered in Guadalcanal and Malaita Provinces, and some locations inCentral (Florida <strong>Islands</strong>), Makira (Makira Island) and Isabel (Arnavon <strong>Islands</strong>) Provinces.The most abundant families were damselfishes, wrasses, surgeonfishes and fairy basslets, whichaccounted for most of the variation among sites, while other target families (butterflyfishes,angelfishes and hawkfishes) were less abundant. Key target species such as anemonefishes, bluegirdledangelfish, and emperor angelfish, were uncommon or rare throughout the survey area.However, two other key target species, the blue devil and blue tang, were not included in thissurvey, since they tend to occur in habitat types and depths not included in the study (see Myers1999).Harvesting of aquarium species for the Aquarium Trade started in the <strong>Solomon</strong> <strong>Islands</strong> in 1996(Kinch, 2004a). The Florida <strong>Islands</strong>, Marau Sound and Rarumana (Kinch 2004a,b) are the maincollection sites for this Trade, and this survey confirmed that the densities of aquarium fishes arelow in these areas. Whether this is a natural situation or due to overexploitation is not clear sincethere is no baseline data for these areas. However, overexploitation of aquarium fishes(particularly key target species) should be of concern, particularly in locations close to urbanareas in Guadalcanal and Malaita. This may be even more important in future if the demand foraquarium species increases.260
Fisheries Resources: Coral Reef FishesTable 11. Density of aquarium fish species in each province and major island or island group surveyed.Province Island or Island Group Density (per ha)Central Russell <strong>Islands</strong>Low-MediumFlorida <strong>Islands</strong>LowSavo IslandMediumChoiseul Choiseul Low-HighGuadalcanal Guadalcanal LowIsabel IsabelLow-MediumArnavon <strong>Islands</strong>LowMakira MakiraLowThree Sisters <strong>Islands</strong> Medium-HighUgi IslandMediumMalaita Malaita LowWestern* New GeorgiaLow-HighShortland <strong>Islands</strong>MediumWhere: High, medium and low densities equal >40,000, 20-40,000, and
<strong>Solomon</strong> <strong>Islands</strong> <strong>Marine</strong> <strong>Assessment</strong> Technical ReportEvidence of blast fishing was also noted in Langa Langa Lagoon on Malaita and in the Florida<strong>Islands</strong> during this survey. Blast fishing is very destructive, because it is a highly effectivemethod for harvesting reef fishes and it damages the coral reef habitat. This method is prohibitedin the <strong>Solomon</strong> <strong>Islands</strong> by the Fisheries Act 1998. However, enforcement of FisheriesRegulations is difficult, due to the large area and lack of manpower and resources at both theNational and Provincial levels. For that reason, education and awareness programs may be moreeffective at addressing this problem.Effective management of coral reef fish fisheries will not only ensure the long term sustainabilityof these resources for the people of the <strong>Solomon</strong> <strong>Islands</strong>, it will also allow the country to betterappreciate the full potential and benefits that these fisheries can provide in the long term. Humanactivities affect the density and biomass of coral reef fishes and their habitat. Habitat features mayin turn affect abundance of key fisheries species. Therefore, ensuring the long term sustainabilityof these habitats and associated resources should be one of our primary responsibilities.Based on these considerations, and the results of this study, we recommend that the NationalGovernment seriously consider taking appropriate action to:1. Ban the use of highly efficient and destructive fishing methods, particularly gillnets andnight spear fishing;2. Undertake a nationwide education and awareness program to help fishermen understandthe importance of conservation and management of fisheries resources, and the importanthabitats these resources depend on for their well being;3. Implement a vigorous education and awareness program on blast fishing targeted towardsensuring that young people understand the effect of these methods on marine resourcesand their habitats, and that this activity is prohibited and penalties apply for breachingthis law;4. Recruit more enforcement officers to work closely with other law enforcement agencies(eg Police, Customs and Immigration) and rural fishing communities to monitor andenforce fisheries laws and regulations;5. Facilitate and support the establishment of <strong>Marine</strong> Protected Areas to protect keyfisheries species (food and aquarium fishes);6. Protect large and vulnerable fish species (humphead wrasse and large groupers) throughthe protection of fish spawning aggregation sites, and the implementation of the NationalManagement and Development Plan for the Live Reef Food Fish Fishery;7. Develop Management and Development Plans for other food fishes and the AquariumIndustry;8. Speed-up the appointment and establishment of the Fishery Advisory Council as providedfor under the Fisheries Act 1998, to ensure proper Fisheries Management andDevelopment Plans are implemented; and9. Develop alternative offshore fisheries such as raft fishing for tuna, squid fishing and deepwater snapper fishing to ease fishing pressure on the inshore resources.This survey has also provided the basis for the long term monitoring of reef fish resources.However, information on the levels of subsistence use is still lacking. To gain a betterappreciation of the status of reef fin-fish fishery in the country, information on subsistenceharvest is required. Therefore, we recommend that the government and other stakeholders likenon-governmental organizations and local communities should work together to come up withways of monitoring reef fish resources and their use in subsistence and artisanal fisheries in the<strong>Solomon</strong> <strong>Islands</strong>.262
Fisheries Resources: Coral Reef FishesAcknowledgementsWe thank Alec Hughes for being an important member of the coral reef fish survey team. Withouthis help, it would not be possible to collect data for this study. We also thank Dr. RichardHamilton who reviewed and edited an earlier draft of this report. We also thank Captain RussellSlater and crew of the FeBrina as well as the rest of <strong>Solomon</strong> <strong>Islands</strong> <strong>Marine</strong> <strong>Assessment</strong> team.This study would not have been possible without you. The Nature Conservancy funded andsupported this study.263
<strong>Solomon</strong> <strong>Islands</strong> <strong>Marine</strong> <strong>Assessment</strong> Technical ReportReferencesAllen, G.R., Steene, R., Humann, P., Deloach, N. 2003 Reef Fish Identification. Tropical Pacific.New World Publications, 470 pp.Aswani, S. (1998). Patterns of marine harvest effort in South western New Georgia, <strong>Solomon</strong><strong>Islands</strong>: resource management or optimal foraging? Ocean and Coastal Management 40:207-235.Bell, J., Doherty, P., Hair, C. 1999 The capture and culture of postlarval coral reef fish: potentialfor new artisanal fisheries. SPC Live Reef Fish Information Bulletin 6:31-34.Blaber, S. J. M., Milton, D. A., Rawlinson, N. J. F., Tiroba, G., Nichols, P. V. 1990a Reef fishand fisheries in <strong>Solomon</strong> <strong>Islands</strong> and Maldives and their interaction with baitfisheries. In:Tuna Baitfishing in the Indo-Pacific Region (eds S. J. M. Blaber and J. W. Copland),ACIAR Proceedings No.30, pp. 159-168.Blaber, S. J. M., Milton, D. A., Rawlinson, N. J. F. 1990b Diets of the fishes of the <strong>Solomon</strong><strong>Islands</strong>: predators of tuna baitfish and trophic effects of baitfishing on the subsistencefishery. Fisheries Research 8, 263- 286.Blaber, S. J. M., Milton, D. A., Rawlinson, N. J. F. 1991 A checklist of fishes recorded by thebaitfish research project in <strong>Solomon</strong> <strong>Islands</strong>. CSIRO <strong>Marine</strong> Laboratories. Report 212.Australia.Cole, R. G. 1994 Fishes of Rennell Island and Indispensable Reefs, Pp 99-124 in R. C. Babcock(ed.) <strong>Marine</strong> Resources of Rennell Island and Indispensable Reef. University of AucklandLeigh <strong>Marine</strong> Laboratory, New Zealand.Choat, H., Pears, R. 2003 A rapid, quantitative survey method for large, vulnerable reef fishes. In:Wilkinson, C., Green, A., Almany, J., and Dionne, S. Monitoring Coral Reef <strong>Marine</strong>Protected Areas. A Practical Guide on How Monitoring Can support EffectiveManagement MPAs. Australian Institute of <strong>Marine</strong> Science and the IUCN <strong>Marine</strong>Program Publication. 68pp.Donelly, R.J. 2000 Socio-economic environment and the effect of the Live Reef Food Fish Tradein Marovo Lagoon, Roviana Lagoon and Ontong Java, <strong>Solomon</strong> <strong>Islands</strong>. DiscussionPaper No. 5. Report to Australian Centre for International Agricultural Research(ACIAR). Canberra, 81pp.Donelly, R. J., Davis, D. C, Lam, M. 2000 Socio-economic and biological aspects of the LiveReef Food Fish Trade and its development in <strong>Solomon</strong> <strong>Islands</strong>. Discussion Paper No. 1.Report to Australian Centre for International Agricultural Research (ACIAR). Canberra,51pp.Gillett, R., Lightfoot, C. 2002 The contribution of fisheries to the economies of Pacific IslandCountries. Pacific Studies Series, Asian Development Bank, World Bank, ForumFisheries Agency, Secretariat of the Pacific Community, 218 pp.Hair, C., Doherty, P. 2004 Development of a new fisheries based on the capture and culture ofpost-larval coral reef fish: Extension Report. Final Report for the Australian Centre forthe International Agriculture Research, Sydney, NSW, Australia.Hair, C., Bell, J., Doherty, P. 2002 The use of wild-caught juveniles in coastal aquaculture and itsapplication to coral reef fishes. In Stickney, R. and McVey, J(eds). Responsible <strong>Marine</strong>Aquaculture. Pp: 327-353. New York: CAB International.Hamilton, R. 2003 The role of indigenous knowledge in depleting a limited resource: a case studyof the bumphead parrotfish (Bolbometopon muricatum) artisanal fishery in RovianaLagoon, Western Province, <strong>Solomon</strong> <strong>Islands</strong>. Putting Fishers’ Knowledge to WorkConference Proceedings, August 27-30, 2001. University of British Colombia FisheriesCentre Research Reports. 11(1): 68-77.264
Fisheries Resources: Coral Reef FishesHamilton, R.J. (2004) The demographics of Bumphead Parrotfish (Bolbometopon muricatum) inlightly and heavily fished regions of the Western <strong>Solomon</strong> <strong>Islands</strong>. PhD thesis, Universityof Otago, Dunedin, New Zealand.Hamilton, R. 2005 Indigenous ecological knowledge of the aggregating and nocturnal spawningbehaviour of the longfin emperor, Lethrinus erythropterus. SPC Traditional <strong>Marine</strong>Resource Management and knowledge information Bulletin 18: 9-17.Hamilton, R., Matawai, M., Potuku, T., Kama, W., Lahui, P., Warku, J., Smith, A 2005 Applyinglocal knowledge and science to the management of grouper aggregation sites inMelanesia. SPC Live Reef Fish Information Bulleting 14: 7-19.Johannes, R. E. 1989 Spawning aggregations of the group Plectropomus areolatus (Ruppell) inthe <strong>Solomon</strong> <strong>Islands</strong>. p. 751-755 (vol. 2). In: Choat, J. H. et al. (eds). Proceedings of the6th International Coral Reef Symposium, Townsville, 8-12 August.Johannes, RE (1997). Grouper spawning aggregations need protection. SPC Live Reef FishInformation Bulletin 3: 13-14.Johannes, R. E., Hviding, E. 2001 Traditional knowledge possessed by the fishers of MarovoLagoon, <strong>Solomon</strong> <strong>Islands</strong>, concerning fish aggregation behaviour. SPC Traditional<strong>Marine</strong> Resource Management and Knowledge Information Bulletin 12: 22-29.Johannes, R. E., Freeman, M. R., Hamilton, R. 2000 Ignore fishers’ knowledge and miss the boat.Fish and Fisheries 1: 257-257Kile, N. 2000 <strong>Solomon</strong> <strong>Islands</strong> <strong>Marine</strong> Resources Overview. Pacific Economic Bulletin 15(1):143-147.Kile, N., Lam, M., Davis, D. C., Donnelly, R. J. 2000 Managing the Live Reef Food Fish Tradein <strong>Solomon</strong> <strong>Islands</strong>: the Role of Village Decision-making Systems in Ontong Java,Roviana and Marovo Lagoons. Discussion Paper No. 2. Report to Australian Centre forInternational Agricultural Research (ACIAR). Canberra, 28pp.Kinch, J. 2004a The <strong>Marine</strong> Aquarium Trade in the <strong>Solomon</strong> <strong>Islands</strong>, with specific notes onMarau Sound, Guadalcanal. A report prepared for the <strong>Marine</strong> Aquarium Council and theFoundation of the Peoples of the South Pacific International, Suva, Fiji.Kinch, J. 2004b The <strong>Marine</strong> Aquarium Trade in the <strong>Solomon</strong> <strong>Islands</strong>, with specific notes onRarumana, Vona Vona Lagoon, Western Province. A report prepared for the <strong>Marine</strong>Aquarium Council and the Foundation of the Peoples of the South Pacific International,Suva, Fiji.Leqata, J.L., Rawlinson, N.J.F., Nichols, P.V., Tiroba, G. 1990 Subsistence fishing in <strong>Solomon</strong><strong>Islands</strong> and the possible conflict with commercial baitfishing. In: Blaber S.J.M. andCOPLAND J.W. eds 1990. - Tuna baitfish in the Indo-Pacific region etc. AustralianCentre for International Agricultural Research (ACIAR) Proceedings No. 30: 169-178.Leqata, J, Oreihaka, E. 1995 Application of underwater visual census to assessing coral reef fishstocks in the Tropical Pacific. A report prepared for the Fisheries Division and theAustralian Centre for International Agricultural Research (ACIAR), Project #9304.Honiara, <strong>Solomon</strong> <strong>Islands</strong>. 50pp.Myers, R. F. 1999 Micronesian Reef Fishes. A comprehensive guide to the coral reef fishes ofMicronesia. Coral Graphics Publications, 330pp.McGrouther M.A., 1999 Report on the 1998 marine fish survey of the Santa Cruz Group,<strong>Solomon</strong> <strong>Islands</strong>, conducted by the Australian Museum, Smithsonian Institution, FieldMuseum of Natural History, Milwaukee Public Museum and <strong>Solomon</strong> <strong>Islands</strong> Fisheries.Unpublished report 57p. Mark McGrouther, Australian Museum 6 College Street,Sydney, Australia (markm@amsg.austmus.gov.au).Oreihaka, E., Ramohia, P. 2000 The status of Inshore Fisheries Project funded by ObFCF: statusof the fishery and its management. A report prepared for the Division of Fisheries and<strong>Marine</strong> Resources, Ministry of Natural Resources, Honiara, the <strong>Solomon</strong> <strong>Islands</strong>.265
<strong>Solomon</strong> <strong>Islands</strong> <strong>Marine</strong> <strong>Assessment</strong> Technical ReportRichards, A. H., Bell, L.J., Bell, J.D. 1994 Inshore fisheries resources of <strong>Solomon</strong> <strong>Islands</strong>. <strong>Marine</strong>Pollution Bulletin 29(1-3): 90-98.Russell, D., Buga, B. 2004 Marketing Unit: Final Report. A Report prepared for the <strong>Solomon</strong><strong>Islands</strong> Government and the European Union’s Rural Fishing Enterprise Project, Phase 3,Honiara, the <strong>Solomon</strong> <strong>Islands</strong>.Sadovy Y.J. & Vincent A.C.J. (2002). The trades in live reef fishes for food and aquaria: issuesand impacts. In: Sale PF, editor. Coral reef fishes. Dynamics and diversity in a complexecosystem. Academic Press, San Diego, p 391-420.Samoilys, M., Fuentes, H., Tuwai, I., Tikomainiusiladi, B., Leqata, J., Oreihaka, E., Mobiha, A.,Potuku, T., Die, D., Connell, S., Lincoln-Smith, M., Wilson, M & Watson, R. (1995).Application of underwater visual census to assessing coral reef fish stocks in the tropicalpacific. Project Number 9304. Department of Primary Industries, Queensland.266
Fisheries Resources: Coral Reef FishesAppendix 1. Families and species recorded in the survey of coral reef resources in the <strong>Solomon</strong> <strong>Islands</strong>, andconstants used to convert size (length) to biomass (based on Kulbicki unpubl. data)biomass constant biomass constantFamilyGenus and SpeciesabACANTHURIDAE Acanthurus blochii 0.280526155 3.106776812Acanthurus fowleri 0.294117647 3.039513678Acanthurus lineatus 0.294117647 3.039513678Acanthurus mata 0.28217182 3.007953028Acanthurus nigricans 0.338180588 2.865329513Acanthurus nigricauda 0.294117647 3.039513678Acanthurus nigrofuscus 0.300687673 3.029210679Acanthurus nubilis 0.282485876 3.012048193Acanthurus olivaceus 0.294117647 3.039513678Acanthurus pyroferus 0.294117647 3.039513678Acanthurus thompsoni 0.294811321 3.034901366Acanthurus xanthopterus 0.234991117 3.266404701Acanthurus spp. 0.294117647 3.039513678Ctenochaetus binotatus 0.289855072 3.105590062Ctenochaetus cyanocheilus 0.297619048 3.039513678Ctenochaetus striatus 0.296785222 3.031745406Ctenochaetus tominiensis 0.297619048 3.039513678Zebrasoma scopas 0.332530826 2.845759818Zebrasoma veliferum 0.296525609 2.918327682Naso brevirostris 0.24935666 3.224683014Naso hexacanthus 0.257731959 3.067484663Naso lituratus 0.257731959 3.067484663Naso unicornis 0.262352197 3.05587048Naso spp. 0.261780105 3.058103976AULOSTOMIDAE Aulostomus chinensis 0.068965517 4.545454545BALISTIDAE Balistapus undulatus 0.290275762 2.895193978Balistoides conspicillum 0.289855072 2.898550725Balistoides viridescens 0.523560209 2.487562189Melichthys vidua 0.289855072 2.898550725Melichthys sp 0.215982721 3.424657534Odonus niger 0.215982721 3.424657534Pseudobalistes flavimarginatus 0.523560209 2.487562189Sufflamen bursa 0.272479564 3.125Sufflamen chrysopterus 0.280898876 3.086419753Xanthichthys auromarginatus 0.215982721 3.424657534CAESIONIDAE Caesio cuning 0.281214848 3.035822708Caesio lunaris 0.281214848 3.035822708Caesio teres 0.281214848 3.035822708Caesio spp. 0.222106727 3.360779701Pterocaesio digramma 0.225637369 3.341319086Pterocaesio marri 0.22496107 3.38890372Pterocaesio pisang 0.225733634 3.341129302Pterocaesio tile 0.210084034 3.676470588Pterocaesio trilineata 0.238389252 3.196695895Pterocaesio spp. 0.22496107 3.38890372CARANGIDAE Caranx ignobilis 0.240945857 3.234466475Caranx melampygus 0.270652842 3.000363044Caranx papuensis 0.265956032 3.040474801Caranx sexfasciatus 0.27100271 3.003003003Caranx spp. 0.27027027 3.03030303267
<strong>Solomon</strong> <strong>Islands</strong> <strong>Marine</strong> <strong>Assessment</strong> Technical Reportbiomass constant biomass constantFamilyGenus and SpeciesabGnathanodon speciosus 0.26805627 3.0095462810.189753321 3.176620076CARCHARINIDAE Carcharhinus melanopterusCHAETODONTIDAE Chaetodon auriga 0.287429831 3.126846794Chaetodon baronessa 0.284090909 3.300330033Chaetodon bennetti 0.284090909 3.300330033Chaetodon citrinellus 0.295817729 3.083098761Chaetodon ephippium 0.284090909 3.300330033Chaetodon kleinii 0.310559006 3.012048193Chaetodon lunula 0.287356322 3.236245955Chaetodon melannotus 0.327862403 2.914975981Chaetodon mertensii 0.233759555 3.904450292Chaetodon meyeri 0.287356322 3.236245955Chaetodon ocellicaudus 0.327862403 2.914975981Chaetodon octofasciatus 0.310559006 3.012048193Chaetodon ornatissimus 0.287356322 3.236245955Chaetodon oxycephalus 0.287356322 3.236245955Chaetodon pelewensis 0.30965025 3.010778587Chaetodon rafflesi 0.284090909 3.300330033Chaetodon reticulatus 0.284090909 3.300330033Chaetodon semeion 0.287356322 3.134796238Chaetodon speculum 0.284090909 3.300330033Chaetodon trifascialis 0.287356322 3.236245955Chaetodon trifasciatus 0.307755753 3.054768953Chaetodon ulietensis 0.310559006 3.012048193Chaetodon unimaculatus 0.284090909 3.300330033Chaetodon vagabundus 0.287356322 3.125Coradion chrysozonus 0.3125 3.125Forcipiger flavissimus 0.27027027 3.125Heniochus acuminatus 0.302153143 3.133244349Heniochus chrysostomus 0.27192534 3.442625208Heniochus monoceros 0.284337281 3.207019524Heniochus singularius 0.3125 3.125Heniochus varius 0.303030303 3.134796238CHANIDAE Chanos chanos 0.204416626 3.391417002CIRRHITIDAE Cirrhitichthys falco 0.246395845 3.199385718Paracirrhites arcatus 0.257731959 2.923976608Paracirrhites forsteri 0.257731959 2.923976608ECHNENEIDAE Echeneis naucrates 0.110687057 3.459345769FISTULARIDAE Fistularia commersonii 0.076277651 3.205128205HAEMULIDAE Plectorhinchus albovittatus 0.286369663 2.884770718Plectorhinchus chaetodonoides 0.276243094 2.93255132Plectorhinchus chrysotaenia 0.202807258 3.355896142Plectorhinchus lineatus 0.202807258 3.355896142Plectorhinchus vittatus 0.202839757 3.355704698Plectorhinchus spp. 0.2356823 3.089280198HEMIGALEIDAE Triaenodon obesus 0.322580645 2.680965147KYPHOSIDAE Kyphosus spp. 0.263157895 3.125LABRIDAE Anampses caeruleopunctatus 0.27027027 2.702702703Anampses meleagrides 0.27027027 2.702702703Anampses neoguinaicus 0.27027027 2.702702703Anampses twistii 0.263157895 2.770083102Bodianus diana 0.27027027 2.857142857268
Fisheries Resources: Coral Reef FishesFamilybiomass constant biomass constantGenus and SpeciesabBodianus mesothorax 0.245212231 3.143566691Cheilinus chlorourus 0.300840548 2.803397718Cheilinus fasciatus 0.251889169 3.115264798Cheilinus oxycephalus 0.257731959 2.923976608Cheilinus trilobatus 0.264550265 3.003003003Cheilinus undulatus 0.243902439 3.225806452Cheilinus spp. 0.243902439 3.125Cheilio inermis 0.158478605 3.25732899Choerodon anchorago 0.243309002 3.195909236Cirrhilabrus punctatus 0.251889169 2.801120448Cirrhilabrus spp. 0.240096038 2.893518519Coris batuensis 0.27173913 2.717391304Coris gaimard 0.303030303 2.702702703Diproctacanthus xanthurus 0.206185567 3.205128205Epibulus insidiator 0.264550265 3.003003003Gomphosus varius 0.251889169 2.801120448Halichoeres biocellatus 0.27173913 2.717391304Halichoeres chloropterus 0.263157895 2.770083102Halichoeres chrysus 0.27173913 2.717391304Halichoeres hortulanus 0.27173913 2.717391304Halichoeres marginatus 0.27173913 2.717391304Halichoeres melanurus 0.263157895 2.770083102Halichoeres0.26601831 2.75251917nebulosus/margaritaceus/miniatusHalichoeres prosopeion 0.263157895 2.770083102Halichoeres richmondi 0.27173913 2.717391304Halichoeres scapularis 0.263123966 2.771042605Halichoeres spp. 0.263157895 2.770083102Hemigymnus fasciatus 0.244498778 3.174603175Hemigymnus melapterus 0.244498778 3.174603175Hologymnosus annulatus 0.222222222 2.631578947Hologymnosus sp 0.222222222 2.631578947Labrichthys unilineatus 0.206185567 3.205128205Labroides bicolor 0.200803213 3.378378378Labroides dimidiatus 0.200737913 3.369011162Labroides pectoralis 0.200803213 3.378378378Labroides rubrolabiatus 0.200803213 3.367003367Labropsis alleni 0.206185567 3.205128205Labropsis australis 0.206185567 3.205128205Labropsis xanthonota 0.206185567 3.205128205Leptojulis cyanopleura 0.236406619 3.012048193Macropharyngodon meleagris 0.25 3.125Macropharyngodon negrosensis 0.25 3.125Novaculichthys taeniourus 0.333333333 2.702702703Oxycheilinus celebicus 0.257731959 2.923976608Oxycheilinus diagrammus 0.257731959 2.923976608Paracheilinus filamentosus 0.240096038 2.893518519Pseudocheilinus evanidus 0.25 3.125Pseudocheilinus hexataenia 0.25 3.125Pseudocoris yamashiroi 0.27173913 2.717391304Pseudodax moluccanus 0.27027027 2.702702703Stethojulis bandanensis 0.236406619 3.012048193Stethojulis strigiventer 0.236406619 3.012048193269
<strong>Solomon</strong> <strong>Islands</strong> <strong>Marine</strong> <strong>Assessment</strong> Technical Reportbiomass constant biomass constantFamilyGenus and SpeciesabStethojulis trilineata 0.249326818 2.915366899Thalassoma amblycephalum 0.251889169 2.801120448Thalassoma hardwicke 0.251889169 2.801120448Thalassoma jansenii 0.251889169 2.801120448Thalassoma lunare 0.252725646 2.793967266Thalassoma quinquevittatum 0.25 3.2258064520.267364667 3.098853424LETHRINIDAE Gnathodentex aurolineatusLethrinus erythracanthus 0.222717149 3.278688525Lethrinus erythropterus 0.260241139 3.056916733Lethrinus olivaceous 0.263781947 3.00928364Lethrinus rubriopeculatus 0.222767259 3.268304959Lethrinus xanthochilus 0.222717149 3.278688525Lethrinus spp. 0.260416667 3.058103976Monotaxis grandoculis 0.290881166 2.997574962LUTJANIDAE Aphareus furca 0.263157895 2.941176471Aprion virescens 0.263281914 2.916132042Lutjanus argentmaculatus 0.291405858 2.814126917Lutjanus biguttatus 0.256757208 3.000255022Lutjanus bohar 0.252301622 3.063706717Lutjanus carponotatus 0.276283544 2.962164276Lutjanus fulviflamma 0.271452188 2.949104357Lutjanus fulvus 0.276283544 2.962164276Lutjanus gibbus 0.25 3.012048193Lutjanus monostigma 0.23255814 2.994011976Lutjanus quinquelineatus 0.271024745 3.003535161Lutjanus semicinctus 0.242718447 3.067484663Lutjanus vitta 0.242309109 3.064842881Lutjanus sp 0.23255814 2.994011976Macolor macularis 0.252525253 3.067484663Macolor niger 0.252525253 3.067484663Macolor spp. 0.25252525 3.06748466Symphorichthys spilurus 0.275016157 2.943678597MALACANTHIDAE Aluterus scriptus 0.217864924 3.262642741Malacanthus latovittatus 0.17921147 3.344481605MOBULIDAE Manta birostris 0.229357798 3.50877193MONACANTHIDAE Amanses scopas 0.289855072 2.898550725Cantherhines dumerilii 0.263157895 2.898550725Cantherhines pardalis 0.263157895 2.898550725Oxymonacanthus longirostris 0.25 2.777777778MULLIDAE Mulloides flavolineatus 0.200649704 3.706421746Mulloides vanicolensis 0.203665988 3.649635036Parupeneus barberinus 0.252870075 3.097682314Parupeneus bifasciatus 0.263157895 3.125Parupeneus cyclostomus 0.254452926 3.125Parupeneus multifasciatus 0.252525253 3.125Parupeneus pleurostigma 0.254452926 3.125Upeneus tragula 0.246891025 3.06732471MYLIOBATIDIDAE Aetobatus narinari 0.229042602 3.50877193NEMIPTERIDAE Pentapodus sp. 0.230946882 3.333333333Scolopsis affinis 0.263157895 2.976190476Scolopsis bilineatus 0.256012452 3.18571779Scolopsis ciliatus 0.263157895 2.976190476270
Fisheries Resources: Coral Reef Fishesbiomass constant biomass constantFamilyGenus and SpeciesabScolopsis margaritifer 0.256012452 3.18571779Scolopsis trilineatus 0.255754476 3.184713376unid nemipterid 0.256012452 3.18571779OSTRACIDAE Ostracion cubicus 0.410160496 2.594255799Ostracion meleagris 0.5 2.415458937PINGUIPEDIDAE Parapercis miillipunctata 0.221238938 3.184713376Parapercis sp. 0.221238938 3.184713376PLATACIDAE Platax pinnatus 0.333333333 2.976190476POMACANTHIDAE Apolemichthys trimaculatus 0.362581581 2.616841995Centropyge bicolor 0.338983051 2.808988764Centropyge bispinosus 0.386681154 2.408402434Centropyge flavissimus 0.348432056 2.645502646Centropyge nox 0.386681154 2.408402434Centropyge vroliki 0.338983051 2.811357886Chaetodontoplus mesoleucus 0.281690141 3.225806452Pomacanthus imperator 0.281690141 3.225806452Pomacanthus navarchus 0.281690141 3.225806452Pomacanthus semicirculatus 0.281690141 3.225806452Pomacanthus sexstriatus 0.281690141 3.225806452Pomacanthus xanthometopon 0.281690141 3.225806452Pygoplites diacanthus 0.281690141 3.225806452POMACENTRIDAE Abudefduf vaigiensis 0.298329356 3.17510716Acanthochromis polyacanthus 0.279490433 3.534693012Amblyglyphidodon aureus 0.302160447 3.173595684Amblyglyphidodon curacao 0.302159534 3.173988529Amblyglyphidodon leucogaster 0.302114804 3.174603175Amphiprion chrysopterus 0.297450846 3.132243313Amphiprion clarkii 0.294117647 3.125Amphiprion leucokranos 0.294117647 3.125Amphiprion ocellaris 0.294117647 3.125Amphiprion perideraion 0.294117647 3.125Chromis acares 0.326797386 2.72479564Chromis alpha 0.279490433 3.534693012Chromis amboinensis 0.319488818 2.923976608Chromis atripes 0.326797386 2.72479564Chromis delta 0.319488818 2.923976608Chromis elerae 0.319488818 2.923976608Chromis iomelas 0.298002193 3.025974969Chromis lepidolepis 0.326615932 2.720836712Chromis lineata 0.326797386 2.72479564Chromis margaritifer 0.319488818 2.923976608Chromis retrofasciata 0.308667698 4.366831296Chromis ternatensis 0.297038232 3.408002672Chromis viridis 0.326970488 2.723808538Chromis weberi 0.319488818 2.923976608Chromis xanthochira 0.279485746 3.534817957Chromis xanthura 0.279485746 3.534817957Chromis spp. 0.326797386 2.72479564Chrysiptera cymatilis 0.282050053 3.170265446Chrysiptera flavipinnis 0.282050053 3.170265446Chrysiptera oxycephala 0.282050053 3.170265446Chrysiptera parasema 0.282050053 3.170265446Chrysiptera rex 0.294985251 3.115264798271
<strong>Solomon</strong> <strong>Islands</strong> <strong>Marine</strong> <strong>Assessment</strong> Technical Reportbiomass constant biomass constantFamilyGenus and SpeciesabChrysiptera rollandi 0.304878049 2.824858757Chrysiptera talboti 0.304878049 2.824858757Dascyllus aruanus 0.348608182 2.946341233Dascyllus melanurus 0.348432056 2.949852507Dascyllus reticulatus 0.352112676 2.857142857Dascyllus trimaculatus 0.352112676 2.857142857Dischistodus melanotus 0.366300366 2.873563218Dischistodus perspicillatus 0.366300366 2.873563218Dischistodus prosopotaenia 0.366300366 2.873563218Hemigylphidodon plagiometopon 0.366300366 2.873563218Lepidozygus tapeinosoma 0.265251989 2.88184438Neoglyphidodon melas 0.303030303 3.03030303Neoglyphidodon nigroris 0.303030303 3.03030303Neoglyphidodon thoracotaeniatus 0.303030303 3.03030303Neopomacentrus nemurus 0.296735905 3.460207612Plectroglyphidodon dickii 0.277777778 3.03030303Plectroglyphidodon lacrymatus 0.277777778 3.03030303Pomacentrus adelus 0.35335689 2.666666667Pomacentrus amboinensis 0.353581783 2.66771241Pomacentrus aurifrons 0.278551532 3.067484663Pomacentrus bankanensis 0.35335689 2.673796791Pomacentrus brachialis 0.308033514 3.031772981Pomacentrus burroughi 0.35335689 2.666666667Pomacentrus coelestis 0.298507463 2.857142857Pomacentrus grammorhynchus 0.338778635 2.729585431Pomacentrus lepidogenys 0.3129293 3.107877537Pomacentrus moluccensis 0.319665502 3.024455749Pomacentrus nagasakiensis 0.307125307 3.046922608Pomacentrus nigromanus 0.338778635 2.729585431Pomacentrus philippinus 0.272466201 3.516817421Pomacentrus reidi 0.279490433 3.534693012Pomacentrus simsiang 0.319665502 3.024455749Pomacentrus vaiuli 0.338778635 2.729585431Premnas biaculeatus 0.297450846 3.132243313Stegastes albifasciatus 0.366300366 2.873563218Stegastes fasciolatus 0.366032211 2.876869965Stegastes gascoynei 0.366032211 2.876869965Stegastes spp. 0.366300366 2.873563218PRIACANTHIDAE Priacanthus hamrur 0.272300751 2.851984839SCARIDAE Bolbometopon muricatum 0.277777778 3.225806452Calotomus carolinus 0.252079657 3.111387679Cetoscarus bicolor 0.24691358 3.236245955Chlorurus bleekeri 0.266240682 3.076923077Chlorurus microrhinos 0.215517241 3.401360544Chlorurus pyrrhurus 0.24691358 3.236245955Chlorurus sordidus 0.289646024 2.94134084Hipposcarus longiceps 0.24691358 3.236245955Scarus altipinnis 0.24691358 3.236245955Scarus chameleon 0.24691358 3.236245955Scarus dimidiatus 0.215517241 3.412969283Scarus flavipectoralis 0.266240682 3.076923077Scarus forsteni 0.24691358 3.236245955Scarus frenatus 0.24691358 3.236245955272
Fisheries Resources: Coral Reef Fishesbiomass constant biomass constantFamilyGenus and SpeciesabScarus ghobban 0.298507463 2.906976744Scarus niger 0.24691358 3.236245955Scarus oviceps 0.24691358 3.236245955Scarus prasiognathos 0.298507463 2.906976744Scarus psittacus 0.24691358 3.236245955Scarus quoyi 0.24691358 3.236245955Scarus rivulatus 0.266230049 3.077889061Scarus rubroviolaceus 0.298507463 2.898550725Scarus schlegeli 0.28304557 2.971573924Scarus spinus 0.289687138 2.941176471Scarus tricolor 0.24691358 3.236245955unid scarid 0.24691358 3.236245955SCOMBRIDAE Rastrelliger kanagurta 0.143612132 3.205004936unid scombrid 0.238663484 2.840909091SERRANIDAE Aethaloperca rogae 0.23433092 3.14698443Anyperodon leucogrammicus 0.248756219 2.976190476Cephalopholis argus 0.229186434 3.18139014Cephalopholis boenak 0.239143484 3.124121341Cephalopholis cyanostigma 0.23923445 3.125Cephalopholis leopardus 0.23923445 3.125Cephalopholis microprion 0.23923445 3.125Cephalopholis miniata 0.246840442 3.032618848Cephalopholis sexmaculata 0.24691358 3.039513678Cephalopholis urodeta 0.23923445 3.125Cephalopholis spp. 0.23433092 3.14698443Cromileptes altivelis 0.262398321 3.055300947Diploprion bifasciatum 0.333333333 3.125Epinephelus corallicola 0.236966825 3.039513678Epinephelus fasciatus 0.264135893 2.911123403Epinephelus fuscoguttatus 0.240384615 3.067484663Epinephelus melanostigma 0.252525253 2.941176471Epinephelus merra 0.252504848 2.942223556Epinephelus polyphekadion 0.24026506 3.065556935Epinephelus spilotoceps 0.252525253 2.941176471Epinephelus spp. 0.229357798 3.058103976Gracila albomarginata 0.227272727 3.144654088Luzonichthys waitei 0.255918106 3.14861461Plectropomus areolatus 0.315457413 2.770083102Plectropomus laevis 0.315457413 2.770083102Plectropomus leopardus 0.222137316 3.135769408Plectropomus oligacanthus 0.315457413 2.770083102Plectropomus spp. 0.315457413 2.770083102Pseudanthias dispar 0.278551532 3.072196621Pseudanthias huchti 0.278551532 3.072196621Pseudanthias pascalus 0.278551532 3.072196621Pseudanthias tuka 0.278551532 3.072196621Pseudanthias spp. 0.285714286 3.333333333Variola albimarginata 0.227331627 3.138899439Variola louti 0.227331627 3.138899439Variola sp 0.227331627 3.138899439SIGANIDAE Siganus argenteus 0.240226966 3.157482602Siganus corallinus 0.273972603 3.021148036Siganus doliatus 0.27359332 3.020098757273
<strong>Solomon</strong> <strong>Islands</strong> <strong>Marine</strong> <strong>Assessment</strong> Technical Reportbiomass constant biomass constantFamilyGenus and SpeciesabSiganus fuscescens 0.247297655 3.06954672Siganus lineatus 0.278947809 3.009972037Siganus puellus 0.251889169 3.184713376Siganus punctatissimus 0.25 3.067484663Siganus vermiculatus 0.278947809 3.009972037Siganus vulpinus 0.25 3.067484663Siganus spp. 0.251889169 3.184713376SPHYRAENIDAE Sphyraena barracuda 0.185117652 3.006334346Sphyrna sp. 0.189899258 3.175974389SYNODONTIDAE Synodus spp. 0.200803213 3.215434084TETRAODONTIDAE Arothron mappa 0.313116448 2.760905577Arothron nigropunctatus 0.303030303 2.777777778Arothron sp. 0.303030303 2.777777778Canthigaster papua 0.321543408 2.865329513Canthigaster valentini 0.321458651 2.862737464Diodon sp 0.423642649 2.618925403ZANCLIDAE Zanclus cornutus 0.257731959 3.067484663274
Fisheries Resources: Coral Reef FishesAppendix 2. Mean density of each of the most abundant families of reef fishes on sheltered and exposed reefs slopes (10m) in the <strong>Solomon</strong> <strong>Islands</strong>.Mean Density (perha)ButterflyfishesDamselfishesEmperorsFusiliersGroupers & FairyBassletsParrotfishesDrummersSnappersSurgeonfishesTriggerfishesWrassesProvince Island Site ExposureCentral Floridas 1 shelt mean 40.00 21733.33 74.67 0.00 309.33 965.33 0.00 80.00 336.00 277.33 1344.00sd 59.63 8470.21 145.63 0.00 278.63 801.59 0.00 116.62 218.56 197.41 910.752 exp mean 466.67 11800.00 0.00 1653.33 234.67 360.00 0.00 280.00 2037.33 184.00 1008.00sd 194.37 5603.77 0.00 1597.25 130.84 224.10 0.00 234.95 728.80 147.09 578.6362 exp mean 160.00 21400.00 0.00 2226.67 2960.00 549.33 0.00 40.00 773.33 88.00 10880.00sd 203.31 10012.21 0.00 3455.62 3566.35 856.58 0.00 59.63 806.42 140.03 5244.9863 shelt mean 280.00 72933.33 24.00 4272.00 130.67 266.67 0.00 53.33 170.67 93.33 1042.67sd 218.07 44880.33 21.91 4548.62 95.41 235.70 0.00 73.03 43.61 102.42 286.81Central Russells 38 exp mean 440.00 48266.67 3397.33 4000.00 3861.33 1024.00 2589.33 9304.00 1752.00 144.00 853.33sd 417.93 25041.52 3969.56 4013.59 4433.45 268.56 626.34 4869.75 1176.16 98.16 216.0239 shelt mean 346.67 46400.00 336.00 733.33 85.33 1405.33 0.00 184.00 552.00 29.33 1018.67sd 196.64 12134.43 102.59 1639.78 20.22 319.11 0.00 87.64 305.88 28.91 191.5140 exp mean 640.00 29680.00 4538.67 0.00 877.33 712.00 0.00 474.67 1293.33 186.67 1165.33sd 243.13 7655.85 8311.99 0.00 1133.47 280.57 0.00 290.38 483.41 58.88 500.1941 shelt mean 280.00 27066.67 610.67 2917.33 4117.33 3578.67 3869.33 5112.00 642.67 184.00 744.00sd 251.22 7338.63 1006.79 5137.53 3027.10 5400.77 8607.44 10604.92 517.03 154.17 668.56Central Savo 64 exp mean 733.33 42533.33 1706.67 10693.33 3218.67 146.67 392.00 1296.00 1528.00 165.33 1221.33sd 188.56 11582.07 1675.89 11394.99 4916.00 128.24 876.54 905.71 1041.14 113.76 571.21Choiseul Choiseul 17 exp mean 360.00 19200.00 912.00 12733.33 973.33 1474.67 128.00 7712.00 4693.33 258.67 2029.33sd 273.25 8002.08 650.24 4085.20 1670.69 1052.68 286.22 3311.21 1336.36 114.93 1108.4918 shelt mean 386.67 64400.00 608.00 2018.67 1640.00 314.67 0.00 1346.67 858.67 186.67 1056.00sd 136.63 48101.40 587.47 1558.48 2101.83 120.96 0.00 847.32 215.74 146.36 426.4019 shelt mean 293.33 23866.67 168.00 7653.33 117.33 341.33 0.00 413.33 626.67 133.33 930.67sd 292.88 9349.99 57.81 2495.95 64.22 293.42 0.00 327.14 121.11 38.87 426.9220 exp mean 640.00 13000.00 381.33 7613.33 74.67 1973.33 0.00 1325.33 2064.00 85.33 936.00sd 129.96 4203.17 417.14 9843.94 78.66 2847.46 0.00 1409.67 875.62 68.38 339.5921 exp mean 400.00 24680.00 1413.33 1573.33 1306.67 389.33 0.00 421.33 15117.33 3530.67 6618.67sd 188.56 6505.62 1480.93 2239.84 1051.77 203.39 0.00 243.78 5825.56 2707.97 7714.91275
<strong>Solomon</strong> <strong>Islands</strong> <strong>Marine</strong> <strong>Assessment</strong> Technical ReportMean Density (perha)ButterflyfishesDamselfishesEmperorsFusiliersGroupers & FairyBassletsParrotfishesDrummersSnappersSurgeonfishesTriggerfishesWrassesProvince Island Site ExposureChoiseul(con’t) 22 shelt mean 533.33 34266.67 413.33 1320.00 120.00 776.00 0.00 461.33 1344.00 197.33 2216.00sd 339.93 13772.76 511.82 1681.53 157.48 510.55 0.00 483.29 674.38 23.85 2563.6823 exp mean 560.00 21533.33 3957.33 4277.33 522.67 584.00 8.00 205.33 2122.67 120.00 1101.33sd 269.16 2652.04 5809.89 5860.08 940.75 318.25 17.89 112.59 703.35 32.66 168.0224 shelt mean 320.00 26866.67 101.33 453.33 45.33 106.67 0.00 29.33 426.67 24.00 2176.00sd 228.04 7858.47 74.60 712.05 60.07 76.01 0.00 40.44 173.85 53.67 439.03Guadalcanal Guadalcanal 42 exp mean 160.00 18933.33 397.33 0.00 517.33 453.33 0.00 469.33 2530.67 520.00 2874.67sd 138.24 12200.64 700.12 0.00 428.06 327.96 0.00 795.17 3315.18 263.48 2212.9643 shelt mean 506.67 24533.33 686.67 24.00 632.00 600.00 0.00 1500.00 288.00 597.33 842.67sd 498.00 6890.41 345.90 53.67 1058.24 235.70 0.00 1796.44 184.17 573.75 237.4765 exp mean 400.00 9266.67 112.00 0.00 69.33 808.00 0.00 200.00 1266.67 152.00 605.33sd 235.70 4968.79 17.89 0.00 43.61 727.16 0.00 165.19 561.74 126.70 141.9266 exp mean 26.67 11000.00 0.00 400.00 154.67 280.00 0.00 21.33 1013.33 296.00 4973.33sd 36.51 5174.72 0.00 894.43 200.13 366.36 0.00 47.70 1943.31 139.33 4738.87Isabel Arnavons 15 exp mean 266.67 41266.67 2978.67 1120.00 416.00 2088.00 1200.00 8288.00 2432.00 261.33 5461.33sd 182.57 10401.39 2518.95 1752.71 352.57 2052.07 1788.85 8472.10 797.59 157.93 6619.8416 shelt mean 426.67 27933.33 1248.00 973.33 154.67 984.00 0.00 773.33 1144.00 146.67 1386.67sd 256.47 9900.62 1033.77 1214.36 120.22 511.42 0.00 589.92 941.41 151.73 716.66Isabel Isabel 3 exp mean 306.67 14266.67 80.00 3061.33 48.00 226.67 576.00 0.00 2181.33 154.67 893.33sd 252.10 9813.26 138.56 802.58 52.15 153.48 1111.97 0.00 1435.16 57.81 1067.294 shelt mean 440.00 19240.00 109.33 4069.33 232.00 280.00 432.00 6186.67 80.00 146.67 776.00sd 296.65 7495.87 62.11 4102.63 153.65 172.56 597.60 8616.44 119.26 136.95 166.915 exp mean 533.33 20400.00 2208.00 720.00 13.33 120.00 0.00 2893.33 5189.33 384.00 741.33sd 286.74 6317.52 1597.35 995.99 29.81 136.63 0.00 6313.34 3448.56 334.32 87.746 shelt mean 413.33 11666.67 133.33 504.00 120.00 224.00 0.00 290.67 1080.00 304.00 1261.33sd 341.24 2415.23 109.95 1126.98 127.54 51.12 0.00 303.23 938.84 128.37 1085.367 exp mean 666.67 29533.33 298.67 4386.67 154.67 1010.67 893.33 2469.33 1565.33 170.67 1040.00sd 429.47 12506.89 528.53 6293.98 309.92 1061.84 1266.32 1982.22 590.94 171.89 306.38276
Fisheries Resources: Coral Reef FishesMean Density (perha)ButterflyfishesDamselfishesEmperorsFusiliersGroupers & FairyBassletsParrotfishesDrummersSnappersSurgeonfishesTriggerfishesWrassesProvince Island Site Exposure(Isabel con’t) 8 shelt mean 80.00 30066.67 96.00 2562.67 269.33 200.00 16.00 354.67 2464.00 178.67 794.67sd 86.92 6024.95 104.31 2639.70 125.22 163.30 35.78 410.92 695.73 273.35 575.169 exp mean 160.00 12066.67 48.00 906.67 88.00 480.00 0.00 309.33 1810.67 64.00 1106.67sd 146.06 3378.03 52.15 2027.37 103.54 190.90 0.00 619.85 1179.02 53.67 347.8210 shelt mean 106.67 23866.67 277.33 408.00 13.33 186.67 0.00 8.00 504.00 16.00 754.67sd 138.24 13710.50 357.45 752.69 29.81 184.99 0.00 17.89 430.54 21.91 653.1011 exp mean 186.67 13333.33 997.33 7906.67 80.00 1298.67 0.00 6266.67 3834.67 1848.00 768.00sd 144.53 5359.31 1374.87 3980.40 89.94 1090.30 0.00 4040.73 1216.43 1288.22 316.5912 shelt mean 93.33 11600.00 170.67 466.67 0.00 578.67 0.00 29.33 90.67 56.00 781.33sd 59.63 760.12 94.00 689.61 0.00 302.52 0.00 28.91 109.30 21.91 296.4413 exp mean 80.00 14800.00 706.67 4320.00 184.00 640.00 0.00 53.33 1648.00 128.00 3016.00sd 119.26 5053.05 1109.15 9659.81 96.79 538.72 0.00 41.10 1656.41 86.72 1235.6014 shelt mean 200.00 78466.67 1018.67 5194.67 106.67 322.67 0.00 202.67 1850.67 269.33 2130.67sd 94.28 66277.45 831.31 5493.44 116.62 230.63 0.00 112.11 2399.73 109.71 1247.13Makira Makira 44 exp mean 253.33 9826.67 2696.00 533.33 34.67 1562.67 4229.33 3458.67 1130.67 72.00 1098.67sd 272.44 4595.31 3356.38 1192.57 57.81 1679.72 5648.98 5631.80 595.94 75.78 540.8345 shelt mean 293.33 13866.67 85.33 2653.33 82.67 698.67 16.00 0.00 496.00 56.00 866.67sd 138.24 7911.31 112.59 3522.12 27.33 663.23 35.78 0.00 836.68 35.78 226.0846 exp mean 613.33 18133.33 405.33 1120.00 50.67 968.00 0.00 1405.33 2490.67 162.67 1002.67sd 178.89 3927.11 585.95 1137.64 39.33 600.19 0.00 2389.73 329.36 102.59 300.4347 shelt mean 80.00 17133.33 69.33 2226.67 154.67 80.00 0.00 541.33 106.67 101.33 1240.00sd 55.78 11729.83 99.51 1619.74 148.05 86.92 0.00 515.85 101.11 94.56 493.51Makira Three Sisters 48 exp mean 213.33 27866.67 176.00 0.00 90.67 640.00 0.00 456.00 1658.67 186.67 2381.33sd 73.03 15015.92 175.73 0.00 78.54 378.89 0.00 511.16 647.15 129.27 1998.7749 shelt mean 146.67 49933.33 266.67 3266.67 2461.33 458.67 160.00 101.33 784.00 354.67 7562.67sd 184.99 23760.85 284.72 7304.49 4603.35 212.21 357.77 146.55 280.22 140.35 6810.54Makira Ugi 50 exp mean 453.33 43866.67 618.67 3573.33 2082.67 1637.33 0.00 1040.00 1818.67 416.00 3458.67sd 259.91 17245.93 1235.28 3995.72 2621.88 1041.68 0.00 1326.88 559.65 64.22 2311.3051 shelt mean 200.00 57066.67 1546.67 3853.33 1410.67 400.00 0.00 194.67 1442.67 317.33 2117.33sd 205.48 23013.76 2040.30 4311.07 2498.06 235.70 0.00 249.02 379.17 472.48 1413.03277
<strong>Solomon</strong> <strong>Islands</strong> <strong>Marine</strong> <strong>Assessment</strong> Technical ReportMean Density (perha)ButterflyfishesDamselfishesEmperorsFusiliersGroupers & FairyBassletsParrotfishesDrummersSnappersSurgeonfishesTriggerfishesWrassesProvince Island Site ExposureMalaita Malaita 52 shelt mean 226.67 32400.00 56.00 1786.67 42.67 808.00 0.00 104.00 541.33 429.33 1221.33sd 186.19 14244.69 56.88 2757.78 45.61 482.92 0.00 144.35 504.08 333.92 371.1453 exp mean 306.67 17733.33 453.33 1160.00 66.67 541.33 202.67 826.67 1184.00 165.33 1088.00sd 101.11 5688.19 302.14 1342.97 40.00 432.93 303.37 1200.56 234.08 120.59 523.2954 shelt mean 200.00 20960.00 45.33 0.00 122.67 1400.00 13.33 56.00 136.00 136.00 925.33sd 81.65 16043.59 70.30 0.00 76.25 426.87 29.81 87.64 97.25 111.71 149.8455 exp mean 346.67 9733.33 85.33 0.00 104.00 378.67 0.00 1069.33 2096.00 138.67 861.33sd 212.92 4361.45 134.20 0.00 64.22 183.93 0.00 1336.11 955.10 82.52 388.1156 exp mean 120.00 19466.67 232.00 4165.33 40.00 440.00 0.00 80.00 1901.33 160.00 1210.67sd 55.78 5096.84 156.23 2868.26 59.63 363.93 0.00 61.82 2417.89 126.49 683.2957 shelt mean 173.33 26666.67 69.33 2813.33 109.33 586.67 0.00 186.67 2138.67 82.67 970.67sd 138.24 15396.61 99.51 5889.43 28.91 589.54 0.00 243.49 1337.68 67.59 232.1758 exp mean 440.00 27466.67 349.33 1453.33 96.00 760.00 104.00 829.33 2861.33 106.67 957.33sd 192.06 9311.28 144.35 2001.33 77.97 410.53 232.55 775.48 1078.67 120.37 177.7459 shelt mean 213.33 15466.67 237.33 133.33 82.67 1328.00 0.00 109.33 2162.67 160.00 1082.67sd 55.78 5585.70 331.11 188.56 115.62 182.96 0.00 166.64 474.17 56.57 437.3060 exp mean 226.67 8600.00 80.00 1920.00 72.00 666.67 21.33 61.33 1082.67 98.67 2117.33sd 197.77 3294.78 61.82 1688.79 101.37 385.86 30.70 48.63 434.96 61.54 625.2861 shelt mean 106.67 6266.67 69.33 853.33 13.33 194.67 0.00 93.33 106.67 13.33 240.00sd 111.55 6563.37 133.80 1227.83 29.81 180.52 0.00 208.70 111.55 29.81 197.77Western New Georgia 29 exp mean 0.00 0.00 168.00 0.00 96.00 1776.00 0.00 6216.00 5424.00 200.00 56.00sd 0.00 0.00 353.72 0.00 104.31 2515.01 0.00 7282.34 7383.58 162.48 104.3130 exp mean 0.00 0.00 264.00 0.00 40.00 40.00 16.00 344.00 216.00 120.00 72.00sd 0.00 0.00 480.50 0.00 40.00 0.00 35.78 508.02 143.11 80.00 33.4731 shelt mean 493.33 31200.00 242.67 5040.00 104.00 853.33 0.00 77.33 1818.67 144.00 760.00sd 318.33 9136.62 166.37 2523.49 108.07 246.76 0.00 110.92 389.03 60.66 458.5032 exp mean 640.00 58733.33 290.67 1813.33 600.00 162.67 0.00 15533.33 2168.00 613.33 1037.33sd 173.85 40339.81 277.51 3061.74 933.33 154.46 0.00 19692.46 568.16 901.41 218.5633 exp mean 426.67 48333.33 541.33 10653.33 6528.00 2474.67 1520.00 3642.67 512.00 178.67 773.33sd 180.12 36611.32 685.18 4257.12 6643.56 3836.56 1396.28 4188.04 241.40 200.13 391.24278
Fisheries Resources: Coral Reef FishesMean Density (perha)ButterflyfishesDamselfishesEmperorsFusiliersGroupers & FairyBassletsParrotfishesDrummersSnappersSurgeonfishesTriggerfishesWrassesProvince Island Site ExposureNew Georgia(con’t) 34 exp mean 746.67 34413.33 1642.67 3400.00 584.00 810.67 0.00 1256.00 2568.00 64.00 698.67sd 369.38 8702.54 1948.98 3376.72 1204.23 342.33 0.00 1070.01 1214.75 66.93 379.5435 shelt mean 306.67 53600.00 96.00 21213.33 13749.33 312.00 0.00 1160.00 1632.00 45.33 693.33sd 252.10 17805.12 72.66 19996.36 10288.77 263.41 0.00 2504.72 1711.65 41.74 146.0636 exp mean 506.67 23800.00 1418.67 10392.00 6032.00 1346.67 648.00 482.67 2776.00 181.33 882.67sd 401.66 7879.65 1987.57 9992.64 5501.94 1738.48 1426.72 473.23 387.29 108.98 268.2337 shelt mean 533.33 61200.00 794.67 9349.33 125.33 698.67 0.00 853.33 1448.00 341.33 2008.00sd 124.72 11329.90 1099.64 12782.96 67.07 253.44 0.00 1169.43 561.00 265.93 1810.28Western Shortlands 25 exp mean 466.67 32000.00 1030.00 2033.33 482.67 453.33 0.00 4646.67 4805.33 390.00 4106.67sd 278.89 12018.50 1488.22 600.00 477.72 440.71 0.00 5814.38 2287.70 279.97 6997.4726 shelt mean 680.00 26400.00 165.33 4026.67 42.67 861.33 0.00 143.33 1426.67 125.33 1200.00sd 387.01 8351.31 138.11 2647.68 54.49 607.48 0.00 88.69 296.65 20.22 447.9127 exp mean 0.00 0.00 7016.00 2400.00 0.00 5392.00 0.00 14896.00 7888.00 168.00 0.00sd 0.00 0.00 7984.46 5366.56 0.00 5037.73 0.00 9074.39 4656.47 127.75 0.0028 shelt mean 0.00 0.00 64.00 736.00 48.00 0.00 0.00 184.00 24.00 208.00 56.00sd 0.00 0.00 87.64 718.67 17.89 0.00 0.00 368.35 53.67 121.33 77.97279
<strong>Solomon</strong> <strong>Islands</strong> <strong>Marine</strong> <strong>Assessment</strong> Technical ReportAppendix 3. Mean biomass of each of the most abundant families of reef fishes on sheltered and exposed reefs slopes (10m) in the <strong>Solomon</strong> <strong>Islands</strong>.Bony Fishes Sharks & RaysMean Biomass(kg/ha)DamselfishesEmperorsFusiliersParrotfishesDrummersSnappersSurgeonfishesTriggerfishesTOTAL (allbony fishes)SharksRaysProvince Island Site ExposureCentral Floridas 1 shelt mean 125.30 11.93 0.00 127.69 0.00 52.13 29.68 103.65 559.87 0.00 0.00sd 81.18 16.76 0.00 66.64 0.00 58.92 23.29 130.10 74.30 0.00 0.002 exp mean 143.92 0.00 160.81 53.05 0.00 160.67 212.56 37.01 1032.35 0.00 0.00sd 95.25 0.00 161.97 27.34 0.00 114.23 103.45 67.02 237.97 0.00 0.0062 exp mean 56.06 0.00 206.10 294.85 0.00 2.58 44.90 3.13 688.82 0.00 0.00sd 26.64 0.00 381.35 489.55 0.00 4.73 82.17 5.12 545.59 0.00 0.0063 shelt mean 270.34 0.49 135.31 44.20 0.00 5.71 15.13 2.21 617.16 0.00 0.00sd 99.91 0.49 185.50 45.12 0.00 8.05 1.89 2.38 249.76 0.00 0.00Central Russells 38 exp mean 179.17 1174.34 272.00 594.07 1036.40 2730.29 202.39 99.09 7614.71 281.50 0.00sd 124.01 697.26 315.24 359.86 168.71 1393.11 246.63 117.19 1760.75 264.56 0.0039 shelt mean 181.01 24.54 21.05 343.69 0.00 41.86 52.22 1.28 797.02 0.00 0.00sd 45.39 7.12 47.07 189.24 0.00 49.41 48.54 1.44 172.68 0.00 0.0040 exp mean 126.78 349.61 0.00 269.11 0.00 172.71 151.59 40.06 1242.63 0.00 0.00sd 50.76 502.94 0.00 249.83 0.00 160.51 93.76 49.09 662.08 0.00 0.0041 shelt mean 123.14 301.45 142.06 1262.75 1391.47 692.76 112.51 189.47 4455.61 78.34 0.00sd 78.95 492.20 166.65 1984.24 3103.39 1344.31 164.52 227.42 6461.75 50.30 0.00Central Savo 64 exp mean 133.11 163.64 1501.91 26.15 1232.38 564.25 132.30 6.80 3919.65 0.00 0.00sd 33.70 163.87 1771.79 26.66 2755.68 1120.40 104.72 9.38 2268.36 0.00 0.00Choiseul Choiseul 17 exp mean 229.10 481.77 831.19 944.91 46.13 2195.99 690.82 184.96 5923.19 0.00 0.00sd 144.88 699.02 596.76 807.67 103.14 1485.70 293.35 106.87 2401.30 0.00 0.0018 shelt mean 311.17 103.42 155.82 126.99 0.00 320.62 71.53 31.09 1263.82 0.00 0.00sd 183.67 129.79 132.02 212.87 0.00 355.26 17.51 52.55 471.84 0.00 0.0019 shelt mean 176.71 15.19 338.25 52.22 0.00 143.58 39.18 17.28 1079.26 0.00 0.00sd 95.82 7.31 59.93 20.64 0.00 193.49 12.56 23.90 538.81 0.00 0.0020 exp mean 237.31 57.27 467.05 1080.53 0.00 249.43 219.52 19.37 2596.00 186.75 0.00sd 88.87 45.18 600.24 1816.33 0.00 173.32 122.52 31.72 2459.33 186.75 0.0021 exp mean 81.51 185.99 266.00 2528.50 0.00 145.55 1433.68 454.13 5385.19 124.42 0.00sd 19.37 195.46 402.88 1624.62 0.00 62.48 636.75 342.03 1506.94 124.42 0.00280
Fisheries Resources: Coral Reef FishesBony Fishes Sharks & RaysMean Biomass(kg/ha)DamselfishesEmperorsFusiliersParrotfishesDrummersSnappersSurgeonfishesTriggerfishesTOTAL (allbony fishes)SharksRaysProvince Island Site Exposure(Choiseul(con’t) 22 shelt mean 460.27 137.70 104.92 2158.38 0.00 147.61 114.02 26.37 4565.72 0.00 0.00sd 229.34 228.44 135.62 3421.19 0.00 169.68 52.18 32.29 3505.35 0.00 0.0023 exp mean 90.69 384.90 421.24 121.76 1.44 62.27 155.77 4.84 1427.94 0.00 0.00sd 18.67 553.84 576.81 141.99 3.21 66.89 90.93 3.29 706.31 0.00 0.0024 shelt mean 307.42 10.82 25.08 18.08 0.00 1.75 50.49 1.70 680.17 0.00 0.00sd 103.77 9.55 35.40 21.03 0.00 3.73 34.86 3.80 350.59 0.00 0.00Guadalcanal Guadalcanal 42 exp mean 77.61 41.25 0.00 87.86 0.00 55.00 751.52 35.02 1164.37 0.00 0.00sd 98.13 58.94 0.00 127.49 0.00 102.40 1539.54 16.21 1609.26 0.00 0.0043 shelt mean 205.51 88.09 1.90 202.27 0.00 347.16 13.07 37.91 1009.89 27.93 135.27sd 50.05 137.34 4.24 102.94 0.00 517.44 8.13 36.70 718.75 27.93 135.2765 exp mean 139.14 21.44 0.00 133.02 0.00 63.86 72.89 27.74 621.31 0.00 0.00sd 134.65 15.01 0.00 94.88 0.00 95.34 33.32 25.99 325.96 0.00 0.0066 exp mean 18.22 0.00 43.11 40.97 0.00 0.04 84.13 8.44 231.87 555.44 0.00sd 13.13 0.00 96.39 59.01 0.00 0.10 174.97 7.07 216.85 555.44 0.00Isabel Arnavons 15 exp mean 294.68 931.05 88.51 693.30 287.69 2449.47 380.07 93.28 5921.78 0.00 0.00sd 114.40 1297.74 138.51 817.10 393.94 3421.32 143.98 128.95 6047.47 0.00 0.0016 shelt mean 616.76 299.41 45.67 430.22 0.00 213.32 150.39 9.28 2420.67 23.39 0.00sd 217.22 261.80 53.63 510.49 0.00 172.54 219.14 10.78 1280.55 23.39 0.00Isabel Isabel 3 exp mean 105.83 13.23 208.11 10.66 234.63 0.00 173.72 5.05 858.55 0.00 0.00sd 48.92 28.14 44.39 5.32 452.96 0.00 119.80 2.03 469.97 0.00 0.004 shelt mean 102.33 10.75 411.54 28.68 174.72 801.27 17.20 11.85 1762.26 0.00 0.00sd 24.47 11.95 439.94 24.87 242.52 1166.39 29.87 13.77 1784.42 0.00 0.005 exp mean 94.10 287.29 35.36 15.77 0.00 1292.28 517.11 100.02 2604.53 0.00 0.00sd 40.23 582.61 69.07 14.96 0.00 2878.33 302.75 142.53 3646.34 0.00 0.006 shelt mean 83.50 13.39 20.23 25.78 0.00 32.62 90.96 5.70 352.52 0.00 0.00sd 33.05 27.60 45.24 13.92 0.00 66.72 90.93 5.94 248.79 0.00 0.007 exp mean 86.00 54.15 536.37 1179.45 220.60 839.11 137.14 41.88 3549.35 0.00 0.00sd 40.42 91.03 770.62 943.85 341.60 408.66 95.35 64.26 2323.11 0.00 0.008 shelt mean 241.85 5.45 118.57 17.85 10.19 141.70 124.90 7.96 715.22 0.00 0.00sd 125.90 7.05 169.25 18.95 22.79 178.69 41.72 10.01 457.31 0.00 0.00281
<strong>Solomon</strong> <strong>Islands</strong> <strong>Marine</strong> <strong>Assessment</strong> Technical ReportBony Fishes Sharks & RaysMean Biomass(kg/ha)DamselfishesEmperorsFusiliersParrotfishesDrummersSnappersSurgeonfishesTriggerfishesTOTAL (allbony fishes)SharksRaysProvince Island Site ExposureIsabel (con’t) 9 exp mean 273.84 0.73 5.72 53.80 0.00 13.74 179.78 1.54 624.84 0.00 0.00sd 36.97 1.08 12.79 30.73 0.00 26.68 120.73 1.27 185.02 0.00 0.0010 shelt mean 279.76 8.24 14.47 35.26 0.00 0.43 43.08 0.47 456.87 0.00 0.00sd 99.85 12.50 26.17 41.84 0.00 0.96 35.56 0.68 152.48 0.00 0.0011 exp mean 142.51 535.03 405.12 1372.57 0.00 1754.08 986.49 2428.45 7885.53 0.00 0.00sd 47.90 929.74 330.32 1510.47 0.00 1268.99 936.45 1732.02 2282.92 0.00 0.0012 shelt mean 134.70 8.59 20.97 31.79 0.00 6.11 16.38 12.76 287.51 0.00 0.00sd 53.29 4.41 45.65 18.70 0.00 8.48 25.71 23.90 116.61 0.00 0.0013 exp mean 73.98 54.66 144.46 142.04 0.00 18.12 200.90 7.10 853.99 0.00 0.00sd 23.62 85.83 323.02 244.08 0.00 23.55 230.82 6.08 796.48 0.00 0.0014 shelt mean 299.58 204.60 618.33 68.31 0.00 32.09 267.26 20.29 1726.02 0.00 0.00sd 159.26 285.31 781.46 101.79 0.00 16.05 473.23 28.78 1312.28 0.00 0.00Makira Makira 44 exp mean 67.54 1424.59 42.15 1900.76 1856.13 3894.63 115.62 12.18 9422.92 0.00 0.00sd 26.64 2632.75 94.25 2602.50 2716.37 8162.98 70.05 25.63 10238.68 0.00 0.0045 shelt mean 229.68 9.50 74.65 234.66 0.00 0.00 183.39 2.88 881.50 0.00 0.00sd 72.23 11.91 90.88 192.22 0.00 0.00 363.53 2.77 399.34 0.00 0.0046 exp mean 90.85 263.70 109.32 113.50 2.87 655.33 114.34 7.80 1448.69 41.47 0.00sd 50.32 380.23 152.86 148.57 6.42 1256.49 40.07 6.83 1288.40 41.47 0.0047 shelt mean 128.69 2.83 101.75 12.33 0.00 34.16 8.49 8.28 656.14 1289.05 0.00sd 70.06 4.54 106.88 18.21 0.00 35.38 7.22 13.95 607.47 1095.58 0.00Makira Three Sisters 48 exp mean 169.63 26.66 0.00 88.98 0.00 109.27 97.44 4.30 609.18 0.00 0.00sd 87.87 18.04 0.00 72.91 0.00 197.14 34.56 3.58 196.41 0.00 0.0049 shelt mean 245.02 34.71 352.06 62.77 16.79 18.83 57.99 127.14 1037.36 0.00 0.00sd 134.54 35.59 787.22 41.82 37.55 22.18 51.91 147.77 739.79 0.00 0.00Makira Ugi 50 exp mean 144.18 140.09 328.88 431.06 0.00 803.38 544.05 82.53 2740.58 0.00 0.00sd 99.32 211.57 328.37 452.21 0.00 1363.05 587.16 97.63 2294.51 0.00 0.0051 shelt mean 207.23 91.38 419.08 60.21 0.00 100.86 100.08 15.72 1067.45 0.00 0.00sd 75.97 164.14 422.56 40.22 0.00 138.67 27.68 30.27 569.21 0.00 0.00Malaita Malaita 52 shelt mean 149.70 2.32 196.70 73.73 0.00 27.35 43.62 16.50 590.48 0.00 0.00sd 97.51 2.21 293.58 52.33 0.00 59.12 36.34 14.98 487.18 0.00 0.00282
Fisheries Resources: Coral Reef FishesBony Fishes Sharks & RaysMean Biomass(kg/ha)DamselfishesEmperorsFusiliersParrotfishesDrummersSnappersSurgeonfishesTriggerfishesTOTAL (allbony fishes)SharksRaysProvince Island Site ExposureMalaita (con’t) 53 exp mean 103.44 90.54 0.00 152.79 91.48 196.93 82.62 7.07 869.44 0.00 0.00sd 75.64 98.45 0.00 116.93 125.80 231.16 18.69 5.90 552.76 0.00 0.0054 shelt mean 140.10 2.49 59.44 63.99 0.00 3.62 14.34 6.89 373.88 0.00 0.00sd 101.86 4.46 86.08 28.54 0.00 7.34 11.07 5.97 151.41 0.00 0.0055 exp mean 52.20 34.99 0.00 111.78 4.80 521.98 314.19 6.62 1759.42 0.00 22435.27sd 18.22 65.89 0.00 79.34 10.74 608.87 183.19 4.55 1169.21 0.00 22435.2756 exp mean 146.14 21.89 372.16 83.06 0.00 4.76 78.49 4.60 881.07 0.00 0.00sd 130.95 18.56 264.41 70.44 0.00 4.08 86.21 5.98 223.17 0.00 0.0057 shelt mean 398.91 5.36 125.54 91.45 0.00 135.97 208.84 2.13 1068.51 0.00 0.00sd 249.10 8.18 253.74 111.84 0.00 251.05 123.20 2.33 567.61 0.00 0.0058 exp mean 73.11 52.58 136.26 298.00 61.31 282.36 275.15 19.28 1557.59 0.00 0.00sd 17.27 66.59 203.21 434.93 137.10 459.86 138.16 39.13 1058.36 0.00 0.0059 shelt mean 145.92 49.50 12.49 273.37 0.00 27.86 170.03 3.40 816.21 0.00 0.00sd 43.44 62.71 17.10 149.25 0.00 39.32 71.99 2.68 120.54 0.00 0.0060 exp mean 49.73 4.47 52.17 54.12 11.38 4.28 111.96 1.99 357.51 0.00 0.00sd 25.95 3.32 60.22 30.63 18.47 4.92 44.78 1.42 84.93 0.00 0.0061 shelt mean 59.47 3.29 44.75 37.23 0.00 47.90 5.81 0.29 314.12 0.00 0.00sd 81.60 6.05 62.13 64.69 0.00 107.11 6.97 0.65 394.05 0.00 0.00Western New Georgia 29 exp mean 0.00 40.97 0.00 1757.36 0.00 1953.68 3062.22 126.25 7104.23 388.12 0.00sd 0.00 68.03 0.00 2673.76 0.00 2295.36 5128.26 117.11 6421.35 323.93 0.0030 exp mean 0.00 153.81 0.00 19.89 25.05 177.40 49.36 37.90 534.16 0.00 0.00sd 0.00 328.03 0.00 28.35 56.00 219.71 43.95 49.23 496.12 0.00 0.0031 shelt mean 115.89 20.32 331.16 68.87 0.00 6.35 110.14 23.75 1764.58 22.54 0.00sd 25.15 13.75 222.66 26.12 0.00 10.07 28.57 15.85 2334.05 22.54 0.0032 exp mean 71.37 122.30 152.49 43.25 0.00 2083.54 259.33 70.42 2927.44 991.21 0.00sd 47.21 174.74 310.71 45.58 0.00 2482.72 202.09 92.13 2567.89 991.21 0.0033 exp mean 75.13 81.86 732.91 772.46 278.52 540.23 45.97 88.05 2831.63 0.00 0.00sd 19.58 133.09 395.57 1381.50 243.73 517.99 23.26 178.44 1781.80 0.00 0.0034 exp mean 113.53 143.52 132.02 268.54 0.00 121.05 235.34 11.52 1251.39 0.00 0.00sd 59.91 156.08 125.12 108.38 0.00 119.32 298.79 16.93 562.54 0.00 0.00283
<strong>Solomon</strong> <strong>Islands</strong> <strong>Marine</strong> <strong>Assessment</strong> Technical ReportBony Fishes Sharks & RaysMean Biomass(kg/ha)DamselfishesEmperorsFusiliersParrotfishesDrummersSnappersSurgeonfishesTriggerfishesTOTAL (allbony fishes)SharksRaysProvince Island Site ExposureNew Georgia(con’t) 35 shelt mean 161.45 6.91 1527.79 83.01 0.00 181.93 381.28 1.77 2505.59 107.81 0.00sd 40.85 6.08 1561.91 160.91 0.00 397.89 705.24 2.32 1352.58 107.81 0.0036 exp mean 131.54 126.18 418.51 479.60 116.27 77.78 104.36 139.38 1728.80 563.04 0.00sd 28.57 178.53 510.05 667.42 256.00 93.62 46.22 222.15 1269.09 553.59 0.0037 shelt mean 220.00 68.29 807.86 357.35 0.00 163.70 105.53 101.23 3139.74 1155.24 0.00sd 74.49 96.56 1089.58 455.44 0.00 247.95 35.78 149.17 1942.87 963.38 0.00Western Shortlands 25 exp mean 174.28 80.87 88.45 209.22 0.00 241.62 675.13 33.04 1698.04 5.00 0.00sd 99.04 141.02 96.07 155.07 0.00 294.08 421.14 49.12 789.01 5.00 0.0026 shelt mean 221.79 13.67 247.67 1326.90 0.00 40.69 108.43 14.12 2118.79 0.00 0.00sd 124.76 9.08 148.18 2756.48 0.00 45.13 31.23 13.60 2809.14 0.00 0.0027 exp mean 0.00 5090.59 189.67 2464.48 0.00 10357.05 3750.86 8.39 21863.35 343.17 0.00sd 0.00 5555.93 424.11 2256.92 0.00 11100.92 2228.50 10.63 14860.17 210.49 0.0028 shelt mean 0.00 7.94 15.48 0.00 0.00 3.19 0.06 13.00 53.94 142.40 0.00sd 0.00 15.65 30.29 0.00 0.00 4.99 0.13 17.42 25.68 110.83 0.00284
Fisheries Resources: Coral Reef FishesAppendix 4. Mean density of key families of food fishes on sheltered and exposed reefs slopes (10m) in the <strong>Solomon</strong> <strong>Islands</strong>.Bony Fishes Sharks & RaysMean Density (perha)EmperorsFusiliersGoatfishesDrummersSnappersSurgeonfishesTriggerfishesParrotfishesSharksRaysProvince Island Site ExposureCentral Floridas 1 shelt mean 74.67 0.00 0.00 0.00 80.00 309.33 264.00 112.00 0.00 0.00sd 145.63 0.00 0.00 0.00 116.62 188.42 216.52 117.98 0.00 0.002 exp mean 0.00 1333.33 13.33 0.00 280.00 1410.67 184.00 0.00 0.00 0.00sd 0.00 1491.93 29.81 0.00 234.95 783.35 147.09 0.00 0.00 0.0062 exp mean 0.00 480.00 29.33 0.00 40.00 506.67 48.00 29.33 0.00 0.00sd 0.00 715.54 46.57 0.00 59.63 357.27 86.72 40.44 0.00 0.0063 shelt mean 24.00 792.00 16.00 0.00 0.00 144.00 93.33 0.00 0.00 0.00sd 21.91 1062.22 21.91 0.00 0.00 28.91 102.42 0.00 0.00 0.00Central Russells 38 exp mean 3277.33 2840.00 288.00 2589.33 9277.33 1138.67 117.33 250.67 16.00 0.00sd 3708.98 4396.36 490.86 626.34 4883.67 1345.10 117.91 40.44 9.80 0.0039 shelt mean 269.33 0.00 80.00 0.00 184.00 445.33 29.33 552.00 0.00 0.00sd 116.77 0.00 82.19 0.00 87.64 259.68 28.91 289.61 0.00 0.0040 exp mean 4058.67 0.00 416.00 0.00 448.00 960.00 186.67 285.33 0.00 0.00sd 8300.98 0.00 757.15 0.00 274.00 449.10 58.88 278.82 0.00 0.0041 shelt mean 597.33 384.00 0.00 3869.33 5045.33 349.33 157.33 2778.67 16.00 0.00sd 977.63 858.65 0.00 8607.44 10641.17 378.23 131.79 5256.22 9.80 0.00Central Savo 64 exp mean 1320.00 0.00 288.00 392.00 1269.33 941.33 112.00 0.00 0.00 0.00sd 1100.18 0.00 343.39 876.54 905.07 688.10 111.00 0.00 0.00 0.00Choiseul Choiseul 17 exp mean 912.00 1360.00 154.67 128.00 7712.00 4306.67 205.33 1261.33 0.00 0.00sd 650.24 2616.87 94.56 286.22 3311.21 1248.32 116.08 1168.08 0.00 0.0018 shelt mean 608.00 712.00 120.00 0.00 1346.67 618.67 160.00 8.00 0.00 0.00sd 587.47 618.64 191.83 0.00 847.32 168.55 115.85 17.89 0.00 0.0019 shelt mean 168.00 6053.33 136.00 0.00 386.67 493.33 133.33 8.00 0.00 0.00sd 57.81 2165.59 239.33 0.00 306.09 121.11 38.87 17.89 0.00 0.0020 exp mean 381.33 3200.00 21.33 0.00 1325.33 1384.00 85.33 1786.67 8.00 0.00sd 417.14 4604.35 30.70 0.00 1409.67 700.12 68.38 2787.83 8.00 0.00285
<strong>Solomon</strong> <strong>Islands</strong> <strong>Marine</strong> <strong>Assessment</strong> Technical ReportBony Fishes Sharks & RaysMean Density (perha)EmperorsFusiliersGoatfishesDrummersSnappersSurgeonfishesTriggerfishesParrotfishesSharksRaysProvince Island Site ExposureChoiseul(con’t) 21 exp mean 1280.00 0.00 362.67 0.00 421.33 14744.00 304.00 96.00 8.00 0.00sd 1255.49 0.00 251.82 0.00 243.78 5751.49 176.48 49.35 8.00 0.0022 shelt mean 413.33 0.00 2069.33 0.00 461.33 744.00 197.33 136.00 0.00 0.00sd 511.82 0.00 3375.50 0.00 483.29 414.88 23.85 168.76 0.00 0.0023 exp mean 1450.67 1064.00 138.67 8.00 192.00 1602.67 106.67 130.67 0.00 0.00sd 1888.76 1571.14 188.00 17.89 86.72 581.52 32.66 105.58 0.00 0.0024 shelt mean 101.33 320.00 216.00 0.00 16.00 400.00 24.00 13.33 0.00 0.00sd 74.60 452.55 121.98 0.00 35.78 156.35 53.67 29.81 0.00 0.00Guadalcanal Guadalcanal 42 exp mean 304.00 0.00 240.00 0.00 469.33 1997.33 440.00 0.00 0.00 0.00sd 496.87 0.00 254.56 0.00 795.17 3571.96 283.78 0.00 0.00 0.0043 shelt mean 549.33 24.00 13.33 0.00 1200.00 274.67 584.00 0.00 8.00 8.00sd 428.99 53.67 29.81 0.00 1694.23 161.82 582.13 0.00 8.00 8.0065 exp mean 112.00 0.00 237.33 0.00 200.00 506.67 112.00 8.00 0.00 0.00sd 17.89 0.00 220.99 0.00 165.19 304.05 92.66 17.89 0.00 0.0066 exp mean 0.00 0.00 146.67 0.00 21.33 946.67 176.00 0.00 13.33 0.00sd 0.00 0.00 327.96 0.00 47.70 1863.33 104.31 0.00 13.33 0.00Isabel Arnavons 15 exp mean 2965.33 1120.00 90.67 1200.00 8274.67 2312.00 261.33 1314.67 0.00 0.00sd 2493.45 1752.71 100.40 1788.85 8485.19 872.78 157.93 1716.14 0.00 0.0016 shelt mean 1088.00 373.33 58.67 0.00 733.33 1050.67 146.67 557.33 8.00 0.00sd 1138.37 695.38 82.52 0.00 565.29 968.77 151.73 583.89 8.00 0.00Isabel Isabel 3 exp mean 80.00 3061.33 16.00 576.00 0.00 1981.33 154.67 0.00 0.00 0.00sd 138.56 802.58 35.78 1111.97 0.00 1443.35 57.81 0.00 0.00 0.004 shelt mean 109.33 4069.33 0.00 432.00 6093.33 80.00 146.67 0.00 0.00 0.00sd 62.11 4102.63 0.00 597.60 8651.22 119.26 136.95 0.00 0.00 0.005 exp mean 2128.00 720.00 778.67 0.00 2866.67 4642.67 370.67 0.00 0.00 0.00sd 1617.75 995.99 1089.53 0.00 6291.06 3583.26 306.43 0.00 0.00 0.006 shelt mean 133.33 504.00 0.00 0.00 290.67 840.00 304.00 37.33 0.00 0.00sd 109.95 1126.98 0.00 0.00 303.23 728.53 128.37 51.98 0.00 0.00286
Fisheries Resources: Coral Reef FishesBony Fishes Sharks & RaysMean Density (perha)EmperorsFusiliersGoatfishesDrummersSnappersSurgeonfishesTriggerfishesParrotfishesSharksRaysProvince Island Site Exposure7 exp mean 298.67 3786.67 32.00 893.33 2469.33 1218.67 144.00 584.00 0.00 0.00sd 528.53 5582.19 71.55 1266.32 1982.22 540.01 180.22 763.47 0.00 0.008 shelt mean 96.00 2562.67 16.00 16.00 341.33 2104.00 32.00 0.00 0.00 0.00sd 104.31 2639.70 35.78 35.78 412.32 654.79 33.47 0.00 0.00 0.009 exp mean 48.00 240.00 82.67 0.00 16.00 1784.00 64.00 0.00 0.00 0.00sd 52.15 536.66 109.30 0.00 35.78 1172.33 53.67 0.00 0.00 0.0010 shelt mean 277.33 141.33 34.67 0.00 8.00 464.00 16.00 0.00 0.00 0.00sd 357.45 196.32 77.52 0.00 17.89 416.06 21.91 0.00 0.00 0.0011 exp mean 997.33 6506.67 29.33 0.00 6253.33 3434.67 1848.00 765.33 0.00 0.00sd 1374.87 3960.25 65.59 0.00 4065.84 1205.97 1288.22 963.03 0.00 0.0012 shelt mean 170.67 466.67 42.67 0.00 16.00 77.33 56.00 178.67 0.00 0.00sd 94.00 689.61 45.61 0.00 21.91 116.77 21.91 100.93 0.00 0.0013 exp mean 600.00 4320.00 112.00 0.00 53.33 874.67 128.00 120.00 0.00 0.00sd 894.43 9659.81 168.29 0.00 41.10 464.34 86.72 268.33 0.00 0.0014 shelt mean 1018.67 3781.33 13.33 0.00 189.33 1717.33 256.00 69.33 0.00 0.00sd 831.31 4107.98 29.81 0.00 120.15 2246.39 101.72 71.43 0.00 0.00Makira Makira 44 exp mean 2696.00 0.00 168.00 4229.33 3458.67 837.33 45.33 1016.00 0.00 0.00sd 3356.38 0.00 179.78 5648.98 5631.80 397.03 62.25 1116.64 0.00 0.0045 shelt mean 85.33 1120.00 565.33 0.00 0.00 456.00 56.00 258.67 0.00 0.00sd 112.59 1559.49 746.94 0.00 0.00 858.86 35.78 294.33 0.00 0.0046 exp mean 405.33 320.00 34.67 16.00 1405.33 1704.00 96.00 8.00 24.00 0.00sd 585.95 715.54 57.81 35.78 2389.73 235.02 100.40 17.89 24.00 0.0047 shelt mean 56.00 0.00 264.00 0.00 514.67 66.67 101.33 0.00 16.00 0.00sd 104.31 0.00 119.78 0.00 512.04 81.65 94.56 0.00 9.80 0.00Makira Three Sisters 48 exp mean 176.00 0.00 117.33 0.00 429.33 1365.33 186.67 13.33 0.00 0.00sd 175.73 0.00 175.22 0.00 502.12 760.44 129.27 29.81 0.00 0.0049 shelt mean 253.33 0.00 125.33 160.00 74.67 637.33 261.33 165.33 0.00 0.00sd 290.90 0.00 158.77 357.77 123.86 190.30 123.86 166.16 0.00 0.00287
<strong>Solomon</strong> <strong>Islands</strong> <strong>Marine</strong> <strong>Assessment</strong> Technical ReportBony Fishes Sharks & RaysMean Density (perha)EmperorsFusiliersGoatfishesDrummersSnappersSurgeonfishesTriggerfishesParrotfishesSharksRaysProvince Island Site ExposureMakira Ugi 50 exp mean 618.67 0.00 328.00 0.00 1026.67 1098.67 322.67 104.00 0.00 0.00sd 1235.28 0.00 325.18 0.00 1338.06 593.04 158.72 151.26 0.00 0.0051 shelt mean 933.33 0.00 88.00 0.00 181.33 882.67 277.33 0.00 0.00 0.00sd 1762.37 0.00 121.33 0.00 232.97 318.25 383.37 0.00 0.00 0.00Malaita Malaita 52 shelt mean 56.00 1360.00 101.33 0.00 104.00 434.67 282.67 8.00 0.00 0.00sd 56.88 2109.03 60.81 0.00 144.35 391.31 228.11 17.89 0.00 0.0053 exp mean 453.33 0.00 21.33 202.67 800.00 944.00 152.00 61.33 0.00 0.00sd 302.14 0.00 30.70 303.37 1213.26 267.23 103.54 82.52 0.00 0.0054 shelt mean 45.33 880.00 226.67 0.00 16.00 109.33 136.00 0.00 0.00 0.00sd 70.30 1213.26 44.22 0.00 35.78 80.77 111.71 0.00 0.00 0.0055 exp mean 85.33 0.00 26.67 13.33 1069.33 1696.00 138.67 85.33 0.00 8.00sd 134.20 0.00 36.51 29.81 1336.11 877.24 82.52 129.82 0.00 8.0056 exp mean 232.00 2712.00 37.33 0.00 53.33 1661.33 146.67 0.00 0.00 0.00sd 156.23 2104.93 54.49 0.00 49.89 2141.73 121.11 0.00 0.00 0.0057 shelt mean 69.33 0.00 34.67 0.00 160.00 1912.00 82.67 66.67 0.00 0.00sd 99.51 0.00 57.81 0.00 224.50 1174.15 67.59 115.47 0.00 0.0058 exp mean 349.33 0.00 376.00 104.00 829.33 2088.00 93.33 53.33 0.00 0.00sd 144.35 0.00 542.62 232.55 775.48 764.41 95.68 73.64 0.00 0.0059 shelt mean 237.33 80.00 104.00 0.00 109.33 1682.67 160.00 8.00 0.00 0.00sd 331.11 178.89 82.95 0.00 166.64 551.39 56.57 17.89 0.00 0.0060 exp mean 80.00 480.00 85.33 21.33 61.33 722.67 32.00 0.00 0.00 0.00sd 61.82 715.54 38.41 30.70 48.63 226.16 33.47 0.00 0.00 0.0061 shelt mean 69.33 320.00 133.33 0.00 93.33 93.33 13.33 8.00 0.00 0.00sd 133.80 715.54 230.94 0.00 208.70 89.44 29.81 17.89 0.00 0.00Western New Georgia 29 exp mean 168.00 0.00 0.00 0.00 6216.00 5424.00 200.00 1776.00 16.00 0.00sd 353.72 0.00 0.00 0.00 7282.34 7383.58 162.48 2515.01 9.80 0.0030 exp mean 264.00 0.00 16.00 16.00 344.00 216.00 120.00 16.00 0.00 0.00sd 480.50 0.00 21.91 35.78 508.02 143.11 80.00 21.91 0.00 0.00288
Fisheries Resources: Coral Reef FishesBony Fishes Sharks & RaysMean Density (perha)EmperorsFusiliersGoatfishesDrummersSnappersSurgeonfishesTriggerfishesParrotfishesSharksRaysProvince Island Site ExposureNew Georgia(con’t) 31 shelt mean 242.67 5040.00 133.33 0.00 77.33 1258.67 144.00 53.33 8.00 0.00sd 166.37 2523.49 45.22 0.00 110.92 454.27 60.66 86.92 8.00 0.0032 exp mean 237.33 480.00 61.33 0.00 15533.33 1394.67 106.67 16.00 13.33 0.00sd 307.30 1073.31 116.08 0.00 19692.46 527.52 99.33 35.78 13.33 0.0033 exp mean 541.33 6720.00 589.33 1520.00 3616.00 312.00 152.00 2354.67 0.00 0.00sd 685.18 3871.95 506.35 1396.28 4195.01 135.19 165.89 3770.32 0.00 0.0034 exp mean 1642.67 3160.00 1741.33 0.00 1202.67 2221.33 64.00 144.00 0.00 0.00sd 1948.98 3106.12 3589.97 0.00 1051.96 1430.57 66.93 118.66 0.00 0.0035 shelt mean 96.00 16800.00 74.67 0.00 1160.00 1432.00 45.33 72.00 24.00 0.00sd 72.66 17064.58 50.42 0.00 2504.72 1698.35 41.74 161.00 24.00 0.0036 exp mean 1418.67 8112.00 133.33 648.00 336.00 2336.00 181.33 1040.00 21.33 0.00sd 1987.57 7237.59 88.44 1426.72 294.45 539.17 108.98 1781.91 13.73 0.0037 shelt mean 794.67 5056.00 26.67 0.00 853.33 994.67 261.33 125.33 21.33 0.00sd 1099.64 7788.69 59.63 0.00 1169.43 217.58 199.69 236.38 13.73 0.00Western Shortlands 25 exp mean 456.00 266.67 13.33 0.00 3717.33 4512.00 72.00 13.33 8.00 0.00sd 625.84 596.28 29.81 0.00 5447.34 2367.49 111.40 29.81 8.00 0.0026 shelt mean 173.33 720.00 117.33 0.00 114.67 1106.67 125.33 261.33 0.00 0.00sd 126.84 715.54 104.73 0.00 100.04 292.88 20.22 584.36 0.00 0.0027 exp mean 7016.00 2400.00 0.00 0.00 14896.00 7888.00 168.00 5392.00 16.00 0.00sd 7984.46 5366.56 0.00 0.00 9074.39 4656.47 127.75 5037.73 9.80 0.0028 shelt mean 64.00 736.00 48.00 0.00 184.00 24.00 208.00 0.00 16.00 0.00sd 87.64 718.67 65.73 0.00 368.35 53.67 121.33 0.00 9.80 0.00289
<strong>Solomon</strong> <strong>Islands</strong> <strong>Marine</strong> <strong>Assessment</strong> Technical ReportAppendix 5. Mean density of each genera of food fishes in two key families (snappers and groupers) of reef fishes onsheltered and exposed reef slopes (10m) in the <strong>Solomon</strong> <strong>Islands</strong>.snappers groupersMean Density(per ha)AprionLutjanusMacolorSymphorichthysCephalopholisCromileptesEpinephelusPlectropomusVariolaProvince Island Site ExposureCentral Floridas 1 shelt mean 0.00 48.00 32.00 0.00 40.00 8.00 0.00 96.00 32.00std 0.00 52.15 71.55 0.00 89.44 17.89 0.00 72.66 52.152 exp mean 0.00 136.00 144.00 0.00 0.00 0.00 0.00 0.00 128.00std 0.00 140.29 199.20 0.00 0.00 0.00 0.00 0.00 76.9462 exp mean 0.00 0.00 40.00 0.00 16.00 0.00 21.33 0.00 82.67std 0.00 0.00 59.63 0.00 21.91 0.00 47.70 0.00 27.3363 shelt mean 0.00 0.00 0.00 0.00 0.00 0.00 0.00 64.00 0.00std 0.00 0.00 0.00 0.00 0.00 0.00 0.00 53.67 0.00Central Russells 38 exp mean 0.00 7573.33 1704.00 0.00 13.33 0.00 0.00 48.00 0.00std 0.00 4159.08 1852.79 0.00 29.81 0.00 0.00 71.55 0.0039 shelt mean 0.00 168.00 16.00 0.00 0.00 0.00 0.00 45.33 0.00std 0.00 99.60 35.78 0.00 0.00 0.00 0.00 47.70 0.0040 exp mean 0.00 104.00 344.00 0.00 24.00 0.00 0.00 24.00 16.00std 0.00 104.31 207.29 0.00 53.67 0.00 0.00 35.78 35.7841 shelt mean 0.00 4840.00 205.33 0.00 8.00 0.00 8.00 48.00 0.00std 0.00 10755.54 158.77 0.00 17.89 0.00 17.89 65.73 0.00Central Savo 64 exp mean 0.00 861.33 408.00 0.00 45.33 0.00 0.00 0.00 0.00std 0.00 951.99 853.16 0.00 70.30 0.00 0.00 0.00 0.00Choiseul Choiseul 17 exp mean 64.00 5821.33 1826.67 0.00 16.00 0.00 0.00 0.00 24.00std 72.66 3414.03 1224.82 0.00 21.91 0.00 0.00 0.00 35.7818 shelt mean 8.00 808.00 530.67 0.00 45.33 0.00 0.00 8.00 0.00std 17.89 534.71 365.93 0.00 38.41 0.00 0.00 17.89 0.0019 shelt mean 0.00 216.00 170.67 0.00 82.67 0.00 13.33 0.00 8.00std 0.00 209.00 128.72 0.00 55.30 0.00 29.81 0.00 17.8920 exp mean 0.00 805.33 520.00 0.00 21.33 0.00 0.00 32.00 8.00std 0.00 1565.08 382.62 0.00 47.70 0.00 0.00 43.82 17.89290
Fisheries Resources: Coral Reef Fishessnappers groupersMean Density(per ha)AprionLutjanusMacolorSymphorichthysCephalopholisCromileptesEpinephelusPlectropomusVariolaProvince Island Site ExposureChoiseul(con’t) 21 exp mean 13.33 0.00 408.00 0.00 29.33 0.00 0.00 0.00 64.00std 29.81 0.00 261.04 0.00 28.91 0.00 0.00 0.00 60.6622 shelt mean 0.00 141.33 320.00 0.00 104.00 0.00 0.00 0.00 16.00std 0.00 171.68 322.21 0.00 137.40 0.00 0.00 0.00 21.9123 exp mean 0.00 120.00 72.00 0.00 40.00 0.00 0.00 13.33 16.00std 0.00 129.61 52.15 0.00 69.28 0.00 0.00 29.81 21.9124 shelt mean 0.00 0.00 8.00 8.00 21.33 0.00 16.00 8.00 0.00std 0.00 0.00 17.89 17.89 47.70 0.00 21.91 17.89 0.00Guadalcanal Guadalcanal 42 exp mean 0.00 408.00 61.33 0.00 0.00 0.00 0.00 0.00 64.00std 0.00 805.18 41.74 0.00 0.00 0.00 0.00 0.00 104.3143 shelt mean 0.00 1008.00 192.00 0.00 32.00 0.00 0.00 80.00 0.00std 0.00 1358.35 429.33 0.00 33.47 0.00 0.00 61.82 0.0065 exp mean 0.00 48.00 152.00 0.00 0.00 0.00 26.67 0.00 16.00std 0.00 65.73 195.64 0.00 0.00 0.00 36.51 0.00 21.9166 exp mean 0.00 0.00 21.33 0.00 34.67 0.00 0.00 0.00 0.00std 0.00 0.00 47.70 0.00 77.52 0.00 0.00 0.00 0.00Isabel Arnavons 15 exp mean 64.00 7069.33 1141.33 0.00 8.00 0.00 21.33 133.33 173.33std 60.66 6998.99 1550.53 0.00 17.89 0.00 30.70 151.73 160.2816 shelt mean 32.00 322.67 378.67 0.00 24.00 0.00 0.00 72.00 32.00std 43.82 345.95 360.57 0.00 53.67 0.00 0.00 99.60 52.15Isabel Isabel 3 exp mean 0.00 0.00 0.00 0.00 40.00 0.00 0.00 0.00 8.00std 0.00 0.00 0.00 0.00 56.57 0.00 0.00 0.00 17.894 shelt mean 0.00 6093.33 0.00 0.00 58.67 0.00 0.00 13.33 0.00std 0.00 8651.22 0.00 0.00 110.19 0.00 0.00 29.81 0.005 exp mean 0.00 2528.00 338.67 0.00 0.00 0.00 0.00 0.00 0.00std 0.00 5608.17 685.18 0.00 0.00 0.00 0.00 0.00 0.006 shelt mean 0.00 64.00 218.67 8.00 37.33 0.00 0.00 0.00 16.00std 0.00 60.66 239.00 17.89 37.00 0.00 0.00 0.00 21.91291
<strong>Solomon</strong> <strong>Islands</strong> <strong>Marine</strong> <strong>Assessment</strong> Technical Reportsnappers groupersMean Density(per ha)AprionLutjanusMacolorSymphorichthysCephalopholisCromileptesEpinephelusPlectropomusVariolaProvince Island Site ExposureIsabel (con’t) 7 exp mean 96.00 1616.00 757.33 0.00 0.00 0.00 0.00 8.00 0.00std 214.66 1994.11 464.89 0.00 0.00 0.00 0.00 17.89 0.008 shelt mean 0.00 56.00 285.33 0.00 8.00 0.00 0.00 21.33 0.00std 0.00 66.93 350.06 0.00 17.89 0.00 0.00 30.70 0.009 exp mean 0.00 0.00 16.00 0.00 0.00 0.00 0.00 21.33 0.00std 0.00 0.00 35.78 0.00 0.00 0.00 0.00 30.70 0.0010 shelt mean 0.00 8.00 0.00 0.00 0.00 0.00 0.00 0.00 0.00std 0.00 17.89 0.00 0.00 0.00 0.00 0.00 0.00 0.0011 exp mean 0.00 6085.33 168.00 0.00 13.33 0.00 13.33 45.33 8.00std 0.00 3987.10 230.48 0.00 29.81 0.00 29.81 62.25 17.8912 shelt mean 0.00 8.00 0.00 8.00 0.00 0.00 0.00 0.00 0.00std 0.00 17.89 0.00 17.89 0.00 0.00 0.00 0.00 0.0013 exp mean 8.00 21.33 24.00 0.00 0.00 0.00 0.00 0.00 104.00std 17.89 47.70 21.91 0.00 0.00 0.00 0.00 0.00 72.6614 shelt mean 8.00 45.33 136.00 0.00 24.00 0.00 0.00 0.00 16.00std 17.89 41.74 92.09 0.00 35.78 0.00 0.00 0.00 21.91Makira Makira 44 exp mean 0.00 3261.33 197.33 0.00 0.00 0.00 0.00 21.33 0.00std 0.00 5676.80 304.98 0.00 0.00 0.00 0.00 30.70 0.0045 shelt mean 0.00 0.00 0.00 0.00 16.00 0.00 13.33 53.33 0.00std 0.00 0.00 0.00 0.00 21.91 0.00 29.81 18.86 0.0046 exp mean 0.00 680.00 725.33 0.00 0.00 0.00 0.00 0.00 24.00std 0.00 975.29 1451.30 0.00 0.00 0.00 0.00 0.00 21.9147 shelt mean 0.00 485.33 29.33 0.00 16.00 0.00 58.67 32.00 21.33std 0.00 479.31 46.57 0.00 21.91 0.00 54.65 52.15 47.70Makira Three Sisters 48 exp mean 0.00 224.00 205.33 0.00 0.00 0.00 0.00 0.00 24.00std 0.00 285.10 285.59 0.00 0.00 0.00 0.00 0.00 35.7849 shelt mean 8.00 0.00 66.67 0.00 0.00 0.00 8.00 0.00 0.00std 17.89 0.00 127.89 0.00 0.00 0.00 17.89 0.00 0.00Makira Ugi 50 exp mean 8.00 378.67 640.00 0.00 0.00 0.00 0.00 0.00 29.33std 17.89 780.35 1319.60 0.00 0.00 0.00 0.00 0.00 28.91292
Fisheries Resources: Coral Reef Fishessnappers groupersMean Density(per ha)AprionLutjanusMacolorSymphorichthysCephalopholisCromileptesEpinephelusPlectropomusVariolaProvince Island Site ExposureUgi (con’t) 51 shelt mean 0.00 72.00 109.33 0.00 8.00 0.00 48.00 0.00 8.00std 0.00 99.60 133.80 0.00 17.89 0.00 86.72 0.00 17.89Malaita Malaita 52 shelt mean 0.00 58.67 45.33 0.00 8.00 0.00 13.33 21.33 0.00std 0.00 131.18 101.37 0.00 17.89 0.00 29.81 30.70 0.0053 exp mean 0.00 720.00 80.00 0.00 0.00 0.00 0.00 0.00 40.00std 0.00 1233.53 74.83 0.00 0.00 0.00 0.00 0.00 40.0054 shelt mean 0.00 0.00 16.00 0.00 0.00 0.00 56.00 66.67 0.00std 0.00 0.00 35.78 0.00 0.00 0.00 80.22 28.28 0.0055 exp mean 21.33 656.00 392.00 0.00 0.00 0.00 0.00 37.33 0.00std 30.70 864.68 520.91 0.00 0.00 0.00 0.00 43.61 0.0056 exp mean 0.00 0.00 53.33 0.00 0.00 0.00 0.00 0.00 0.00std 0.00 0.00 49.89 0.00 0.00 0.00 0.00 0.00 0.0057 shelt mean 0.00 24.00 136.00 0.00 8.00 0.00 26.67 40.00 8.00std 0.00 53.67 220.18 0.00 17.89 0.00 36.51 28.28 17.8958 exp mean 0.00 586.67 242.67 0.00 21.33 0.00 0.00 0.00 8.00std 0.00 681.24 506.18 0.00 47.70 0.00 0.00 0.00 17.8959 shelt mean 0.00 88.00 21.33 0.00 40.00 0.00 8.00 8.00 8.00std 0.00 155.95 30.70 0.00 59.63 0.00 17.89 17.89 17.8960 exp mean 0.00 0.00 61.33 0.00 26.67 0.00 0.00 0.00 32.00std 0.00 0.00 48.63 0.00 59.63 0.00 0.00 0.00 43.8261 shelt mean 0.00 64.00 29.33 0.00 0.00 0.00 0.00 13.33 0.00std 0.00 143.11 65.59 0.00 0.00 0.00 0.00 29.81 0.00Western New Georgia 29 exp mean 32.00 4592.00 1592.00 0.00 0.00 0.00 0.00 64.00 32.00std 52.15 4949.13 2533.36 0.00 0.00 0.00 0.00 104.31 71.5530 exp mean 0.00 64.00 280.00 0.00 8.00 0.00 8.00 16.00 8.00std 0.00 100.40 407.92 0.00 17.89 0.00 17.89 35.78 17.8931 shelt mean 0.00 8.00 69.33 0.00 48.00 0.00 0.00 56.00 0.00std 0.00 17.89 96.79 0.00 52.15 0.00 0.00 66.93 0.0032 exp mean 0.00 15293.33 240.00 0.00 0.00 0.00 0.00 0.00 40.00std 0.00 19895.48 492.34 0.00 0.00 0.00 0.00 0.00 89.44293
<strong>Solomon</strong> <strong>Islands</strong> <strong>Marine</strong> <strong>Assessment</strong> Technical Reportsnappers groupersMean Density(per ha)AprionLutjanusMacolorSymphorichthysCephalopholisCromileptesEpinephelusPlectropomusVariolaProvince Island Site ExposureNew Georgia(con't) 33 exp mean 0.00 3280.00 336.00 0.00 93.33 8.00 0.00 40.00 0.00std 0.00 3902.41 381.16 0.00 151.73 17.89 0.00 89.44 0.0034 exp mean 0.00 1173.33 21.33 8.00 8.00 0.00 0.00 16.00 0.00std 0.00 1068.87 30.70 17.89 17.89 0.00 0.00 35.78 0.0035 shelt mean 0.00 552.00 608.00 0.00 13.33 0.00 0.00 16.00 0.00std 0.00 1212.07 1292.87 0.00 29.81 0.00 0.00 21.91 0.0036 exp mean 0.00 208.00 128.00 0.00 16.00 0.00 0.00 16.00 0.00std 0.00 172.97 142.86 0.00 21.91 0.00 0.00 21.91 0.0037 shelt mean 32.00 656.00 165.33 0.00 8.00 0.00 13.33 40.00 24.00std 52.15 895.59 228.35 0.00 17.89 0.00 29.81 40.00 35.78Western Shortlands 25 exp mean 0.00 3626.67 90.67 0.00 0.00 0.00 0.00 0.00 96.00std 0.00 5418.81 81.87 0.00 0.00 0.00 0.00 0.00 60.6626 shelt mean 8.00 106.67 0.00 0.00 29.33 0.00 13.33 0.00 0.00std 17.89 97.07 0.00 0.00 28.91 0.00 29.81 0.00 0.0027 exp mean 0.00 8760.00 6136.00 0.00 0.00 0.00 0.00 0.00 0.00std 0.00 5807.58 13342.37 0.00 0.00 0.00 0.00 0.00 0.0028 shelt mean 0.00 184.00 0.00 0.00 16.00 0.00 8.00 0.00 24.00std 0.00 368.35 0.00 0.00 21.91 0.00 17.89 0.00 21.91294
Fisheries Resources: Coral Reef FishesAppendix 6. Mean density of each genera of food fishes in four key families (parrotfishes, surgeonfishes, emperors and fusiliers)of reef fishes on sheltered and exposed reef slopes (10m) in the <strong>Solomon</strong> <strong>Islands</strong>.parrotfishes surgeonfishes emperors fusiliersMean Density(per ha)BolbometoponChlorurusHipposcarusAcanthurusCtenochaetusNasoLethrinusMonotaxisCaesioProvince Island Site ExposureCentral Floridas 1 shelt mean 0.00 56.00 56.00 0.00 253.33 56.00 8.00 66.67 0.00std 0.00 77.97 60.66 0.00 144.53 77.97 17.89 149.07 0.002 exp mean 0.00 0.00 0.00 66.67 1160.00 184.00 0.00 0.00 1333.33std 0.00 0.00 0.00 81.65 810.49 108.07 0.00 0.00 1491.9362 exp mean 16.00 13.33 0.00 80.00 426.67 0.00 0.00 0.00 480.00std 35.78 29.81 0.00 138.56 281.27 0.00 0.00 0.00 715.5463 shelt mean 0.00 0.00 0.00 0.00 40.00 104.00 0.00 24.00 792.00std 0.00 0.00 0.00 0.00 59.63 60.66 0.00 21.91 1062.22Central Russells 38 exp mean 8.00 234.67 8.00 178.67 293.33 666.67 824.00 2453.33 2840.00std 17.89 50.42 17.89 299.42 121.11 1061.19 1776.20 2025.20 4396.3639 shelt mean 0.00 72.00 480.00 112.00 266.67 66.67 16.00 253.33 0.00std 0.00 82.52 280.00 190.58 81.65 75.42 21.91 95.68 0.0040 exp mean 8.00 13.33 264.00 229.33 560.00 170.67 96.00 3962.67 0.00std 17.89 29.81 250.76 180.47 332.00 113.29 111.71 8331.75 0.0041 shelt mean 0.00 192.00 2586.67 176.00 120.00 53.33 56.00 541.33 384.00std 0.00 262.91 5266.89 350.54 86.92 44.22 45.61 956.46 858.65Central Savo 64 exp mean 0.00 0.00 0.00 240.00 600.00 101.33 960.00 360.00 0.00std 0.00 0.00 0.00 536.66 312.69 107.74 920.87 349.86 0.00Choiseul Choiseul 17 exp mean 16.00 45.33 1200.00 1157.33 1333.33 1816.00 224.00 688.00 1360.00std 35.78 70.30 1104.54 1327.53 1170.94 632.20 436.90 737.48 2616.8718 shelt mean 8.00 0.00 0.00 40.00 546.67 32.00 296.00 312.00 712.00std 17.89 0.00 0.00 89.44 218.07 71.55 391.51 233.92 618.6419 shelt mean 8.00 0.00 0.00 0.00 493.33 0.00 32.00 136.00 6053.33std 17.89 0.00 0.00 0.00 121.11 0.00 17.89 69.54 2165.5920 exp mean 0.00 26.67 1760.00 96.00 826.67 461.33 24.00 357.33 3200.00std 0.00 36.51 2794.28 179.73 578.50 353.97 21.91 434.25 4604.35295
<strong>Solomon</strong> <strong>Islands</strong> <strong>Marine</strong> <strong>Assessment</strong> Technical Reportparrotfishes surgeonfishes emperors fusiliersMean Density(per ha)BolbometoponChlorurusHipposcarusAcanthurusCtenochaetusNasoLethrinusMonotaxisCaesioProvince Island Site ExposureChoiseul(con’t) 21 exp mean 96.00 0.00 0.00 6080.00 1146.67 7517.33 704.00 576.00 0.00std 49.35 0.00 0.00 2379.26 303.32 4403.57 828.30 649.06 0.0022 shelt mean 96.00 40.00 0.00 64.00 680.00 0.00 16.00 397.33 0.00std 173.44 89.44 0.00 89.64 366.36 0.00 35.78 478.09 0.0023 exp mean 0.00 130.67 0.00 72.00 1293.33 237.33 1280.00 170.67 1064.00std 0.00 105.58 0.00 103.97 484.42 162.32 1841.74 110.51 1571.1424 shelt mean 0.00 13.33 0.00 26.67 373.33 0.00 0.00 101.33 320.00std 0.00 29.81 0.00 59.63 167.33 0.00 0.00 74.60 452.55Guadalcanal Guadalcanal 42 exp mean 0.00 0.00 0.00 1666.67 306.67 24.00 192.00 112.00 0.00std 0.00 0.00 0.00 3607.66 281.27 53.67 429.33 142.55 0.0043 shelt mean 0.00 0.00 0.00 0.00 213.33 61.33 8.00 541.33 24.00std 0.00 0.00 0.00 0.00 98.88 68.38 17.89 434.67 53.6765 exp mean 0.00 8.00 0.00 40.00 466.67 0.00 0.00 112.00 0.00std 0.00 17.89 0.00 59.63 329.98 0.00 0.00 17.89 0.0066 exp mean 0.00 0.00 0.00 26.67 133.33 786.67 0.00 0.00 0.00std 0.00 0.00 0.00 36.51 156.35 1759.04 0.00 0.00 0.00Isabel Arnavons 15 exp mean 0.00 381.33 933.33 797.33 973.33 541.33 1760.00 1205.33 1120.00std 0.00 687.51 1195.36 773.41 711.18 393.12 1791.09 1056.27 1752.7116 shelt mean 16.00 149.33 392.00 632.00 386.67 32.00 472.00 616.00 373.33std 35.78 131.11 463.38 1006.54 264.15 52.15 765.45 444.56 695.38Isabel Isabel 3 exp mean 0.00 0.00 0.00 141.33 1680.00 160.00 40.00 40.00 3061.33std 0.00 0.00 0.00 139.08 1494.73 160.00 56.57 89.44 802.584 shelt mean 0.00 0.00 0.00 53.33 26.67 0.00 56.00 53.33 4069.33std 0.00 0.00 0.00 119.26 59.63 0.00 82.95 55.78 4102.635 exp mean 0.00 0.00 0.00 400.00 3893.33 349.33 1584.00 544.00 720.00std 0.00 0.00 0.00 429.47 3501.30 448.15 749.72 1046.75 995.996 shelt mean 0.00 21.33 16.00 16.00 680.00 144.00 101.33 32.00 504.00std 0.00 47.70 35.78 35.78 483.97 260.15 47.70 71.55 1126.98296
Fisheries Resources: Coral Reef Fishesparrotfishes surgeonfishes emperors fusiliersMean Density(per ha)BolbometoponChlorurusHipposcarusAcanthurusCtenochaetusNasoLethrinusMonotaxisCaesioProvince Island Site Exposure7 exp mean 112.00 0.00 472.00 152.00 866.67 200.00 216.00 82.67 3786.67std 117.98 0.00 662.36 192.67 464.28 193.91 417.23 124.51 5582.198 shelt mean 0.00 0.00 0.00 48.00 1426.67 629.33 96.00 0.00 2562.67std 0.00 0.00 0.00 65.73 415.26 309.32 104.31 0.00 2639.709 exp mean 0.00 0.00 0.00 304.00 1480.00 0.00 48.00 0.00 240.00std 0.00 0.00 0.00 537.10 1188.28 0.00 52.15 0.00 536.6610 shelt mean 0.00 0.00 0.00 37.33 426.67 0.00 200.00 77.33 141.33std 0.00 0.00 0.00 51.98 372.98 0.00 337.05 151.55 196.3211 exp mean 64.00 213.33 488.00 938.67 2373.33 122.67 264.00 733.33 6506.67std 92.09 315.67 663.57 1366.47 1078.68 142.17 434.14 1185.09 3960.2512 shelt mean 0.00 0.00 178.67 69.33 0.00 8.00 32.00 138.67 466.67std 0.00 0.00 100.93 121.25 0.00 17.89 33.47 98.70 689.6113 exp mean 0.00 0.00 120.00 37.33 733.33 104.00 400.00 200.00 4320.00std 0.00 0.00 268.33 54.49 405.52 166.37 894.43 447.21 9659.8114 shelt mean 0.00 13.33 56.00 1160.00 440.00 117.33 237.33 781.33 3781.33std 0.00 29.81 77.97 2128.66 203.31 119.03 325.43 760.74 4107.98Makira Makira 44 exp mean 144.00 40.00 832.00 114.67 426.67 296.00 0.00 2696.00 0.00std 216.52 89.44 978.73 122.78 341.89 174.46 0.00 3356.38 0.0045 shelt mean 32.00 61.33 165.33 392.00 13.33 50.67 8.00 77.33 1120.00std 33.47 67.72 311.36 854.35 29.81 69.54 17.89 117.91 1559.4946 exp mean 0.00 8.00 0.00 0.00 1573.33 130.67 8.00 397.33 320.00std 0.00 17.89 0.00 0.00 224.10 17.38 17.89 592.43 715.5447 shelt mean 0.00 0.00 0.00 0.00 66.67 0.00 0.00 56.00 0.00std 0.00 0.00 0.00 0.00 81.65 0.00 0.00 104.31 0.00Makira Three Sisters 48 exp mean 0.00 13.33 0.00 53.33 1266.67 45.33 0.00 176.00 0.00std 0.00 29.81 0.00 86.92 681.50 50.42 0.00 175.73 0.0049 shelt mean 0.00 13.33 152.00 26.67 546.67 64.00 32.00 221.33 0.00std 0.00 29.81 145.33 59.63 310.56 72.66 52.15 291.91 0.00Makira Ugi 50 exp mean 24.00 80.00 0.00 0.00 560.00 538.67 16.00 602.67 0.00std 53.67 101.98 0.00 0.00 285.19 505.14 21.91 1244.17 0.00297
<strong>Solomon</strong> <strong>Islands</strong> <strong>Marine</strong> <strong>Assessment</strong> Technical Reportparrotfishes surgeonfishes emperors fusiliersMean Density(per ha)BolbometoponChlorurusHipposcarusAcanthurusCtenochaetusNasoLethrinusMonotaxisCaesioProvince Island Site ExposureUgi (con’t) 51 shelt mean 0.00 0.00 0.00 109.33 746.67 26.67 808.00 125.33 0.00std 0.00 0.00 0.00 244.48 384.13 36.51 1784.47 100.04 0.00Malaita Malaita 52 shelt mean 0.00 0.00 8.00 21.33 413.33 0.00 0.00 56.00 1360.00std 0.00 0.00 17.89 30.70 392.71 0.00 0.00 56.88 2109.0353 exp mean 0.00 53.33 8.00 26.67 800.00 117.33 8.00 445.33 0.00std 0.00 86.92 17.89 59.63 278.89 240.63 17.89 314.76 0.0054 shelt mean 0.00 0.00 0.00 16.00 93.33 0.00 32.00 13.33 880.00std 0.00 0.00 0.00 21.91 76.01 0.00 71.55 29.81 1213.2655 exp mean 0.00 53.33 32.00 602.67 840.00 253.33 0.00 85.33 0.00std 0.00 73.03 71.55 352.06 345.12 395.53 0.00 134.20 0.0056 exp mean 0.00 0.00 0.00 40.00 1560.00 61.33 0.00 232.00 2712.00std 0.00 0.00 0.00 89.44 2148.18 50.42 0.00 156.23 2104.9357 shelt mean 0.00 53.33 13.33 0.00 1666.67 245.33 8.00 61.33 0.00std 0.00 119.26 29.81 0.00 1126.45 156.23 17.89 82.52 0.0058 exp mean 13.33 0.00 40.00 8.00 1880.00 200.00 16.00 333.33 0.00std 29.81 0.00 56.57 17.89 792.18 118.13 21.91 138.88 0.0059 shelt mean 8.00 0.00 0.00 0.00 1426.67 256.00 40.00 197.33 80.00std 17.89 0.00 0.00 0.00 423.22 294.00 40.00 332.32 178.8960 exp mean 0.00 0.00 0.00 0.00 573.33 149.33 24.00 56.00 480.00std 0.00 0.00 0.00 0.00 328.63 137.73 35.78 76.83 715.5461 shelt mean 8.00 0.00 0.00 0.00 93.33 0.00 16.00 53.33 320.00std 17.89 0.00 0.00 0.00 89.44 0.00 21.91 119.26 715.5429 exp mean 0.00 72.00 1704.00 280.00 0.00 5144.00 8.00 160.00 0.00std 0.00 99.60 2567.74 521.54 0.00 7365.19 17.89 357.77 0.0030 exp mean 0.00 16.00 0.00 128.00 0.00 88.00 16.00 248.00 0.00std 0.00 21.91 0.00 86.72 0.00 86.72 21.91 490.22 0.0031 shelt mean 0.00 53.33 0.00 0.00 1160.00 98.67 8.00 234.67 5040.00std 0.00 86.92 0.00 0.00 534.58 121.33 17.89 168.29 2523.4932 exp mean 0.00 16.00 0.00 61.33 1106.67 226.67 96.00 141.33 480.00std 0.00 35.78 0.00 82.52 372.98 170.49 171.11 236.94 1073.31298
Fisheries Resources: Coral Reef Fishesparrotfishes surgeonfishes emperors fusiliersMean Density(per ha)BolbometoponChlorurusHipposcarusAcanthurusCtenochaetusNasoLethrinusMonotaxisCaesioProvince Island Site ExposureMalaita (con’t) 33 exp mean 0.00 8.00 2346.67 80.00 160.00 72.00 0.00 541.33 6720.00std 0.00 17.89 3775.97 109.54 192.06 99.60 0.00 685.18 3871.9534 exp mean 88.00 8.00 48.00 826.67 1226.67 168.00 24.00 1618.67 3160.00std 86.72 17.89 65.73 1421.95 891.44 271.88 21.91 1955.77 3106.12Western New Georgia 35 shelt mean 0.00 72.00 0.00 56.00 400.00 976.00 56.00 40.00 16800.00std 0.00 161.00 0.00 87.64 249.44 1785.63 53.67 89.44 17064.5836 exp mean 16.00 96.00 928.00 66.67 1733.33 536.00 24.00 1394.67 8112.00std 21.91 143.11 1736.06 75.42 567.65 878.45 35.78 2005.80 7237.5937 shelt mean 8.00 101.33 16.00 13.33 800.00 181.33 0.00 794.67 5056.00std 17.89 204.96 35.78 29.81 188.56 107.74 0.00 1099.64 7788.69Western Shortlands 25 exp mean 0.00 13.33 0.00 3072.00 1146.67 293.33 456.00 0.00 266.67std 0.00 29.81 0.00 1743.98 713.99 239.07 625.84 0.00 596.2826 shelt mean 48.00 213.33 0.00 0.00 1106.67 0.00 72.00 101.33 720.00std 107.33 477.03 0.00 0.00 292.88 0.00 71.55 79.22 715.5427 exp mean 0.00 80.00 5312.00 7328.00 0.00 560.00 0.00 7016.00 2400.00std 0.00 113.14 4957.85 4712.74 0.00 931.67 0.00 7984.46 5366.5628 shelt mean 0.00 0.00 0.00 8.00 0.00 16.00 16.00 48.00 736.00std 0.00 0.00 0.00 17.89 0.00 35.78 35.78 71.55 718.67299
<strong>Solomon</strong> <strong>Islands</strong> <strong>Marine</strong> <strong>Assessment</strong> Technical ReportAppendix 7. Mean density of three key species targeted by the live reef food fish trade on sheltered and exposedreef slopes (10m) in the <strong>Solomon</strong> <strong>Islands</strong>.Province ExposureMean Density(per ha)Brown-marbledgrouperCamouflagegrouperSquaretailcoral grouperCentral exp mean 0.00 0.00 3.20std 0.00 0.00 11.08shelt mean 0.00 2.00 36.00std 0.00 8.94 56.42Choiseul exp mean 0.00 0.00 8.00std 0.00 0.00 24.62shelt mean 2.00 2.00 4.00std 8.94 8.94 12.31Guadalcanal exp mean 0.00 0.00 0.00std 0.00 0.00 0.00shelt mean 0.00 0.00 48.00std 0.00 0.00 55.46Isabel exp mean 1.14 0.00 23.62std 6.76 0.00 66.36shelt mean 0.00 0.00 7.62std 0.00 0.00 20.01Makira exp mean 0.00 0.00 0.00std 0.00 0.00 0.00shelt mean 2.00 0.00 0.00std 8.94 0.00 0.00Malaita exp mean 0.00 0.00 4.80std 0.00 0.00 13.27shelt mean 1.60 0.00 12.80std 8.00 0.00 19.04Western exp mean 0.00 2.00 17.00std 0.00 8.83 51.15shelt mean 0.00 0.00 20.80std 0.00 0.00 40.20300
Fisheries Resources: Coral Reef FishesAppendix 8. Mean density of large reef fishes (30cm or more in size ) of sharks, rays and some key families of bony fishes on sheltered andexposed reef slopes (10m) in the <strong>Solomon</strong> <strong>Islands</strong>.Bony Fishes Sharks & RaysExposureMean Density(per ha)EmperorsGroupersParrotfishesRabbitfishesDrummersSnappersSurgeonfishesSweetlipsTrevalliesTriggerfishesWrassesSharksRaysProvinceCentral exp mean 287.47 14.40 85.33 144.00 153.07 625.07 12.27 28.80 0.00 27.20 20.80 3.20 0.00std 661.76 38.09 148.52 641.66 520.43 1211.71 35.05 57.18 0.00 57.41 49.15 11.08 0.00shelt mean 104.00 23.33 172.00 0.00 0.00 45.33 0.00 5.33 0.00 38.00 6.00 4.00 0.00std 365.55 44.30 229.72 0.00 0.00 72.31 0.00 23.85 0.00 71.64 19.57 12.31 0.00Choiseul exp mean 86.00 25.33 584.00 6.67 0.00 416.67 31.33 27.33 7.33 82.00 8.00 4.00 0.00std 357.36 38.67 1500.45 29.81 0.00 954.82 72.29 65.39 18.59 109.72 20.93 12.31 0.00shelt mean 22.00 7.33 68.00 303.33 0.00 112.00 3.33 22.00 40.67 12.00 6.00 0.00 0.00std 98.39 18.59 164.83 1356.55 0.00 185.83 14.91 61.52 181.87 32.05 14.65 0.00 0.00Guadalcanal exp mean 0.00 13.33 22.22 4.44 0.00 24.00 0.00 22.22 0.00 8.00 0.00 4.44 0.00std 0.00 41.86 54.43 17.21 0.00 92.95 0.00 53.73 0.00 16.56 0.00 17.21 0.00shelt mean 0.00 0.00 93.33 0.00 0.00 192.00 0.00 0.00 0.00 8.00 0.00 8.00 8.00std 0.00 0.00 101.11 0.00 0.00 429.33 0.00 0.00 0.00 17.89 0.00 17.89 17.89Isabel exp mean 131.05 29.71 183.62 7.62 0.00 1180.57 171.43 69.33 20.19 284.57 16.38 0.00 0.00std 495.40 80.66 392.77 45.07 0.00 2948.33 577.03 148.40 55.39 769.03 40.40 0.00 0.00shelt mean 17.52 16.38 25.90 0.00 2.29 72.38 0.00 30.10 11.43 2.29 3.81 1.14 0.00std 57.56 48.30 69.50 0.00 13.52 168.54 0.00 77.09 31.54 9.42 15.70 6.76 0.00Makira exp mean 177.33 6.67 194.00 0.00 300.00 805.33 78.00 6.00 20.00 9.33 2.00 6.00 0.00std 447.37 20.52 336.80 0.00 1341.64 1832.71 189.42 19.57 61.56 23.73 8.94 26.83 0.00shelt mean 4.00 8.00 73.33 0.00 0.00 20.00 17.33 0.00 18.00 12.00 0.00 4.00 0.00std 12.31 20.93 148.13 0.00 0.00 55.82 44.98 0.00 46.65 45.14 0.00 12.31 0.00Malaita exp mean 15.47 14.93 51.73 5.33 28.80 131.20 34.67 108.80 4.80 1.60 9.60 0.00 1.60std 40.86 33.40 86.86 26.67 90.65 322.67 71.28 280.07 24.00 8.00 20.91 0.00 8.00shelt mean 1.60 10.13 27.20 0.00 0.00 52.27 0.00 8.53 5.87 0.00 0.00 0.00 0.00std 8.00 24.43 63.18 0.00 0.00 128.17 0.00 23.69 16.81 0.00 0.00 0.00 0.00Western exp mean 895.00 27.67 501.33 0.00 2.00 1422.00 619.67 15.67 1.00 28.00 7.67 9.33 0.00std 3470.03 57.87 1524.53 0.00 12.65 4984.42 2627.83 51.50 6.32 57.43 22.77 19.61 0.00shelt mean 0.00 12.27 99.73 0.00 0.00 37.87 78.40 0.00 200.00 22.40 5.87 13.87 0.00std 0.00 23.70 282.30 0.00 0.00 100.12 392.00 0.00 1000.00 72.18 16.81 29.18 0.00301
<strong>Solomon</strong> <strong>Islands</strong> <strong>Marine</strong> <strong>Assessment</strong> Technical ReportAppendix 9. Mean biomass of key families of food fishes on sheltered and exposed reef slopes (10m) in the <strong>Solomon</strong> <strong>Islands</strong>.Bony Fishes Sharks & RaysEmperorsFusiliersGoatfishesDrummersSnappersSurgeonfishesTriggerfishesParrotfishesSharksRaysProvince Island Site ExposureMeanBiomass(kg/ha)Central Floridas 1 shelt mean 11.93 0.00 0.00 0.00 52.13 27.17 103.50 61.77 0.00 0.00sd 16.76 0.00 0.00 0.00 58.92 21.19 130.25 67.15 0.00 0.002 exp mean 0.00 133.93 1.72 0.00 160.67 154.95 37.01 0.00 0.00 0.00sd 0.00 133.83 3.85 0.00 114.23 106.49 67.02 0.00 0.00 0.0062 exp mean 0.00 43.41 1.23 0.00 2.58 17.36 1.46 235.22 0.00 0.00sd 0.00 67.52 1.74 0.00 4.73 28.30 2.79 511.21 0.00 0.0063 shelt mean 0.49 1.61 0.32 0.00 0.00 13.67 2.21 0.00 0.00 0.00sd 0.49 1.58 0.64 0.00 0.00 4.47 2.38 0.00 0.00 0.00Central Russells 38 exp mean 1164.12 224.44 30.54 1036.40 2726.01 165.62 95.89 413.66 281.50 0.00sd 691.19 347.44 54.85 168.71 1398.49 262.50 120.26 425.86 264.56 0.0039 shelt mean 21.22 0.00 4.63 0.00 41.86 47.76 1.28 275.71 0.00 0.00sd 8.04 0.00 6.59 0.00 49.41 46.78 1.44 182.10 0.00 0.0040 exp mean 327.35 0.00 9.79 0.00 162.64 121.14 40.06 197.03 0.00 0.00sd 511.01 0.00 15.48 0.00 156.71 96.46 49.09 250.28 0.00 0.0041 shelt mean 300.18 52.78 0.00 1391.47 679.36 84.35 189.15 1061.86 78.34 0.00sd 489.48 118.03 0.00 3103.39 1351.25 148.48 227.67 1933.40 50.30 0.00Central Savo 64 exp mean 128.61 0.00 16.06 1232.38 560.94 65.60 6.06 0.00 0.00 0.00sd 130.77 0.00 19.01 2755.68 1122.20 53.49 9.82 0.00 0.00 0.00Choiseul Choiseul 17 exp mean 481.77 112.15 9.76 46.13 2195.99 655.03 170.46 867.03 0.00 0.00sd 699.02 205.82 9.25 103.14 1485.70 282.58 101.63 819.13 0.00 0.0018 shelt mean 103.42 56.27 5.46 0.00 320.62 49.74 29.42 90.51 0.00 0.00sd 129.79 48.89 10.71 0.00 355.26 17.75 49.02 202.38 0.00 0.0019 shelt mean 15.19 275.16 21.11 0.00 141.25 31.00 17.28 12.29 0.00 0.00sd 7.31 75.97 46.37 0.00 191.63 9.23 23.90 27.47 0.00 0.0020 exp mean 57.27 252.89 2.89 0.00 249.43 117.80 19.37 1022.17 186.75 0.00sd 45.18 363.87 5.18 0.00 173.32 86.30 31.72 1804.60 186.75 0.0021 exp mean 159.96 0.00 25.09 0.00 145.55 1406.12 168.62 2483.05 124.42 0.00sd 146.77 0.00 15.90 0.00 62.48 637.19 127.18 1616.31 124.42 0.00302
Fisheries Resources: Coral Reef FishesBony Fishes Sharks & RaysEmperorsFusiliersGoatfishesDrummersSnappersSurgeonfishesTriggerfishesParrotfishesSharksRaysProvince Island Site ExposureMeanBiomass(kg/ha)Choiseul(con’t) 22 shelt mean 137.70 0.00 308.67 0.00 147.61 52.40 26.37 1947.45 0.00 0.00sd 228.44 0.00 516.10 0.00 169.68 32.54 32.29 3270.58 0.00 0.0023 exp mean 112.60 116.81 11.62 1.44 60.96 125.82 3.24 55.80 0.00 0.00sd 127.48 192.78 16.90 3.21 64.11 80.21 1.99 74.43 0.00 0.0024 shelt mean 10.82 14.55 15.47 0.00 1.69 45.36 1.70 1.10 0.00 0.00sd 9.55 22.31 16.48 0.00 3.77 34.81 3.80 2.47 0.00 0.00Guadalcanal Guadalcanal 42 exp mean 34.34 0.00 25.96 0.00 55.00 722.79 32.69 0.00 0.00 0.00sd 45.63 0.00 35.61 0.00 102.40 1555.52 15.18 0.00 0.00 0.0043 shelt mean 88.09 1.90 8.49 0.00 347.16 12.77 37.69 0.00 27.93 135.27sd 137.34 4.24 18.99 0.00 517.44 7.64 36.87 0.00 27.93 135.2765 exp mean 21.44 0.00 8.12 0.00 63.86 27.88 24.32 1.15 0.00 0.00sd 15.01 0.00 12.18 0.00 95.34 12.69 28.49 2.58 0.00 0.0066 exp mean 0.00 0.00 0.17 0.00 0.04 81.23 5.29 0.00 555.44 0.00sd 0.00 0.00 0.39 0.00 0.10 170.58 6.87 0.00 555.44 0.00Isabel Arnavons 15 exp mean 822.42 88.51 7.92 287.69 2448.24 376.89 93.28 379.62 0.00 0.00sd 1065.05 138.51 11.34 393.94 3422.25 144.59 128.95 575.08 0.00 0.0016 shelt mean 279.21 31.45 3.83 0.00 209.99 146.43 9.28 349.15 23.39 0.00sd 279.95 54.75 5.45 0.00 173.24 221.17 10.78 548.92 23.39 0.00Isabel Isabel 3 exp mean 13.23 208.11 0.75 234.63 0.00 162.73 5.05 0.00 0.00 0.00sd 28.14 44.39 1.67 452.96 0.00 122.31 2.03 0.00 0.00 0.004 shelt mean 10.75 411.54 0.00 174.72 795.11 17.20 11.85 0.00 0.00 0.00sd 11.95 439.94 0.00 242.52 1167.73 29.87 13.77 0.00 0.00 0.005 exp mean 280.44 35.36 11.57 0.00 1289.35 489.23 98.66 0.00 0.00 0.00sd 586.43 69.07 14.98 0.00 2875.22 309.07 139.56 0.00 0.00 0.006 shelt mean 13.39 20.23 0.00 0.00 32.62 58.12 5.70 4.72 0.00 0.00sd 27.60 45.24 0.00 0.00 66.72 50.59 5.94 6.59 0.00 0.007 exp mean 54.15 476.47 1.28 220.60 839.11 117.08 38.92 1096.05 0.00 0.00sd 91.03 737.21 2.86 341.60 408.66 94.10 66.28 933.54 0.00 0.008 shelt mean 5.45 118.57 0.21 10.19 138.33 109.26 3.28 0.00 0.00 0.00sd 7.05 169.25 0.48 22.79 179.27 39.79 5.92 0.00 0.00 0.00303
<strong>Solomon</strong> <strong>Islands</strong> <strong>Marine</strong> <strong>Assessment</strong> Technical ReportBony Fishes Sharks & RaysEmperorsFusiliersGoatfishesDrummersSnappersSurgeonfishesTriggerfishesParrotfishesSharksRaysProvince Island Site ExposureMeanBiomass(kg/ha)Isabel (con’t) 9 exp mean 0.73 5.54 4.20 0.00 2.30 178.16 1.54 0.00 0.00 0.00sd 1.08 12.39 5.83 0.00 5.14 121.99 1.27 0.00 0.00 0.0010 shelt mean 8.24 8.72 3.11 0.00 0.43 39.42 0.47 0.00 0.00 0.00sd 12.50 13.81 6.96 0.00 0.96 35.14 0.68 0.00 0.00 0.0011 exp mean 535.03 363.43 4.82 0.00 1752.85 940.39 2428.45 1254.55 0.00 0.00sd 929.74 300.72 10.78 0.00 1271.04 957.30 1732.02 1459.38 0.00 0.0012 shelt mean 8.59 20.97 3.99 0.00 4.42 15.17 12.76 10.52 0.00 0.00sd 4.41 45.65 6.72 0.00 8.73 26.45 23.90 15.86 0.00 0.0013 exp mean 40.78 144.46 9.06 0.00 18.12 98.48 7.10 78.28 0.00 0.00sd 86.87 323.02 18.51 0.00 23.55 120.28 6.08 175.03 0.00 0.0014 shelt mean 204.60 570.23 0.24 0.00 30.39 260.04 20.19 28.12 0.00 0.00sd 285.31 731.67 0.53 0.00 18.64 469.72 28.85 37.21 0.00 0.00Makira Makira 44 exp mean 1424.59 0.00 26.83 1856.13 3894.63 104.55 11.83 1794.97 0.00 0.00sd 2632.75 0.00 43.18 2716.37 8162.98 66.47 25.01 2538.33 0.00 0.0045 shelt mean 9.50 3.15 11.67 0.00 0.00 180.80 2.88 61.57 0.00 0.00sd 11.91 4.39 23.26 0.00 0.00 364.77 2.77 51.97 0.00 0.0046 exp mean 263.70 25.29 1.27 2.87 655.33 99.80 5.74 1.15 41.47 0.00sd 380.23 56.55 1.80 6.42 1256.49 38.20 7.18 2.58 41.47 0.0047 shelt mean 2.77 0.00 15.28 0.00 30.62 6.74 8.28 0.00 1289.05 0.00sd 4.58 0.00 11.08 0.00 30.37 7.66 13.95 0.00 1095.58 0.00Makira Three Sisters 48 exp mean 26.66 0.00 9.11 0.00 104.33 70.90 4.30 4.10 0.00 0.00sd 18.04 0.00 14.92 0.00 193.62 46.73 3.58 9.17 0.00 0.0049 shelt mean 33.44 0.00 4.48 16.79 12.03 52.04 124.25 30.79 0.00 0.00sd 36.81 0.00 9.38 37.55 23.64 54.45 146.54 32.22 0.00 0.00Makira Ugi 50 exp mean 140.09 0.00 29.85 0.00 800.78 476.18 78.54 125.22 0.00 0.00sd 211.57 0.00 41.60 0.00 1364.78 605.51 93.93 181.96 0.00 0.0051 shelt mean 29.17 0.00 3.51 0.00 97.46 54.23 13.68 0.00 0.00 0.00sd 39.83 0.00 4.81 0.00 133.59 29.12 25.71 0.00 0.00 0.00Malaita Malaita 52 shelt mean 2.32 107.48 1.69 0.00 27.35 25.54 9.88 1.40 0.00 0.00sd 2.21 166.67 0.64 0.00 59.12 21.99 9.29 3.14 0.00 0.00304
Fisheries Resources: Coral Reef FishesBony Fishes Sharks & RaysEmperorsFusiliersGoatfishesDrummersSnappersSurgeonfishesTriggerfishesParrotfishesSharksRaysProvince Island Site ExposureMeanBiomass(kg/ha)Malaita (con’t) 53 exp mean 90.54 0.00 1.72 91.48 192.62 56.11 6.75 13.83 0.00 0.00sd 98.45 0.00 2.68 125.80 228.08 4.91 5.69 15.65 0.00 0.0054 shelt mean 2.49 20.60 8.76 0.00 0.27 13.13 6.89 0.00 0.00 0.00sd 4.46 44.48 5.02 0.00 0.61 11.07 5.97 0.00 0.00 0.0055 exp mean 34.99 0.00 1.85 4.80 521.98 286.94 6.62 27.13 0.00 22435.27sd 65.89 0.00 2.54 10.74 608.87 190.70 4.55 37.72 0.00 22435.2756 exp mean 21.89 214.32 0.96 0.00 3.28 66.56 4.54 0.00 0.00 0.00sd 18.56 166.35 1.32 0.00 3.12 80.25 5.99 0.00 0.00 0.0057 shelt mean 5.36 0.00 1.77 0.00 131.22 195.32 2.13 55.04 0.00 0.00sd 8.18 0.00 3.91 0.00 252.16 116.48 2.33 119.24 0.00 0.0058 exp mean 52.58 0.00 41.74 61.31 282.36 228.27 17.92 220.62 0.00 0.00sd 66.59 0.00 55.44 137.10 459.86 120.65 36.10 450.84 0.00 0.0059 shelt mean 49.50 6.32 1.85 0.00 27.86 137.06 3.40 69.91 0.00 0.00sd 62.71 14.14 1.38 0.00 39.32 76.97 2.68 156.32 0.00 0.0060 exp mean 4.47 5.63 5.26 11.38 4.28 88.24 0.40 0.00 0.00 0.00sd 3.32 8.39 6.59 18.47 4.92 51.09 0.76 0.00 0.00 0.0061 shelt mean 3.29 25.29 27.22 0.00 47.90 4.03 0.29 27.64 0.00 0.00sd 6.05 56.55 42.63 0.00 107.11 3.85 0.65 61.80 0.00 0.00Western New Georgia 29 exp mean 40.97 0.00 0.00 0.00 1953.68 3062.22 126.25 1757.36 388.12 0.00sd 68.03 0.00 0.00 0.00 2295.36 5128.26 117.11 2673.76 323.93 0.0030 exp mean 153.81 0.00 0.64 25.05 177.40 49.36 37.90 19.89 0.00 0.00sd 328.03 0.00 1.08 56.00 219.71 43.95 49.23 28.35 0.00 0.0031 shelt mean 20.32 331.16 8.76 0.00 6.35 76.00 23.75 2.99 22.54 0.00sd 13.75 222.66 5.32 0.00 10.07 33.11 15.85 5.53 22.54 0.0032 exp mean 118.35 37.93 4.74 0.00 2083.54 196.65 28.70 15.45 991.21 0.00sd 177.83 84.82 9.06 0.00 2482.72 194.25 37.34 34.55 991.21 0.0033 exp mean 81.86 401.27 48.37 278.52 532.88 28.86 85.09 745.47 0.00 0.00sd 133.09 322.78 37.72 243.73 520.22 21.04 176.15 1381.87 0.00 0.0034 exp mean 143.52 110.97 125.59 0.00 113.74 228.62 11.52 157.12 0.00 0.00sd 156.08 113.59 273.40 0.00 112.54 302.07 16.93 144.16 0.00 0.00305
<strong>Solomon</strong> <strong>Islands</strong> <strong>Marine</strong> <strong>Assessment</strong> Technical ReportBony Fishes Sharks & RaysEmperorsFusiliersGoatfishesDrummersSnappersSurgeonfishesTriggerfishesParrotfishesSharksRaysProvince Island Site ExposureMeanBiomass(kg/ha)New Georgia(con’t) 35 shelt mean 6.91 1327.67 8.05 0.00 181.93 364.80 1.77 69.53 107.81 0.00sd 6.08 1348.58 11.50 0.00 397.89 706.96 2.32 155.48 107.81 0.0036 exp mean 126.18 350.14 12.64 116.27 70.82 77.78 139.38 414.66 563.04 0.00sd 178.53 424.23 18.77 256.00 82.93 41.16 222.15 685.68 553.59 0.0037 shelt mean 68.29 399.57 2.59 0.00 163.70 75.10 96.60 306.19 1155.24 0.00sd 96.56 615.53 5.80 0.00 247.95 22.11 144.58 464.41 963.38 0.00Western Shortlands 25 exp mean 41.04 50.47 1.30 0.00 241.62 646.26 1.51 20.28 5.00 0.00sd 54.65 112.86 2.90 0.00 294.08 424.48 2.59 45.35 5.00 0.0026 shelt mean 13.67 26.41 3.03 0.00 40.69 91.23 14.12 1235.93 0.00 0.00sd 9.08 55.94 4.27 0.00 45.13 30.48 13.60 2763.63 0.00 0.0027 exp mean 5090.59 189.67 0.00 0.00 10357.05 3750.86 8.39 2464.48 343.17 0.00sd 5555.93 424.11 0.00 0.00 11100.92 2228.50 10.63 2256.92 210.49 0.0028 shelt mean 7.94 15.48 2.18 0.00 3.19 0.06 13.00 0.00 142.40 0.00sd 15.65 30.29 3.55 0.00 4.99 0.13 17.42 0.00 110.83 0.00306
Fisheries Resources: Coral Reef FishesAppendix 10. Mean biomass of each genera of food fishes in two key families (snappers and groupers) of reef fishes onsheltered and exposed reef slopes (10m) in the <strong>Solomon</strong> <strong>Islands</strong>.snappers groupersAprionLutjanusMacolorSymphorichthysCephalopholisCromileptesEpinephelusPlectropomusVariolaProvince Island Site ExposureMeanBiomass(kg/ha)Central Floridas 1 shelt mean 0.00 36.18 15.95 0.00 5.04 0.77 0.00 37.77 7.07std 0.00 36.04 35.67 0.00 11.27 1.72 0.00 31.41 9.712 exp mean 0.00 67.19 93.47 0.00 0.00 0.00 0.00 0.00 20.02std 0.00 66.60 128.37 0.00 0.00 0.00 0.00 0.00 12.0462 exp mean 0.00 0.00 2.58 0.00 1.20 0.00 1.36 0.00 5.02std 0.00 0.00 4.73 0.00 1.75 0.00 3.03 0.00 3.9263 shelt mean 0.00 0.00 0.00 0.00 0.00 0.00 0.00 6.61 0.00std 0.00 0.00 0.00 0.00 0.00 0.00 0.00 4.56 0.00Central Russells 38 exp mean 0.00 1779.90 946.11 0.00 1.07 0.00 0.00 32.38 0.00std 0.00 1087.18 940.64 0.00 2.39 0.00 0.00 46.21 0.0039 shelt mean 0.00 29.07 12.80 0.00 0.00 0.00 0.00 43.00 0.00std 0.00 22.98 28.61 0.00 0.00 0.00 0.00 70.68 0.0040 exp mean 0.00 18.14 144.51 0.00 1.30 0.00 0.00 16.44 0.75std 0.00 15.02 143.03 0.00 2.91 0.00 0.00 23.62 1.6841 shelt mean 0.00 622.40 56.96 0.00 0.77 0.00 16.32 33.43 0.00std 0.00 1382.84 41.47 0.00 1.71 0.00 36.50 43.00 0.00Central Savo 64 exp mean 0.00 47.33 513.61 0.00 6.76 0.00 0.00 0.00 0.00std 0.00 62.04 1147.23 0.00 11.04 0.00 0.00 0.00 0.00Choiseul Choiseul 17 exp mean 38.40 888.66 1268.94 0.00 2.03 0.00 0.00 0.00 12.00std 42.92 303.47 1274.32 0.00 2.78 0.00 0.00 0.00 18.9818 shelt mean 3.31 146.18 171.12 0.00 3.28 0.00 0.00 2.44 0.00std 7.41 183.13 183.48 0.00 2.75 0.00 0.00 5.46 0.0019 shelt mean 0.00 63.90 77.35 0.00 7.81 0.00 1.15 0.00 0.38std 0.00 103.81 92.68 0.00 6.24 0.00 2.56 0.00 0.8420 exp mean 0.00 102.26 147.17 0.00 2.21 0.00 0.00 17.28 0.93std 0.00 199.57 99.90 0.00 4.94 0.00 0.00 27.14 2.07307
<strong>Solomon</strong> <strong>Islands</strong> <strong>Marine</strong> <strong>Assessment</strong> Technical Reportsnappers groupersAprionLutjanusMacolorSymphorichthysCephalopholisCromileptesEpinephelusPlectropomusVariolaProvince Island Site ExposureMeanBiomass(kg/ha)Choiseul(con’t) 21 exp mean 41.70 0.00 103.85 0.00 2.02 0.00 0.00 0.00 86.97std 93.24 0.00 65.10 0.00 2.47 0.00 0.00 0.00 121.2022 shelt mean 0.00 25.28 122.33 0.00 5.64 0.00 0.00 0.00 5.18std 0.00 25.75 166.41 0.00 7.45 0.00 0.00 0.00 7.5423 exp mean 0.00 51.29 9.67 0.00 4.47 0.00 0.00 14.96 1.30std 0.00 67.43 6.84 0.00 8.90 0.00 0.00 33.44 2.0324 shelt mean 0.00 0.00 0.48 1.21 6.21 0.00 7.45 0.59 0.00std 0.00 0.00 1.06 2.70 13.89 0.00 11.98 1.33 0.00Guadalcanal Guadalcanal 42 exp mean 0.00 52.00 3.00 0.00 0.00 0.00 0.00 0.00 16.96std 0.00 102.62 2.62 0.00 0.00 0.00 0.00 0.00 32.9943 shelt mean 0.00 251.46 95.70 0.00 1.73 0.00 0.00 7.35 0.00std 0.00 341.12 214.00 0.00 1.81 0.00 0.00 7.04 0.0065 exp mean 0.00 5.53 58.33 0.00 0.00 0.00 1.11 0.00 5.75std 0.00 8.57 98.94 0.00 0.00 0.00 1.58 0.00 11.8466 exp mean 0.00 0.00 0.04 0.00 2.57 0.00 0.00 0.00 0.00std 0.00 0.00 0.10 0.00 5.75 0.00 0.00 0.00 0.00Isabel Arnavons 15 exp mean 35.92 1708.40 703.92 0.00 0.43 0.00 8.96 92.42 66.65std 34.62 2435.74 995.17 0.00 0.97 0.00 18.21 146.45 74.8816 shelt mean 10.52 103.11 96.36 0.00 1.30 0.00 0.00 69.03 2.61std 15.20 91.06 84.56 0.00 2.91 0.00 0.00 134.26 4.85Isabel Isabel 3 exp mean 0.00 0.00 0.00 0.00 3.25 0.00 0.00 0.00 1.25std 0.00 0.00 0.00 0.00 4.86 0.00 0.00 0.00 2.804 shelt mean 0.00 795.11 0.00 0.00 5.62 0.00 0.00 1.18 0.00std 0.00 1167.73 0.00 0.00 10.56 0.00 0.00 2.64 0.005 exp mean 0.00 1168.43 120.93 0.00 0.00 0.00 0.00 0.00 0.00std 0.00 2610.29 264.97 0.00 0.00 0.00 0.00 0.00 0.006 shelt mean 0.00 6.12 20.22 6.28 3.67 0.00 0.00 0.00 0.95std 0.00 10.70 42.10 14.04 7.92 0.00 0.00 0.00 2.06308
Fisheries Resources: Coral Reef Fishessnappers groupersAprionLutjanusMacolorSymphorichthysCephalopholisCromileptesEpinephelusPlectropomusVariolaProvince Island Site ExposureMeanBiomass(kg/ha)Isabel (con’t) 7 exp mean 23.37 313.66 502.08 0.00 0.00 0.00 0.00 4.04 0.00std 52.26 288.37 332.64 0.00 0.00 0.00 0.00 9.04 0.008 shelt mean 0.00 7.15 131.18 0.00 0.12 0.00 0.00 9.18 0.00std 0.00 11.06 168.29 0.00 0.27 0.00 0.00 14.69 0.009 exp mean 0.00 0.00 2.30 0.00 0.00 0.00 0.00 1.97 0.00std 0.00 0.00 5.14 0.00 0.00 0.00 0.00 2.70 0.0010 shelt mean 0.00 0.43 0.00 0.00 0.00 0.00 0.00 0.00 0.00std 0.00 0.96 0.00 0.00 0.00 0.00 0.00 0.00 0.0011 exp mean 0.00 1579.12 173.73 0.00 6.15 0.00 0.44 35.13 0.93std 0.00 1313.19 254.43 0.00 13.75 0.00 0.98 48.24 2.0712 shelt mean 0.00 0.43 0.00 3.99 0.00 0.00 0.00 0.00 0.00std 0.00 0.96 0.00 8.92 0.00 0.00 0.00 0.00 0.0013 exp mean 5.20 10.80 2.12 0.00 0.00 0.00 0.00 0.00 15.70std 11.62 24.16 2.66 0.00 0.00 0.00 0.00 0.00 14.1214 shelt mean 1.95 3.76 24.68 0.00 0.68 0.00 0.00 0.00 0.94std 4.36 4.32 16.54 0.00 0.99 0.00 0.00 0.00 2.07Makira Makira 44 exp mean 0.00 3773.74 120.88 0.00 0.00 0.00 0.00 16.27 0.00std 0.00 8225.27 197.92 0.00 0.00 0.00 0.00 32.83 0.0045 shelt mean 0.00 0.00 0.00 0.00 0.87 0.00 0.67 21.95 0.00std 0.00 0.00 0.00 0.00 1.19 0.00 1.50 25.06 0.0046 exp mean 0.00 299.27 356.06 0.00 0.00 0.00 0.00 0.00 3.46std 0.00 534.88 726.62 0.00 0.00 0.00 0.00 0.00 3.8747 shelt mean 0.00 30.44 0.18 0.00 4.96 0.00 44.48 4.11 1.91std 0.00 30.16 0.25 0.00 7.00 0.00 93.10 6.45 4.27Makira Three Sisters 48 exp mean 0.00 50.23 54.11 0.00 0.00 0.00 0.00 0.00 2.62std 0.00 91.87 102.10 0.00 0.00 0.00 0.00 0.00 4.8849 shelt mean 10.81 0.00 1.22 0.00 0.00 0.00 0.03 0.00 0.00std 24.18 0.00 2.69 0.00 0.00 0.00 0.06 0.00 0.00Makira Ugi 50 exp mean 14.70 133.75 652.32 0.00 0.00 0.00 0.00 0.00 6.69std 32.88 211.82 1432.07 0.00 0.00 0.00 0.00 0.00 11.85309
<strong>Solomon</strong> <strong>Islands</strong> <strong>Marine</strong> <strong>Assessment</strong> Technical Reportsnappers groupersAprionLutjanusMacolorSymphorichthysCephalopholisCromileptesEpinephelusPlectropomusVariolaProvince Island Site ExposureMeanBiomass(kg/ha)Ugi (con’t) 51 shelt mean 0.00 15.73 81.73 0.00 0.12 0.00 1.38 0.00 0.93std 0.00 24.14 111.95 0.00 0.27 0.00 3.05 0.00 2.07Malaita Malaita 52 shelt mean 0.00 0.74 26.61 0.00 0.12 0.00 0.81 16.68 0.00std 0.00 1.65 59.51 0.00 0.27 0.00 1.81 32.69 0.0053 exp mean 0.00 129.71 62.92 0.00 0.00 0.00 0.00 0.00 12.74std 0.00 163.08 120.54 0.00 0.00 0.00 0.00 0.00 15.6554 shelt mean 0.00 0.00 0.27 0.00 0.00 0.00 2.04 8.66 0.00std 0.00 0.00 0.61 0.00 0.00 0.00 3.05 8.33 0.0055 exp mean 52.51 83.61 385.87 0.00 0.00 0.00 0.00 29.24 0.00std 90.29 110.20 528.10 0.00 0.00 0.00 0.00 43.96 0.0056 exp mean 0.00 0.00 3.28 0.00 0.00 0.00 0.00 0.00 0.00std 0.00 0.00 3.12 0.00 0.00 0.00 0.00 0.00 0.0057 shelt mean 0.00 3.06 128.16 0.00 0.43 0.00 1.16 12.18 0.93std 0.00 6.84 253.10 0.00 0.97 0.00 1.79 13.75 2.0758 exp mean 0.00 77.73 204.63 0.00 2.42 0.00 0.00 0.00 0.93std 0.00 86.13 457.50 0.00 5.41 0.00 0.00 0.00 2.0759 shelt mean 0.00 22.91 4.95 0.00 7.14 0.00 11.89 1.32 0.00std 0.00 41.31 8.24 0.00 9.89 0.00 26.59 2.94 0.0060 exp mean 0.00 0.00 4.28 0.00 0.72 0.00 0.00 0.00 3.58std 0.00 0.00 4.92 0.00 1.61 0.00 0.00 0.00 5.1661 shelt mean 0.00 28.58 19.32 0.00 0.00 0.00 0.00 14.96 0.00std 0.00 63.90 43.21 0.00 0.00 0.00 0.00 33.44 0.00Western New Georgia 29 exp mean 43.25 896.47 1013.95 0.00 0.00 0.00 0.00 71.79 3.71std 70.49 801.80 1826.84 0.00 0.00 0.00 0.00 117.00 8.3030 exp mean 0.00 18.21 159.20 0.00 0.43 0.00 3.41 12.40 0.93std 0.00 22.75 202.99 0.00 0.97 0.00 7.63 27.72 2.0731 shelt mean 0.00 0.43 5.93 0.00 3.18 0.00 0.00 14.83 0.00std 0.00 0.96 9.19 0.00 3.49 0.00 0.00 20.03 0.0032 exp mean 0.00 1948.37 135.16 0.00 0.00 0.00 0.00 0.00 34.56std 0.00 2536.98 235.88 0.00 0.00 0.00 0.00 0.00 77.29310
Fisheries Resources: Coral Reef Fishessnappers groupersAprionLutjanusMacolorSymphorichthysCephalopholisCromileptesEpinephelusPlectropomusVariolaProvince Island Site ExposureMeanBiomass(kg/ha)New Georgia(con’t) 33 exp mean 0.00 347.12 185.76 0.00 6.03 0.77 0.00 20.22 0.00std 0.00 372.90 205.99 0.00 8.30 1.72 0.00 45.22 0.0034 exp mean 0.00 108.62 2.79 2.33 0.41 0.00 0.00 3.03 0.00std 0.00 111.27 4.94 5.22 0.91 0.00 0.00 6.78 0.0035 shelt mean 0.00 29.71 152.23 0.00 1.28 0.00 0.00 8.09 0.00std 0.00 65.23 332.67 0.00 2.86 0.00 0.00 11.08 0.0036 exp mean 0.00 21.23 49.59 0.00 0.81 0.00 0.00 27.88 0.00std 0.00 23.19 71.68 0.00 1.11 0.00 0.00 46.97 0.0037 shelt mean 63.43 25.13 75.13 0.00 0.43 0.00 0.35 13.78 5.17std 127.82 32.21 103.09 0.00 0.97 0.00 0.78 16.53 7.53Western Shortlands 25 exp mean 0.00 199.55 42.07 0.00 0.00 0.00 0.00 0.00 28.98std 0.00 300.65 54.26 0.00 0.00 0.00 0.00 0.00 34.7926 shelt mean 0.44 40.25 0.00 0.00 11.08 0.00 0.67 0.00 0.00std 0.98 44.45 0.00 0.00 22.37 0.00 1.50 0.00 0.0027 exp mean 0.00 4495.51 5861.55 0.00 0.00 0.00 0.00 0.00 0.00std 0.00 4762.97 12853.90 0.00 0.00 0.00 0.00 0.00 0.0028 shelt mean 0.00 3.19 0.00 0.00 0.87 0.00 0.98 0.00 0.86std 0.00 4.99 0.00 0.00 1.19 0.00 2.20 0.00 0.96311
<strong>Solomon</strong> <strong>Islands</strong> <strong>Marine</strong> <strong>Assessment</strong> Technical ReportAppendix 11. Mean biomass of each genera of food fishes in four key families (parrotfishes, surgeonfishes, emperors andfusiliers) of reef fishes on sheltered and exposed reef slopes (10m) in the <strong>Solomon</strong> <strong>Islands</strong>.parrotfishes surgeonfishes emperors fusiliersBolbometoponChlorurusHipposcarusAcanthurusCtenochaetusNasoLethrinusMonotaxisCaesioProvince Island Site ExposureMeanBiomass(kg/ha)Central Floridas 1 shelt mean 0.00 35.79 25.98 0.00 18.79 8.38 4.91 7.03 0.00std 0.00 49.84 28.14 0.00 11.50 13.79 10.97 15.71 0.002 exp mean 0.00 0.00 0.00 13.12 130.18 11.65 0.00 0.00 133.93std 0.00 0.00 0.00 21.33 115.63 6.84 0.00 0.00 133.8362 exp mean 229.89 5.33 0.00 11.80 5.56 0.00 0.00 0.00 43.41std 514.06 11.91 0.00 18.26 10.53 0.00 0.00 0.00 67.5263 shelt mean 0.00 0.00 0.00 0.00 3.37 10.29 0.00 0.49 1.61std 0.00 0.00 0.00 0.00 4.89 7.68 0.00 0.49 1.58Central Russells 38 exp mean 215.03 195.74 2.89 55.18 12.62 97.82 53.16 1110.96 224.44std 480.82 86.46 6.47 77.98 3.67 189.82 114.60 669.89 347.4439 shelt mean 0.00 20.56 255.15 29.53 12.18 6.05 1.03 20.19 0.00std 0.00 20.81 178.02 43.39 5.38 7.67 1.41 6.66 0.0040 exp mean 114.95 20.28 61.81 90.76 18.55 11.83 19.50 307.85 0.00std 257.03 45.35 69.93 91.73 7.83 9.47 23.96 520.24 0.0041 shelt mean 0.00 162.14 899.72 72.32 6.26 5.77 23.16 277.02 52.78std 0.00 242.53 1922.81 152.13 5.13 4.82 41.32 484.67 118.03Central Savo 64 exp mean 0.00 0.00 0.00 21.85 36.06 7.68 21.27 107.34 0.00std 0.00 0.00 0.00 48.87 22.63 7.45 19.72 119.89 0.00Choiseul Choiseul 17 exp mean 181.01 31.17 654.85 282.21 93.03 279.78 25.23 456.54 112.15std 404.75 43.74 626.36 251.42 82.45 100.51 49.23 716.06 205.8218 shelt mean 90.51 0.00 0.00 8.73 37.06 3.95 13.29 90.13 56.27std 202.38 0.00 0.00 19.53 13.76 8.82 26.04 104.01 48.8919 shelt mean 12.29 0.00 0.00 0.00 31.00 0.00 2.06 13.13 275.16std 27.47 0.00 0.00 0.00 9.23 0.00 1.15 7.47 75.9720 exp mean 0.00 13.65 1008.51 10.96 51.78 55.06 1.54 55.72 252.89std 0.00 18.90 1809.44 19.91 38.24 64.58 1.41 46.42 363.87312
Fisheries Resources: Coral Reef Fishesparrotfishes surgeonfishes emperors fusiliersBolbometoponChlorurusHipposcarusAcanthurusCtenochaetusNasoLethrinusMonotaxisCaesioProvince Island Site ExposureMeanBiomass(kg/ha)Choiseul(con’t) 21 exp mean 2483.05 0.00 0.00 637.29 41.46 727.37 58.73 101.24 0.00std 1616.31 0.00 0.00 247.99 15.76 558.79 54.01 124.98 0.0022 shelt mean 1941.68 5.77 0.00 12.64 39.76 0.00 15.47 122.23 0.00std 3274.84 12.90 0.00 18.72 16.08 0.00 34.60 194.30 0.0023 exp mean 0.00 55.80 0.00 26.93 80.18 18.71 82.58 30.02 116.81std 0.00 74.43 0.00 50.91 41.78 14.44 118.82 18.25 192.7824 shelt mean 0.00 1.10 0.00 15.72 29.64 0.00 0.00 10.82 14.55std 0.00 2.47 0.00 35.15 13.19 0.00 0.00 9.55 22.31Guadalcanal Guadalcanal 42 exp mean 0.00 0.00 0.00 709.34 11.93 1.52 12.39 21.96 0.00std 0.00 0.00 0.00 1556.07 7.52 3.40 27.69 27.95 0.0043 shelt mean 0.00 0.00 0.00 0.00 9.21 3.56 0.51 87.58 1.90std 0.00 0.00 0.00 0.00 4.21 3.86 1.15 137.71 4.2465 exp mean 0.00 1.15 0.00 6.00 21.88 0.00 0.00 21.44 0.00std 0.00 2.58 0.00 8.80 16.63 0.00 0.00 15.01 0.0066 exp mean 0.00 0.00 0.00 2.90 5.22 73.10 0.00 0.00 0.00std 0.00 0.00 0.00 4.61 7.47 163.47 0.00 0.00 0.00Isabel Arnavons 15 exp mean 0.00 203.73 175.90 175.87 53.02 148.00 159.08 663.35 88.51std 0.00 398.76 225.28 185.34 46.80 148.59 152.07 921.92 138.5116 shelt mean 160.41 55.35 133.38 121.68 22.72 2.03 32.73 246.48 31.45std 358.70 57.16 165.29 225.89 15.68 3.30 51.93 233.75 54.75Isabel Isabel 3 exp mean 0.00 0.00 0.00 35.32 109.58 17.83 1.30 11.92 208.11std 0.00 0.00 0.00 34.53 115.00 21.10 1.84 26.66 44.394 shelt mean 0.00 0.00 0.00 13.80 3.40 0.00 7.49 3.26 411.54std 0.00 0.00 0.00 30.85 7.61 0.00 13.62 3.73 439.945 exp mean 0.00 0.00 0.00 57.44 328.35 103.44 13.27 267.17 35.36std 0.00 0.00 0.00 61.49 328.94 198.17 14.53 572.18 69.076 shelt mean 0.00 2.72 2.00 0.74 43.58 13.80 1.15 12.25 20.23std 0.00 6.09 4.47 1.65 26.97 24.12 0.76 27.38 45.247 exp mean 950.00 0.00 146.05 33.34 67.39 16.35 32.06 22.09 476.47std 875.00 0.00 142.94 46.10 53.84 17.78 44.68 47.58 737.21313
<strong>Solomon</strong> <strong>Islands</strong> <strong>Marine</strong> <strong>Assessment</strong> Technical Reportparrotfishes surgeonfishes emperors fusiliersBolbometoponChlorurusHipposcarusAcanthurusCtenochaetusNasoLethrinusMonotaxisCaesioProvince Island Site ExposureMeanBiomass(kg/ha)Isabel (con’t) 8 shelt mean 0.00 0.00 0.00 6.53 47.85 54.88 5.45 0.00 118.57std 0.00 0.00 0.00 10.68 13.55 32.05 7.05 0.00 169.259 exp mean 0.00 0.00 0.00 63.01 115.15 0.00 0.73 0.00 5.54std 0.00 0.00 0.00 117.68 82.32 0.00 1.08 0.00 12.3910 shelt mean 0.00 0.00 0.00 10.82 28.60 0.00 1.84 6.40 8.72std 0.00 0.00 0.00 20.36 22.48 0.00 1.98 12.54 13.8111 exp mean 919.85 138.41 196.28 685.78 221.09 33.51 32.30 502.73 363.43std 1388.48 203.71 233.92 1035.76 112.82 64.37 68.92 934.85 300.7212 shelt mean 0.00 0.00 10.52 15.14 0.00 0.03 0.73 7.87 20.97std 0.00 0.00 15.86 26.47 0.00 0.07 1.08 4.81 45.6513 exp mean 0.00 0.00 78.28 7.10 40.50 50.88 1.57 39.21 144.46std 0.00 0.00 175.03 10.97 24.48 109.53 3.50 87.68 323.0214 shelt mean 0.00 0.90 27.23 229.82 19.05 11.18 5.61 198.99 570.23std 0.00 2.01 37.97 464.37 10.10 15.82 7.29 278.10 731.67Makira Makira 44 exp mean 1468.91 22.87 303.20 68.01 15.13 21.41 0.00 1424.59 0.00std 2418.59 51.13 349.88 74.71 19.39 22.54 0.00 2632.75 0.0045 shelt mean 6.86 24.45 30.26 166.92 1.23 12.64 0.51 8.99 3.15std 8.53 32.06 54.75 368.39 2.76 24.24 1.15 12.33 4.3946 exp mean 0.00 1.15 0.00 0.00 94.54 5.25 0.51 263.19 25.29std 0.00 2.58 0.00 0.00 39.49 3.39 1.15 380.67 56.5547 shelt mean 0.00 0.00 0.00 0.00 6.74 0.00 0.00 2.77 0.00std 0.00 0.00 0.00 0.00 7.66 0.00 0.00 4.58 0.00Makira Three Sisters 48 exp mean 0.00 4.10 0.00 6.28 62.19 2.42 0.00 26.66 0.00std 0.00 9.17 0.00 9.86 37.65 3.23 0.00 18.04 0.0049 shelt mean 0.00 4.10 26.69 2.99 10.49 38.56 4.51 28.93 0.00std 0.00 9.17 25.52 6.69 8.07 53.12 8.72 38.17 0.00Makira Ugi 50 exp mean 56.71 68.52 0.00 0.00 29.95 446.23 8.76 131.32 0.00std 126.80 85.42 0.00 0.00 16.09 601.73 14.01 216.69 0.0051 shelt mean 0.00 0.00 0.00 13.17 36.69 4.37 21.24 7.93 0.00std 0.00 0.00 0.00 29.44 23.37 6.86 31.04 10.89 0.00314
Fisheries Resources: Coral Reef Fishesparrotfishes surgeonfishes emperors fusiliersBolbometoponChlorurusHipposcarusAcanthurusCtenochaetusNasoLethrinusMonotaxisCaesioProvince Island Site ExposureMeanBiomass(kg/ha)Malaita Malaita 52 shelt mean 0.00 0.00 1.40 3.86 21.68 0.00 0.00 2.32 107.48std 0.00 0.00 3.14 5.32 22.36 0.00 0.00 2.21 166.6753 exp mean 0.00 10.94 2.89 7.85 40.01 8.24 0.51 90.03 0.00std 0.00 16.80 6.47 17.55 18.68 17.05 1.15 98.93 0.0054 shelt mean 0.00 0.00 0.00 6.88 6.25 0.00 2.06 0.44 20.60std 0.00 0.00 0.00 9.42 5.80 0.00 4.60 0.97 44.4855 exp mean 0.00 15.56 11.57 135.20 89.54 62.20 0.00 34.99 0.00std 0.00 25.46 25.87 82.60 36.39 124.31 0.00 65.89 0.0056 exp mean 0.00 0.00 0.00 5.03 57.61 3.92 0.00 21.89 214.32std 0.00 0.00 0.00 11.25 81.37 4.00 0.00 18.56 166.3557 shelt mean 0.00 53.66 1.38 0.00 173.15 22.17 0.51 4.85 0.00std 0.00 119.98 3.09 0.00 117.51 20.15 1.15 7.11 0.0058 exp mean 191.58 0.00 29.04 1.75 175.37 51.15 1.03 51.55 0.00std 428.38 0.00 39.97 3.91 87.67 92.57 1.41 67.28 0.0059 shelt mean 69.91 0.00 0.00 0.00 114.38 22.68 20.86 28.64 6.32std 156.32 0.00 0.00 0.00 49.02 35.45 42.38 58.74 14.1460 exp mean 0.00 0.00 0.00 0.00 24.90 63.34 2.08 2.39 5.63std 0.00 0.00 0.00 0.00 15.38 65.04 3.41 3.44 8.3961 shelt mean 27.64 0.00 0.00 0.00 4.03 0.00 2.84 0.45 25.29std 61.80 0.00 0.00 0.00 3.85 0.00 5.06 1.01 56.55Western New Georgia 29 exp mean 0.00 139.49 1617.88 120.44 0.00 2941.77 9.61 31.37 0.00std 0.00 205.02 2763.10 224.34 0.00 5135.76 21.48 70.14 0.0030 exp mean 0.00 19.89 0.00 36.43 0.00 12.94 1.03 152.78 0.00std 0.00 28.35 0.00 26.10 0.00 20.78 1.41 328.63 0.0031 shelt mean 0.00 2.99 0.00 0.00 70.55 5.45 0.90 19.42 331.16std 0.00 5.53 0.00 0.00 38.17 7.44 2.01 13.93 222.6632 exp mean 0.00 15.45 0.00 12.59 82.03 102.04 75.10 43.25 37.93std 0.00 34.55 0.00 18.04 30.35 175.64 165.06 80.34 84.8233 exp mean 0.00 4.57 740.90 18.21 6.09 4.56 0.00 81.86 401.27std 0.00 10.23 1384.75 24.18 7.45 6.30 0.00 133.09 322.78315
<strong>Solomon</strong> <strong>Islands</strong> <strong>Marine</strong> <strong>Assessment</strong> Technical Reportparrotfishes surgeonfishes emperors fusiliersBolbometoponChlorurusHipposcarusAcanthurusCtenochaetusNasoLethrinusMonotaxisCaesioProvince Island Site ExposureMeanBiomass(kg/ha)New Georgia(con’t) 34 exp mean 141.77 2.46 12.89 178.03 39.96 10.63 1.54 141.98 110.97std 144.23 5.50 19.34 313.48 22.04 17.21 1.41 156.50 113.5935 shelt mean 0.00 69.53 0.00 10.19 19.67 334.94 3.60 3.31 1327.67std 0.00 155.48 0.00 18.98 14.44 715.93 3.45 7.40 1348.5836 exp mean 31.19 49.41 334.06 10.48 33.37 33.93 2.99 123.19 350.14std 44.28 71.35 628.68 12.11 21.63 55.61 5.37 180.74 424.2337 shelt mean 215.03 80.73 10.44 2.11 62.18 10.81 0.00 68.29 399.57std 480.82 159.79 23.34 4.73 23.35 6.14 0.00 96.56 615.53Western Shortlands 25 exp mean 0.00 20.28 0.00 479.72 83.72 82.82 41.04 0.00 50.47std 0.00 45.35 0.00 307.44 51.70 141.77 54.65 0.00 112.8626 shelt mean 1113.97 121.96 0.00 0.00 91.23 0.00 4.63 9.04 26.41std 2490.92 272.71 0.00 0.00 30.48 0.00 4.60 6.30 55.9427 exp mean 0.00 64.65 2399.83 3594.54 0.00 156.32 0.00 5090.59 189.67std 0.00 101.48 2171.04 2289.61 0.00 328.47 0.00 5555.93 424.1128 shelt mean 0.00 0.00 0.00 0.03 0.00 0.03 1.03 6.91 15.48std 0.00 0.00 0.00 0.06 0.00 0.07 2.30 13.36 30.29316
Fisheries Resources: Coral Reef FishesAppendix 12: Mean biomass of three key species tarteted by the livereef food fish trade on sheltered and exposed reef slopes (10m) in the<strong>Solomon</strong> <strong>Islands</strong>.ProvinceExposureMeanBiomass(kg/ha)BrownmarbledgrouperCamouflagegrouperSquaretailcoralgrouperCentral exp mean 0.00 0.00 2.05std 0.00 0.00 7.26shelt mean 0.00 4.08 16.81std 0.00 18.25 28.72Choiseul exp mean 0.00 0.00 4.32std 0.00 0.00 14.63shelt mean 1.38 0.49 0.76std 6.15 2.18 2.77Guadalcanal exp mean 0.00 0.00 0.00std 0.00 0.00 0.00shelt mean 0.00 0.00 6.21std 0.00 0.00 7.16Isabel exp mean 1.18 0.00 16.14std 7.00 0.00 60.06shelt mean 0.00 0.00 2.14std 0.00 0.00 5.88Makira exp mean 0.00 0.00 0.00std 0.00 0.00 0.00shelt mean 10.55 0.00 0.00std 47.17 0.00 0.00Malaita exp mean 0.00 0.00 2.86std 0.00 0.00 8.10shelt mean 2.38 0.00 2.59std 11.89 0.00 4.92Western exp mean 0.00 0.43 16.86std 0.00 2.70 49.64shelt mean 0.00 0.20 6.20std 0.00 0.98 13.22317
<strong>Solomon</strong> <strong>Islands</strong> <strong>Marine</strong> <strong>Assessment</strong> Technical ReportAppendix 13. Mean biomass of large reef fishes (30cm or more in size) of sharks, rays and some key families of bony fishes on shelteredand exposed reef slopes (10m) in the <strong>Solomon</strong> <strong>Islands</strong>.Bony Fishes Sharks & RaysExposureEmperorsGroupersParrotfishesRabbitfishesDrummersSnappersSurgeonfishesSweetlipsTrevalliesTriggerfishesWrassesSharksRaysProvinceMeanBiomass(kg/ha)Central exp mean 200.71 9.77 184.94 191.72 294.04 526.77 15.40 21.51 0.00 30.89 37.90 56.30 0.00std 471.90 24.99 343.79 909.96 1243.72 959.42 47.83 47.03 0.00 69.39 101.43 267.45 0.00shelt mean 69.51 23.32 126.68 0.00 0.00 30.21 0.00 3.20 0.00 69.05 11.03 19.59 0.00std 242.52 51.83 175.84 0.00 0.00 43.18 0.00 14.29 0.00 144.14 38.77 62.25 0.00Choiseul exp mean 86.98 31.26 1041.53 3.99 0.00 369.58 61.61 15.95 11.67 90.46 10.10 77.79 0.00std 374.95 68.00 1484.50 17.85 0.00 861.90 174.59 39.52 37.65 116.80 27.46 244.72 0.00shelt mean 19.55 3.65 553.15 181.57 0.00 85.06 2.50 13.42 38.70 12.22 9.67 0.00 0.00std 87.43 9.18 1808.70 812.02 0.00 159.04 11.16 36.10 173.05 31.33 25.00 0.00 0.00Guadalcanal exp mean 0.00 6.21 23.48 2.66 0.00 15.10 0.00 16.52 0.00 11.09 0.00 185.15 0.00std 0.00 18.00 59.49 10.30 0.00 58.49 0.00 42.47 0.00 22.96 0.00 717.07 0.00shelt mean 0.00 0.00 55.80 0.00 0.00 95.70 0.00 0.00 0.00 11.09 0.00 27.93 135.27std 0.00 0.00 60.45 0.00 0.00 214.00 0.00 0.00 0.00 24.80 0.00 62.46 302.48Isabel exp mean 149.58 27.37 391.86 4.56 0.00 655.61 129.38 81.23 17.26 374.88 27.93 0.00 0.00std 592.54 71.18 788.66 26.98 0.00 1550.02 431.88 205.73 52.58 1039.02 80.50 0.00 0.00shelt mean 16.00 13.78 42.78 0.00 1.46 41.12 0.00 40.03 8.31 3.17 19.03 3.34 0.00std 53.79 53.49 151.29 0.00 8.61 95.10 0.00 139.51 23.91 13.06 106.43 19.77 0.00Makira exp mean 325.08 5.12 494.06 0.00 191.12 1221.82 113.82 4.31 29.65 19.54 4.54 10.37 0.00std 1094.35 17.52 1422.09 0.00 854.71 3815.79 315.20 14.06 96.33 55.31 20.31 46.37 0.00shelt mean 5.52 15.20 48.50 0.00 0.00 24.36 11.40 0.00 61.76 21.45 0.00 322.26 0.00std 17.53 48.50 90.05 0.00 0.00 67.28 30.24 0.00 223.98 83.81 0.00 1261.52 0.00Malaita exp mean 15.12 9.07 79.78 3.19 18.35 147.32 25.43 138.02 10.70 3.09 34.48 0.00 4487.05std 41.01 23.73 209.20 15.96 57.75 334.28 54.15 349.10 53.49 15.46 80.80 0.00 22435.27shelt mean 3.76 9.78 38.50 0.00 0.00 44.23 0.00 12.44 7.18 0.00 0.00 0.00 0.00std 18.80 23.80 89.30 0.00 0.00 124.68 0.00 36.27 22.07 0.00 0.00 0.00 0.00Western exp mean 665.68 24.23 423.48 0.00 3.13 1428.76 464.59 12.44 0.86 44.24 15.36 286.32 0.00std 2459.94 55.10 1273.41 0.00 19.80 4917.59 1990.20 40.58 5.43 101.19 47.91 924.38 0.00shelt mean 0.00 6.55 328.71 0.00 0.00 33.68 51.58 0.00 178.86 21.16 4.05 285.60 0.00std 0.00 13.69 1241.05 0.00 0.00 97.56 257.91 0.00 894.28 68.20 11.44 996.79 0.00318
Fisheries Resources: Coral Reef FishesAppendix 14. Mean density of large vulnerable reef fishes on sheltered and exposed reef slopes (10m) in the <strong>Solomon</strong> <strong>Islands</strong>ProvinceBONY FISHES SHARKS & RAYSExposureMean Density(per ha)Humphead WrasseHumphead ParrotfishSteephead ParrotfishGiant TrevallyBaramundi CodBrown-marbledgrouperCamouflage grouperWhite-edged lyretailYellow-edged lyretailLongfin emperorLongface emperorSpotcheek emperorYellowlip emperorManta raysSpotted eagle rayBlacktip Reef SharkWhite Tip Reef SharkUnid SharkCentral exp mean 0.53 0.80 1.33 0.00 0.00 0.00 0.27 0.53 5.07 2.13 0.00 0.00 0.00 0.00 0.00 0.00 0.00 0.00sd 0.73 1.79 2.98 0.00 0.00 0.00 0.60 0.73 9.26 2.92 0.00 0.00 0.00 0.00 0.00 0.00 0.00 0.00shelt mean 2.67 0.00 1.00 0.00 0.00 1.33 0.33 0.33 0.33 1.67 0.00 0.00 0.00 0.00 0.00 0.00 0.00 0.00sd 3.77 0.00 2.00 0.00 0.00 2.67 0.67 0.67 0.67 2.00 0.00 0.00 0.00 0.00 0.00 0.00 0.00 0.00Choiseul exp mean 3.33 0.67 3.67 0.00 0.00 0.33 0.00 0.00 8.00 3.00 0.00 3.67 1.00 0.00 0.00 0.00 0.00 0.00sd 5.81 1.33 4.27 0.00 0.00 0.67 0.00 0.00 11.98 2.00 0.00 7.33 2.00 0.00 0.00 0.00 0.00 0.00shelt mean 0.33 0.67 0.33 0.00 0.00 0.00 0.00 0.00 2.00 4.00 0.00 0.67 0.00 0.00 0.00 0.00 0.33 0.00sd 0.67 0.77 0.67 0.00 0.00 0.00 0.00 0.00 1.72 4.75 0.00 1.33 0.00 0.00 0.00 0.00 0.67 0.00Guadalcanal exp mean 1.78 0.00 0.00 0.00 0.00 0.00 0.00 0.00 4.45 0.00 0.00 0.00 0.00 0.00 0.00 0.00 1.33 0.00sd 3.08 0.00 0.00 0.00 0.00 0.00 0.00 0.00 7.70 0.00 0.00 0.00 0.00 0.00 0.00 0.00 2.31 0.00shelt mean 0.00 0.00 0.00 0.00 0.00 0.00 0.00 2.67 0.00 0.00 0.00 0.00 0.00 0.00 0.00 0.00 0.00 0.00sd 0.00 0.00 0.00 0.00 0.00 0.00 0.00 0.00 0.00 0.00 0.00 0.00 0.00 0.00 0.00 0.00 0.00 0.00Isabel exp mean 1.33 2.67 1.33 0.00 0.19 0.00 0.00 0.00 4.76 0.57 0.57 0.95 0.00 0.00 0.19 0.00 0.00 0.00sd 1.54 5.11 1.89 0.00 0.50 0.00 0.00 0.00 8.43 1.05 1.51 1.99 0.00 0.00 0.50 0.00 0.00 0.00shelt mean 0.38 0.38 0.38 0.19 0.00 0.19 0.38 1.71 3.24 5.14 1.14 1.14 0.00 0.00 0.19 0.00 0.00 0.00sd 1.01 1.01 1.01 0.50 0.00 0.50 0.65 2.63 4.61 9.28 1.95 1.62 0.00 0.00 0.50 0.00 0.00 0.00Makira exp mean 2.00 0.33 0.67 0.00 0.00 0.00 0.00 0.00 1.33 3.33 0.00 1.00 0.00 0.00 0.00 0.00 0.33 0.00sd 4.00 0.67 0.77 0.00 0.00 0.00 0.00 0.00 1.09 3.85 0.00 2.00 0.00 0.00 0.00 0.00 0.67 0.00shelt mean 0.00 0.00 4.00 0.00 0.00 0.00 0.67 1.33 1.00 4.00 17.33 1.00 0.00 0.00 0.00 0.00 0.00 0.00sd 0.00 0.00 7.14 0.00 0.00 0.00 1.33 2.67 2.00 5.44 25.83 2.00 0.00 0.00 0.00 0.00 0.00 0.00Malaita exp mean 0.53 1.33 0.27 0.00 0.00 0.00 1.33 0.00 1.33 0.80 2.93 2.67 0.80 0.00 0.00 0.00 0.53 0.00sd 1.19 2.98 0.60 0.00 0.00 0.00 2.98 0.00 2.31 1.19 6.56 3.77 1.79 0.00 0.00 0.00 1.19 0.00shelt mean 0.27 0.00 0.00 0.00 0.00 0.27 0.00 1.07 0.80 1.07 0.00 0.00 0.00 0.00 0.00 0.00 0.00 0.00sd 0.600.00 0.00 0.00 0.00 0.60 0.00 1.74 1.79 1.12 0.00 0.00 0.00 0.00 0.00 0.00 0.00 0.00319
<strong>Solomon</strong> <strong>Islands</strong> <strong>Marine</strong> <strong>Assessment</strong> Technical ReportProvinceWestern exp meanBONY FISHES SHARKS & RAYSExposureMean Density(per ha)Humphead WrasseHumphead ParrotfishSteephead ParrotfishGiant TrevallyBaramundi CodBrown-marbledgrouperCamouflage grouperWhite-edged lyretailYellow-edged lyretailLongfin emperorLongface emperorSpotcheek emperorYellowlip emperorManta raysSpotted eagle rayBlacktip Reef SharkWhite Tip Reef SharkUnid Sharkshelt2.17 7.33 3.33 0.00 0.00 0.00 0.00 0.50 1.33 1.83 0.83 0.83 0.00 0.17 0.00 0.17 0.00 0.00sd 1.74 11.93 5.19 0.00 0.00 0.00 0.00 0.69 1.59 2.46 1.41 1.88 0.00 0.47 0.00 0.47 0.00 0.00mean 0.00 0.00 1.33 0.00 0.00 0.27 0.00 0.00 1.07 1.07 0.00 0.00 0.00 0.00 0.00 0.00 0.27 0.27sd 0.00 0.00 2.98 0.00 0.00 0.60 0.00 0.00 1.74 2.39 0.00 0.00 0.00 0.00 0.00 0.00 0.60 0.60320
Fisheries Resources: Coral Reef FishesAppendix 15. Mean biomass of large vulnerable reef fishes on sheltered and exposed reef slopes (10m) in the <strong>Solomon</strong> <strong>Islands</strong>.BONY FISHES SHARKS & RAYSExposureHumphead WrasseHumphead ParrotfishSteephead ParrotfishGiant TrevallyBaramundi CodBrown-marbledGrouperCamouflage GrouperWhite-edged LyretailYellow-edged LyretailLongfin EmperorLongface EmperorSpotcheek EmperorYellowlip EmperorManta RaySpotted Eagle RayBlacktip Reef SharkWhitetip Reef SharkUnid SharkProvinceMeanBiomass(kg/ha)Central exp mean 1.02 3.57 0.55 0.00 0.00 0.00 0.01 0.40 1.29 0.10 0.00 0.00 0.00 0.00 0.00 0.00 0.00 0.00sd 1.44 7.98 1.23 0.00 0.00 0.00 0.02 0.88 2.69 0.15 0.00 0.00 0.00 0.00 0.00 0.00 0.00 0.00shelt mean 3.55 0.00 0.53 0.00 0.00 1.98 0.04 0.03 0.02 0.11 0.00 0.00 0.00 0.00 0.00 0.00 0.00 0.00sd 6.90 0.00 1.05 0.00 0.00 3.96 0.08 0.06 0.03 0.13 0.00 0.00 0.00 0.00 0.00 0.00 0.00 0.00Choiseul exp mean 23.90 10.58 1.48 0.00 0.00 0.50 0.00 0.00 2.48 0.18 0.00 1.86 0.51 0.00 0.00 0.00 0.00 0.00sd 46.91 21.15 1.72 0.00 0.00 0.99 0.00 0.00 3.86 0.12 0.00 3.73 1.01 0.00 0.00 0.00 0.00 0.00shelt mean 0.11 9.75 0.32 0.00 0.00 0.00 0.00 0.00 0.35 0.27 0.00 0.11 0.00 0.00 0.00 0.00 6.72 0.00sd 0.23 17.46 0.64 0.00 0.00 0.00 0.00 0.00 0.27 0.29 0.00 0.22 0.00 0.00 0.00 0.00 13.44 0.00Guadalcanal exp mean 4.90 0.00 0.00 0.00 0.00 0.00 0.00 0.00 1.73 0.00 0.00 0.66 0.00 0.00 0.00 0.00 10.53 0.00sd 8.48 0.00 0.00 0.00 0.00 0.00 0.00 0.00 1.30 0.00 0.00 1.15 0.00 0.00 0.00 0.00 18.25 0.00shelt mean 0.00 0.00 0.00 0.00 0.00 0.00 0.00 1.10 0.00 0.00 0.00 0.00 0.00 0.00 0.00 0.00 0.00 0.00sd 0.00 0.00 0.00 0.00 0.00 0.00 0.00 0.00 0.00 0.00 0.00 0.00 0.00 0.00 0.00 0.00 0.00 0.00Isabel exp mean 3.00 33.81 0.64 0.00 0.06 0.00 0.00 0.00 0.57 0.05 0.14 0.20 0.00 0.00 1.88 0.00 0.00 0.00sd 4.82 64.56 1.06 0.00 0.16 0.00 0.00 0.00 1.08 0.11 0.37 0.44 0.00 0.00 4.96 0.00 0.00 0.00shelt mean 0.23 1.85 0.37 0.06 0.00 0.13 0.19 0.66 0.52 0.33 0.73 0.08 0.00 0.00 3.22 0.00 0.00 0.00sd 0.62 4.89 0.97 0.17 0.00 0.35 0.44 1.32 0.77 0.60 1.32 0.14 0.00 0.00 8.52 0.00 0.00 0.00Makira exp mean 0.93 10.77 0.38 0.00 0.00 0.00 0.00 0.00 0.19 0.38 0.00 0.36 0.00 0.00 0.00 0.00 0.32 0.00sd 1.86 21.55 0.44 0.00 0.00 0.00 0.00 0.00 0.29 0.51 0.00 0.72 0.00 0.00 0.00 0.00 0.63 0.00shelt mean 0.00 0.00 1.79 0.00 0.00 0.00 0.08 0.09 0.01 0.25 15.65 0.20 0.00 0.00 0.00 0.00 0.00 0.00sd 0.00 0.00 3.46 0.00 0.00 0.00 0.16 0.18 0.03 0.35 28.64 0.40 0.00 0.00 0.00 0.00 0.00 0.00Malaita exp mean 0.29 7.39 0.26 0.00 0.00 0.00 0.57 0.00 0.29 0.08 1.14 1.32 0.41 0.00 0.00 0.00 2.76 0.00sd 0.66 16.52 0.58 0.00 0.00 0.00 1.27 0.00 0.63 0.13 2.55 1.96 0.91 0.00 0.00 0.00 6.17 0.00shelt mean 0.09 0.00 0.00 0.00 0.00 0.55 0.00 0.08 0.19 0.07 0.00 0.00 0.00 0.00 0.00 0.00 0.00 0.00sd 0.20 0.00 0.00 0.00 0.00 1.22 0.00 0.14 0.42 0.07 0.00 0.00 0.00 0.00 0.00 0.00 0.00 0.00321
<strong>Solomon</strong> <strong>Islands</strong> <strong>Marine</strong> <strong>Assessment</strong> Technical ReportBONY FISHES SHARKS & RAYSExposureHumphead WrasseHumphead ParrotfishSteephead ParrotfishGiant TrevallyBaramundi CodBrown-marbledGrouperCamouflage GrouperWhite-edged LyretailYellow-edged LyretailLongfin EmperorLongface EmperorSpotcheek EmperorYellowlip EmperorManta RaySpotted Eagle RayBlacktip Reef SharkWhitetip Reef SharkUnid SharkProvinceMeanBiomass(kg/ha)Western exp mean 10.42 103.02 3.04 0.00 0.00 0.00 0.00 0.29 0.53 0.12 1.26 0.38 0.00 51.50 0.00 1.92 0.00 0.00sd 12.37 197.92 4.79 0.00 0.00 0.00 0.00 0.53 1.08 0.16 2.37 0.93 0.00 145.66 0.00 5.42 0.00 0.00shelt mean 0.00 0.00 1.29 0.00 0.00 0.24 0.00 0.00 0.43 0.07 0.00 0.00 0.00 0.00 0.00 0.00 0.35 7.28sd 0.00 0.00 2.88 0.00 0.00 0.53 0.00 0.00 0.81 0.15 0.00 0.00 0.00 0.00 0.00 0.00 0.78 16.29322
Fisheries Resources: Coral Reef FishesAppendix 16. Mean density of aquarium fishes on sheltered and exposed reef slopes (10m) in the <strong>Solomon</strong> <strong>Islands</strong>.Mean Density(per ha)AngelfishesButterflyfishesDamselfishesFairy bassletsHawkfishesLeatherjacketsParrotfishesPuffersSurgeonfishesSweetlipsTriggerfishesWrassesProvince Island Site ExposureCentral Floridas 1 shelt mean346.67 40.00 2840.00 173.33 0.00 0.00 0.00 0.00 26.67 0.00 13.33 960.00std 152.02 59.63 1762.32 238.51 0.00 0.00 0.00 0.00 36.51 0.00 29.81 1121.112 exp mean 106.67 466.67 7013.33 93.33 13.33 0.00 0.00 0.00 693.33 253.33 0.00 746.67std 173.85 194.37 6630.80 101.11 29.81 0.00 0.00 0.00 138.24 186.43 0.00 425.3162 exp mean 560.00 160.00 4200.00 2842.67 0.00 0.00 0.00 0.00 346.67 0.00 40.00 10093.33std 417.93 203.31 5525.70 3596.09 0.00 0.00 0.00 0.00 694.17 0.00 59.63 4849.6563 shelt mean 120.00 280.00 4733.33 40.00 0.00 0.00 13.33 0.00 26.67 21.33 0.00 480.00std 128.24 218.07 1935.06 59.63 0.00 0.00 29.81 0.00 59.63 47.70 0.00 237.58Central Russells 38 exp mean 80.00 440.00 33733.33 3813.33 40.00 0.00 53.33 0.00 792.00 120.00 80.00 426.67std 86.92 417.93 19366.92 4416.48 59.63 0.00 86.92 0.00 309.35 74.83 93.81 138.2439 shelt mean 66.67 346.67 25200.00 40.00 0.00 0.00 0.00 0.00 218.67 0.00 0.00 613.33std 47.14 196.64 8342.00 36.51 0.00 0.00 0.00 0.00 249.91 0.00 0.00 159.1640 exp mean 80.00 640.00 15133.33 810.67 13.33 0.00 0.00 0.00 562.67 16.00 32.00 853.33std 86.92 243.13 6555.74 1187.39 29.81 0.00 0.00 0.00 320.61 21.91 52.15 508.5941 shelt mean 120.00 280.00 17733.33 4034.67 0.00 0.00 13.33 0.00 469.33 0.00 106.67 613.33std 119.26 251.22 9869.71 2996.33 0.00 0.00 29.81 0.00 491.29 0.00 80.55 620.75Central Savo 64 exp mean 240.00 733.33 17933.33 3218.67 66.67 0.00 0.00 13.33 826.67 32.00 101.33 1080.00std 111.55 188.56 11793.12 4916.00 47.14 0.00 0.00 29.81 851.93 52.15 143.79 477.03Choiseul Choiseul 17 exp mean 173.33 360.00 6266.67 949.33 106.67 0.00 0.00 0.00 1544.00 120.00 192.00 1826.67std 101.11 273.25 6580.27 1683.39 101.11 0.00 0.00 0.00 1416.27 164.92 114.93 1098.0818 shelt mean 440.00 386.67 47933.33 1632.00 13.33 0.00 0.00 0.00 280.00 32.00 37.33 733.33std 192.06 136.63 44995.31 2090.58 29.81 0.00 0.00 0.00 196.64 71.55 54.49 290.5919 shelt mean 173.33 293.33 12266.67 96.00 0.00 0.00 0.00 0.00 133.33 8.00 8.00 560.00std 89.44 292.88 6121.00 75.07 0.00 0.00 0.00 0.00 47.14 17.89 17.89 197.7720 exp mean 173.33 640.00 6266.67 34.67 26.67 13.33 0.00 0.00 776.00 53.33 16.00 613.33std 129.96 129.96 3226.63 49.53 36.51 29.81 0.00 0.00 353.70 77.17 35.78 232.8621 exp mean 253.33 400.00 8213.33 1229.33 160.00 0.00 0.00 0.00 6453.33 40.00 3320.00 6426.67std 128.24 188.56 5868.45 1045.18 111.55 0.00 0.00 0.00 2447.40 69.28 2685.17 7503.7222 shelt mean 546.67 533.33 6933.33 104.00 0.00 0.00 186.67 0.00 664.00 165.33 16.00 1773.33std 331.33 339.93 10441.37 137.40 0.00 0.00 280.48 0.00 426.40 186.09 35.78 2326.94323
<strong>Solomon</strong> <strong>Islands</strong> <strong>Marine</strong> <strong>Assessment</strong> Technical ReportMean Density(per ha)AngelfishesButterflyfishesDamselfishesFairy bassletsHawkfishesLeatherjacketsParrotfishesPuffersSurgeonfishesSweetlipsTriggerfishesWrassesProvince Island Site ExposureChoiseul (con’t) 23 exp mean 173.33 560.00 6466.67 480.00 120.00 0.00 0.00 0.00 592.00 56.00 0.00 1000.00std 129.96 269.16 4337.18 963.74 73.03 0.00 0.00 0.00 212.62 66.93 0.00 258.2024 shelt mean 40.00 320.00 4600.00 21.33 0.00 0.00 0.00 0.00 53.33 0.00 0.00 1786.67std 59.63 228.04 2994.44 47.70 0.00 0.00 0.00 0.00 55.78 0.00 0.00 378.30Guadalcanal Guadalcanal 42 exp mean 640.00 160.00 7200.00 440.00 93.33 0.00 0.00 0.00 2200.00 0.00 88.00 2386.67std 341.89 138.24 10720.18 451.17 76.01 0.00 0.00 0.00 3325.47 0.00 47.70 1963.2243 shelt mean 226.67 506.67 6800.00 552.00 0.00 0.00 40.00 13.33 13.33 8.00 21.33 466.67std 138.24 498.00 3602.47 1055.97 0.00 0.00 36.51 29.81 29.81 17.89 30.70 194.3765 exp mean 346.67 400.00 1333.33 13.33 0.00 0.00 0.00 0.00 800.00 237.33 24.00 386.67std 159.16 235.70 2260.78 29.81 0.00 0.00 0.00 0.00 253.86 381.39 21.91 73.0366 exp mean 266.67 26.67 133.33 154.67 0.00 0.00 0.00 13.33 93.33 0.00 93.33 4706.67std 216.02 36.51 182.57 200.13 0.00 0.00 0.00 29.81 129.96 0.00 59.63 4791.57Isabel Arnavons 15 exp mean 93.33 266.67 10066.67 74.67 0.00 0.00 13.33 0.00 917.33 301.33 48.00 5106.67std 59.63 182.57 4996.67 83.59 0.00 0.00 29.81 0.00 824.00 294.03 65.73 6492.8316 shelt mean 160.00 426.67 8466.67 50.67 0.00 0.00 13.33 0.00 725.33 240.00 0.00 1066.67std 121.11 256.47 10825.89 51.12 0.00 0.00 29.81 0.00 958.41 173.08 0.00 609.19Isabel Isabel 3 exp mean 106.67 306.67 3533.33 40.00 26.67 26.67 0.00 0.00 341.33 112.00 0.00 840.00std 111.55 252.10 5781.20 56.57 36.51 59.63 0.00 0.00 255.19 148.05 0.00 1024.804 shelt mean 120.00 440.00 5440.00 218.67 0.00 0.00 13.33 40.00 53.33 109.33 0.00 413.33std 86.92 296.65 1872.97 152.78 0.00 0.00 29.81 36.51 119.26 116.77 0.00 207.635 exp mean 26.67 533.33 10733.33 0.00 13.33 0.00 0.00 0.00 946.67 45.33 88.00 600.00std 59.63 286.74 6767.57 0.00 29.81 0.00 0.00 0.00 620.75 47.70 111.00 124.726 shelt mean 160.00 413.33 4000.00 77.33 13.33 0.00 0.00 0.00 256.00 0.00 0.00 1120.00std 111.55 341.24 1929.31 116.77 29.81 0.00 0.00 0.00 238.77 0.00 0.00 1067.087 exp mean 80.00 666.67 23000.00 146.67 13.33 13.33 0.00 0.00 498.67 232.00 32.00 773.33std 73.03 429.47 11105.55 292.12 29.81 29.81 0.00 0.00 264.26 355.35 52.15 153.488 shelt mean 66.67 80.00 19733.33 221.33 0.00 0.00 0.00 0.00 408.00 0.00 154.67 613.33std 66.67 86.92 4009.71 143.17 0.00 0.00 0.00 0.00 110.59 0.00 287.61 548.539 exp mean 146.67 160.00 1200.00 66.67 0.00 0.00 40.00 0.00 330.67 0.00 0.00 733.33std 119.26 146.06 869.23 94.28 0.00 0.00 59.63 0.00 519.18 0.00 0.00 421.6410 shelt mean 80.00 106.67 7333.33 0.00 0.00 0.00 26.67 0.00 77.33 0.00 0.00 560.00std 86.92 138.24 6032.32 0.00 0.00 0.00 36.51 0.00 80.77 0.00 0.00 566.86324
Fisheries Resources: Coral Reef FishesMean Density(per ha)AngelfishesButterflyfishesDamselfishesFairy bassletsHawkfishesLeatherjacketsParrotfishesPuffersSurgeonfishesSweetlipsTriggerfishesWrassesProvince Island Site ExposureIsabel (con’t) 11 exp mean 66.67 186.67 6600.00 13.33 0.00 0.00 13.33 0.00 1338.67 53.33 32.00 653.33std 47.14 144.53 3209.36 29.81 0.00 0.00 29.81 0.00 1177.06 55.78 71.55 317.6312 shelt mean 26.67 93.33 6000.00 0.00 0.00 0.00 0.00 0.00 82.67 0.00 0.00 520.00std 36.51 59.63 1615.89 0.00 0.00 0.00 0.00 0.00 115.24 0.00 0.00 218.0713 exp mean 613.33 80.00 3466.67 53.33 13.33 0.00 0.00 0.00 810.67 0.00 0.00 2786.67std 375.35 119.26 5362.42 55.78 29.81 0.00 0.00 0.00 1628.67 0.00 0.00 1150.2714 shelt mean 226.67 200.00 58266.67 37.33 0.00 0.00 0.00 0.00 1293.33 56.00 13.33 1653.33std 186.19 94.28 69733.38 37.00 0.00 0.00 0.00 0.00 2276.86 61.39 29.81 1177.95Makira Makira 44 exp mean 320.00 253.33 1600.00 13.33 133.33 0.00 13.33 0.00 408.00 0.00 21.33 933.33std 354.02 272.44 1876.76 29.81 66.67 0.00 29.81 0.00 264.76 0.00 30.70 498.8945 shelt mean 146.67 293.33 66.67 16.00 0.00 0.00 26.67 13.33 432.00 0.00 0.00 426.67std 86.92 138.24 149.07 21.91 0.00 0.00 36.51 29.81 833.23 0.00 0.00 213.9646 exp mean 253.33 613.33 4933.33 26.67 133.33 53.33 13.33 0.00 786.67 66.67 53.33 853.33std 119.26 178.89 3662.12 36.51 81.65 73.03 29.81 0.00 228.04 46.19 55.78 292.1247 shelt mean 146.67 80.00 5866.67 42.67 0.00 0.00 0.00 13.33 40.00 0.00 0.00 986.67std 86.92 55.78 6747.84 45.61 0.00 0.00 0.00 29.81 36.51 0.00 0.00 425.31Makira Three Sisters 48 exp mean 160.00 213.33 19533.33 66.67 26.67 0.00 0.00 0.00 346.67 0.00 0.00 2200.00std 101.11 73.03 15539.56 94.28 36.51 0.00 0.00 0.00 144.53 0.00 0.00 1939.0749 shelt mean 400.00 146.67 38800.00 2453.33 0.00 0.00 0.00 0.00 173.33 0.00 106.67 7373.33std 432.05 184.99 23687.31 4605.17 0.00 0.00 0.00 0.00 59.63 0.00 85.89 6867.25Makira Ugi 50 exp mean 320.00 453.33 24133.33 1986.67 146.67 0.00 13.33 0.00 720.00 0.00 109.33 3106.67std 218.07 259.91 12932.73 2678.47 159.16 0.00 29.81 0.00 337.97 0.00 129.07 2265.0051 shelt mean 426.67 200.00 23133.33 474.67 0.00 0.00 13.33 0.00 669.33 0.00 40.00 1813.33std 36.51 205.48 18737.37 639.35 0.00 0.00 29.81 0.00 254.80 0.00 89.44 1426.26Malaita Malaita 52 shelt mean 346.67 226.67 7866.67 8.00 0.00 0.00 13.33 0.00 128.00 0.00 146.67 933.33std 276.49 186.19 4500.62 17.89 0.00 0.00 29.81 0.00 137.15 0.00 109.54 349.6053 exp mean 66.67 306.67 4400.00 26.67 40.00 0.00 0.00 0.00 266.67 0.00 13.33 813.33std 81.65 101.11 2639.44 36.51 59.63 0.00 0.00 0.00 176.38 0.00 29.81 570.3854 shelt mean 93.33 200.00 1333.33 0.00 0.00 0.00 0.00 26.67 42.67 0.00 0.00 666.67std 111.55 81.65 1452.97 0.00 0.00 0.00 0.00 36.51 27.33 0.00 0.00 47.14325
<strong>Solomon</strong> <strong>Islands</strong> <strong>Marine</strong> <strong>Assessment</strong> Technical ReportMean Density(per ha)AngelfishesButterflyfishesDamselfishesFairy bassletsHawkfishesLeatherjacketsParrotfishesPuffersSurgeonfishesSweetlipsTriggerfishesWrassesProvince Island Site ExposureMalaita (con’t) 55 exp mean 160.00 346.67 1466.67 13.33 26.67 0.00 0.00 26.67 1002.67 533.33 0.00 693.33std 36.51 212.92 1464.39 29.81 36.51 0.00 0.00 59.63 388.66 651.63 0.00 314.8256 exp mean 186.67 120.00 3466.67 40.00 13.33 0.00 0.00 0.00 280.00 0.00 13.33 706.67std 178.89 55.78 3060.50 59.63 29.81 0.00 0.00 0.00 259.91 0.00 29.81 396.0957 shelt mean 93.33 173.33 10866.67 34.67 0.00 0.00 0.00 13.33 226.67 0.00 0.00 506.67std 76.01 138.24 15181.49 33.47 0.00 0.00 0.00 29.81 192.06 0.00 0.00 138.2458 exp mean 53.33 440.00 15000.00 88.00 120.00 53.33 0.00 13.33 781.33 112.00 8.00 813.33std 55.78 192.06 5651.94 73.39 128.24 73.03 0.00 29.81 389.26 172.46 17.89 196.6459 shelt mean 280.00 213.33 5666.67 40.00 0.00 0.00 0.00 0.00 480.00 29.33 0.00 920.00std 119.26 55.78 3009.25 59.63 0.00 0.00 0.00 0.00 246.76 40.44 0.00 440.7160 exp mean 160.00 226.67 1266.67 40.00 13.33 0.00 0.00 0.00 360.00 0.00 53.33 1813.33std 101.11 197.77 1011.05 59.63 29.81 0.00 0.00 0.00 213.96 0.00 86.92 624.3261 shelt mean 146.67 106.67 1000.00 0.00 0.00 0.00 0.00 13.33 13.33 26.67 0.00 226.67std 196.64 111.55 1105.54 0.00 0.00 0.00 0.00 29.81 29.81 36.51 0.00 192.06Western New Georgia 29 exp mean 0.00 0.00 0.00 0.00 0.00 0.00 0.00 0.00 280.00 56.00 104.00 0.00std 0.00 0.00 0.00 0.00 0.00 0.00 0.00 0.00 521.54 125.22 115.24 0.0030 exp mean 0.00 0.00 0.00 8.00 0.00 0.00 0.00 0.00 128.00 48.00 8.00 0.00std 0.00 0.00 0.00 17.89 0.00 0.00 0.00 0.00 86.72 65.73 17.89 0.0031 shelt mean 133.33 493.33 9333.33 48.00 0.00 0.00 0.00 13.33 560.00 0.00 32.00 586.67std 47.14 318.33 408.25 52.15 0.00 0.00 0.00 29.81 243.13 0.00 33.47 433.0832 exp mean 66.67 640.00 46800.00 546.67 53.33 0.00 0.00 0.00 834.67 13.33 490.67 813.33std 81.65 173.85 42700.25 963.10 55.78 0.00 0.00 0.00 151.32 29.81 965.60 119.2633 exp mean 40.00 426.67 38733.33 6480.00 13.33 0.00 0.00 0.00 280.00 8.00 56.00 653.33std 59.63 180.12 35284.87 6658.86 29.81 0.00 0.00 0.00 136.63 17.89 125.22 363.3234 exp mean 26.67 746.67 13746.67 554.67 13.33 0.00 13.33 13.33 1173.33 0.00 8.00 466.67std 36.51 369.38 5188.75 1218.03 29.81 0.00 29.81 29.81 1267.96 0.00 17.89 298.1435 shelt mean 93.33 306.67 23866.67 13733.33 0.00 0.00 0.00 13.33 256.00 0.00 0.00 546.67std 101.11 252.10 10704.62 10277.92 0.00 0.00 0.00 29.81 175.47 0.00 0.00 119.2636 exp mean 80.00 506.67 13133.33 6016.00 53.33 0.00 0.00 0.00 506.67 0.00 48.00 666.67std 109.54 401.66 4488.26 5517.49 55.78 0.00 0.00 0.00 148.77 0.00 52.15 235.7037 shelt mean 453.33 533.33 17000.00 48.00 13.33 0.00 0.00 0.00 466.67 0.00 130.67 1720.00std 381.23 124.72 5472.15 55.46 29.81 0.00 0.00 0.00 429.47 0.00 142.49 1618.23326
Fisheries Resources: Coral Reef FishesMean Density(per ha)AngelfishesButterflyfishesDamselfishesFairy bassletsHawkfishesLeatherjacketsParrotfishesPuffersSurgeonfishesSweetlipsTriggerfishesWrassesProvince Island Site ExposureWestern Shortlands 25 exp mean 93.33 466.67 13800.00 373.33 66.67 0.00 0.00 0.00 3365.3345.33 186.67 3960.00std 138.24 278.89 12323.42 453.63 81.65 0.00 0.00 0.00 1697.91 80.88 347.69 7073.5226 shelt mean 280.00 680.00 8640.00 29.33 0.00 0.00 0.00 0.00 320.00 0.00 0.00 746.67std 207.63 387.01 5703.14 28.91 0.00 0.00 0.00 0.00 128.24 0.00 0.00 450.6827 exp mean 0.00 0.00 0.00 0.00 0.00 0.00 0.00 0.00 7328.00 0.00 0.00 0.00std 0.00 0.00 0.00 0.00 0.00 0.00 0.00 0.00 4712.74 0.00 0.00 0.0028 shelt mean 0.00 0.00 0.00 16.00 0.00 0.00 0.00 0.00 8.00 0.00 8.00 0.00std 0.00 0.00 0.00 21.91 0.00 0.00 0.00 0.00 17.89 0.00 17.89 0.00327
June 2006TNC Pacifi c Island CountriesReport No 1/06<strong>Solomon</strong> <strong>Islands</strong>GovernmentChapter 6Fisheries Resources:Commercially ImportantMacroinvertebrates<strong>Solomon</strong> <strong>Islands</strong> <strong>Marine</strong> <strong>Assessment</strong>Peter Ramohia<strong>Solomon</strong> <strong>Islands</strong> Deparment of Fisheries& <strong>Marine</strong> Resources329
Published by: The Nature Conservancy, Indo-Pacific Resource CentreAuthor Contact Details:Peter Ramohia: PO BOX 759, Honiara, <strong>Solomon</strong> <strong>Islands</strong>E-mail address: peter_tnc@solomon.com.sbSuggested Citation:Ramohia, P. 2006. Fisheries Resources: Commercially Important Macroinvertebrates.In: Green, A., P. Lokani, W. Atu, P. Ramohia, P. Thomas and J. Almany (eds). 2006.<strong>Solomon</strong> <strong>Islands</strong> <strong>Marine</strong> <strong>Assessment</strong>: Technical report of survey conducted May 13 toJune 17, 2004. TNC Pacific Island Countries Report No 1/06.© 2006, The Nature ConservancyAll Rights Reserved.Reproduction for any purpose is prohibited without prior permission.Design: Jeanine AlmanyArtwork: Nuovo DesignMaps: Stuart Sheppard & Jeanine AlmanyCover Photo: © David Wachenfeld, Triggerfish ImagesAvailable from:Indo-Pacific Resource CentreThe Nature Conservancy51 Edmondstone StreetSouth Brisbane, QLD 4101AustraliaOr via the worldwide web at: www.conserveonline.org330
Fisheries Resources: Commercially Important MacroinvertebratesContentsExecutive Summary ............................................................................................................................................332Introduction........................................................................................................................................................333Rationale for the Survey ............................................................................................................................ 334Methods................................................................................................................................................................... 334Study Sites.................................................................................................................................................................. 334Survey Procedures.....................................................................................................................................................335Results ...................................................................................................................................................................... 336General........................................................................................................................................................................ 336Sea Cucumbers ......................................................................................................................................................... 336Bivalves........................................................................................................................................................................339Gastropods.................................................................................................................................................................342Other Invertebrates Observed............................................................................................................................. 343Discussion .............................................................................................................................................................. 343Conclusions .......................................................................................................................................................... 347Conservation Recommendations............................................................................................................. 348Acknowledgements ...........................................................................................................................................349References ..............................................................................................................................................................350Tables .........................................................................................................................................................................352Figures .......................................................................................................................................................................357Appendices .............................................................................................................................................................. 387331
<strong>Solomon</strong> <strong>Islands</strong> <strong>Marine</strong> <strong>Assessment</strong> Technical ReportExecutive SummaryA total of 66 sites were surveyed for key invertebrates throughout the main <strong>Solomon</strong> <strong>Islands</strong>group. At each site, transects were sampled within shallow habitat at depths 5-10m and withindeep habitat at depths 18-30m. Sites were also selected so that some were representative ofexposed and others sheltered habitats. Although no statistical analysis was done on the datacollected, species composition, distribution, abundance and size frequency distribution weredetermined for the two different habitats and geographical locations surveyed and meannumbers and standard errors calculated for the species found within each of the two habitatssurveyed at each site.During the survey, 19 species of sea cucumbers, 10 species of bivalves (giant clams andoyster shells), 4 species of gastropods (Trochus and trochus-like species and the triton shell),3 species of lobsters and the coral predator crown of thorns starfish (Acanthaster planci) wererecorded. These species occurred in varying numbers (and sizes) not only in the two habitatssurveyed (shallow and deep) but also at the different geographical (sheltered and exposed)locations of the survey sites.Of the 19 species of sea cucumber recorded, only 17 were encountered in sampled transects.The low valued species Holothuria edulis (pinkfish) and Pearsonothuria graeffei (orangefish)were the most common species encountered during the survey. The high valued speciesHolothuria fuscogilva (white teatfish) was seen often in the deep habitat but not common inthe shallow habitat. While some species like the Thelenota ananas (prickly redfish),Actinopyga lecanora (stonefish), Stichopus chloronotus (greenfish), Holothuria nobilis (blackteatfish) and Stichopus hermanni (curryfish) were seen in low numbers, others like theActinopyga mauritiana (surf redfish), Holothuria scabra (sandfish), Bohadschia similis(chalkfish), Stichopus horrens (peanutfish) and Holothuria coluber (snakefish) were notrecorded at all in the sampled transects and only a few specimens were recorded of the speciesActinopyga miliaris (blackfish), Actinopyga crassa (a species similar to blackfish), Thelenotarubralineata (lemonfish) and Stichopus pseudohorrens, a species very similar to thepeanutfish (Stichopus horrens).The white rock shell Beguina semiorbiculata (locally known as Ke’e) was the most commonspecies of bivalve encountered in sampled transects occurring at 50% of the sites. Pinctadamargaritifera (Blacklip pearl oyster) was recorded at 24 sites in the shallow habitat and 3 inthe deep but the Pteria penguin (brownlip pearl oyster) was present at only 4 sites in theshallow and 8 in the deep. The Pinctada maxima (goldlip pearl oyster) was not seen duringthe survey. The large horse mussel Atrina vexillum (locally known as Kurila) was not seen atmany sites. Tridacna maxima was the most abundant species of giant clams but T. squamosawas the most widely distributed species, occurring at 66.6% of the sampled sites. T. croceawas a common species but the two larger species T. gigas and T. derasa were seen in lownumbers. Hippopus hippopus was encountered the least.The Tectus pyramis (false trochus) was the most commonly encountered gastropod, butTrochus niloticus was encountered at only 13 sites. High mean abundance was recorded for T.niloticus at Toi reef (site 58) in North Malaita and the Arnavon Community <strong>Marine</strong>Conservation Area (ACMCA). Greensnail (Turbo marmoratus) was not seen at all during thesurvey.Panulirus versicolor was the only lobster species observed in sampled transects. The othertwo species P. penicillatus and P. femoristriga were seen caught by fishermen in ChoiseulProvince. P. ornatus was not seen during the survey.Crown of thorns starfish (Acanthaster planci) was encountered at 11 sites, but in relativelylow numbers. No major coral damage relating to this species was observed. The Charonia332
Fisheries Resources: Commercially Important Macroinvertebratestritonis (Triton shell) was rarely seen during the survey. Only one specimen was recorded atNaone Island (site 46) in Makira Province.Introduction<strong>Solomon</strong> <strong>Islands</strong> is located between the latitudes 5 degrees and 12 degrees south andlongitudes 152 degrees and 170 degrees east and consists of a double chain of archipelagicmountainous islands and low lying coral atolls extending over 1,700 km in the southwesttropical Pacific (Figure 1). It has a total land area of approximately 29,000 km 2 , an exclusiveeconomic zone (EEZ) of 1.6 million km 2 and an estimated coastline of 4,023 km (Skewes,1990).According to the national census held in 1999, <strong>Solomon</strong> <strong>Islands</strong> support a population of409,042. A majority of these people live on or near the coast with limited good agriculturalfarm land (or land based income generating alternatives), and therefore have always relied onthe marine environment and the resources therein for their livelihood for generations.The marine environment of <strong>Solomon</strong> <strong>Islands</strong> encompasses the foreshore, inter-tidal sea grassbeds, lagoons, mangroves and estuaries, coral reefs, coastal waters and the deep ocean. Theseare some of the most biologically diverse ecosystems in the world, supporting numerousmarine resources that <strong>Solomon</strong> Islanders depend on for food, income and for culturalpurposes.Fishing has always been one of the main activities sustaining <strong>Solomon</strong> Islanders. Oreihaka(1997) reported that 83% of households engage in some form of fishing activities. A highdependency on marine resources has been reported by Skewes (1990) and Sulu et al., (2000).The former reported a high per capita seafood consumption rate of 34 kg/person/year whereasthe latter estimated the annual domestic coral reef and lagoon species consumption in therange of 10–14,000 tonnes.<strong>Marine</strong> resources have contributed substantially towards the national economy in terms offoreign exchange earning in the past. Before the logging boom of the early 1990s, thefisheries sector was contributing between 35 – 50%. In 1994, fisheries sector contribution wasestimated at SBD$117 million, representing 25% of foreign exchange earning for that year(SIG Fisheries Annual Report, 1994). Excluding tuna resources, coral reef fisheries (includingsea cucumber and Trochus) has earned between SBD$10 and 12 million each year between1997 and 1999 (Sulu et. al., 2000). Ramofafia (2004) reported that the contribution of seacucumbers alone to the national economy fluctuated between SBD$1.9 and 4.8 million since1997 and it was about SBD$2 million in 2003.There is potential for <strong>Solomon</strong> <strong>Islands</strong> to increase revenue from non extractive means such astourism, an industry that rely primarily of the coastal environment. The abundant and thediverse marine life, spectacular lagoons, natural lakes and white sandy beaches havecontinued to attract visitors to our shores. Nature based tourism in <strong>Solomon</strong> <strong>Islands</strong> will growin future and therefore the development of this industry must be guided to ensure it is notdone at the expense of the coastal environment and resources.Not only are inshore marine resources sources of food and income for <strong>Solomon</strong> Islanders,many have important traditional (cultural) values. For example, the white shell Beguinasemiorbiculata locally known as Ke’e and the large horse mussel Atrina vexillum (Kurila) areused for making custom shell-money and other traditional shell artifacts. Certain tribes orgroups of people revere some marine species such as sharks and crocodiles or are restrictedfrom consuming certain species of fish or shellfish because of certain beliefs or ideologies.333
<strong>Solomon</strong> <strong>Islands</strong> <strong>Marine</strong> <strong>Assessment</strong> Technical ReportThe sea and its resources therefore, play an important role in the economy, livelihood andcustoms of <strong>Solomon</strong> Islanders.However, the high dependency on sea resources, coupled with a fast growing population, thedevelopment of a cash economy, destructive fishing methods and weakening traditionalleadership in coastal communities, sea resources face the threat of possible overexploitation.For sustainable production of sea resources, coastal communities need to maintain and keeptheir traditional leadership strong and government support, especially through law andenforcement, is vital.Rationale for the SurveyThe <strong>Solomon</strong> <strong>Islands</strong>’ government, through the Department of Fisheries and <strong>Marine</strong>Resources, is mandated with ensuring that marine resources are exploited on a sustainablebasis so as to derive maximum benefit for <strong>Solomon</strong> Islanders. To achieve this, thegovernment needs to implement effective management strategies for marine resourceutilization. Unfortunately, effective management strategies cannot be implemented in theabsence of scientific data that allows for the assessment of stocks of exploited resources.Previous stock assessment efforts on commercial marine invertebrates in <strong>Solomon</strong> <strong>Islands</strong>included Adam et al., (1991), Lincoln-Smith and Bell, (1996), Lincoln-Smith et al., (2000)and Ramohia, (2004). These are either outdated or limited to small geographical areas orreefs. Other work such as Sulu et al., (2000) and Ramofafia, (2004) are based on export data.There is, therefore, a general lack of information on stock level of marine resources exploitedin <strong>Solomon</strong> <strong>Islands</strong>.In an effort aimed at narrowing this gap, The Nature Conservancy (TNC), the Governmentand other partners conducted a first ever “broad-brush” and multi-discipline marineassessment, surveying commercially important species (invertebrates, fish, sharks), corals,coral reef conditions, coral reef fishes, cetaceans (whales and dolphins) and seagrasses of themain <strong>Solomon</strong> <strong>Islands</strong> archipelago from 12 th May to 17 th June 2004. The primary objectivesof this rapid assessment are:(1) to make available scientific information for conservation planning of the<strong>Solomon</strong> <strong>Islands</strong> and hence assist in the identification of priority sites forconservation,(2) provide information necessary for development of the <strong>Solomon</strong> <strong>Islands</strong>National Biodiversity Strategic Action Plan (NBSAP) – critical for access to funds forconservation through the World Conservation Union (IUCN),(3) to gather and make available scientific information for marine resourcesmanagement and(4) to determine if <strong>Solomon</strong> <strong>Islands</strong> is part of the coral triangle.This report presented the results of the survey on key invertebrate species.MethodsSTUDY SITESThe area covered by this “broad-brush” marine assessment includes the core island group ofthe <strong>Solomon</strong> <strong>Islands</strong>, stretching from Choiseul and Shortland <strong>Islands</strong> in the northwest to theThree Sisters and San Cristobal (Makira) in the southeast (Figure 1). It was not possible tosurvey the more remote islands and atolls (Temotu, Ontong Java, Rennell and Bellona) due to334
Fisheries Resources: Commercially Important Macroinvertebrateslogistic reasons. Nevertheless, as much as possible, the study sites include representatives ofthe different marine habitats. Specifically, the invertebrate survey focused on the coral reefecosystem. Within this marine habitat, stocks and distribution (including size frequencydistribution) of key invertebrate species were surveyed. A list of key invertebrates surveyed isgiven in Appendix 2.Survey sites were selected so that some were representative of “exposed” coral reef habitatsand others “sheltered”. Exposed sites consist of coral reef habitats located on exposed part ofislands which are prone to direct wind and high wave actions with higher oceanic influence.Sheltered sites are coral reef habitats located out of direct wind and high wave action withlower to moderate oceanic influence. These sites were normally located in sheltered lagoonareas and bays.A total of 66 sites were surveyed for key invertebrates throughout the main <strong>Solomon</strong> <strong>Islands</strong>group. Of these, 35 were located in exposed and 31 in sheltered areas.SURVEY PROCEDURESThe procedures used in the assessment of key invertebrate species are adopted from theArnavon Community <strong>Marine</strong> Conservation Area (ACMCA) study as described in detail byLincoln-Smith and Bell (1996). Methods were modified to cater for limitation in the numberof divers available for the survey, taking into account safe diving measures and the quality ofdata collected.At each site, the number and size of key invertebrate species were surveyed using SCUBA intwo different habitats (shallow and deep) and geographical locations (sheltered and exposed).In the shallow habitat, sixty-six (66) surveys were conducted at depths between 5 - 10m.Thirty (30) of these were at sheltered location while the remaining thirty-six (36) were withinexposed locations. Sampling was done using 50m long by 2m wide transects. Six (6) transectswere laid over the terrace or slope at each site within this habitat.In the deep habitat, sixty-three (63) surveys were done at depths between 18 – 30m. Thirty(30) of these were located in sheltered areas whereas thirty-three (33) where at exposed areas.Sampling was done using 50m long by 5m wide transects. Five (5) transects were laidapproximately parallel to the reef crest and over soft substratum or rubble (hard or rockybottoms avoided). No sampling was done at sites where the reef base or the perceived seacucumber habitat was deeper than 30m. The deep survey was not done at three sites becausethey were deeper than 30m. These sites were Veru point (site 33), Lisamata (site 38) andHonoa Island (site 42). The deep habitat included the slope below the terrace to the base ofthe reef. In this habitat, only sea cucumbers were surveyed. However, the larger species ofgiant clams and pearl oysters were also recorded when encountered in transects.Although no statistical analysis was done on the data collected, species composition,distribution and abundance were determined for the two different habitats and geographicallocations surveyed and mean numbers and standard errors calculated for the species foundwithin each of the two habitats surveyed at each site. These mean values were converted tooverall and non-zero averages per hectare by extrapolation. Non-zero averages werecalculated to show the average density of invertebrate species when they do occur at a site.No effort was made to statistically analyse size measurement data in this report due to theinsufficient numbers of many of the key invertebrates surveyed. However, size frequencydistributions were determined for a selected number of the invertebrate species surveyed inboth the shallow and deep habitats.335
<strong>Solomon</strong> <strong>Islands</strong> <strong>Marine</strong> <strong>Assessment</strong> Technical ReportResultsGENERALDetailed information on the exact coordinates for each site surveyed and a list of keyinvertebrates included in the survey along with other descriptive data, are given inAppendices 1 and 2. The invertebrates listed in Appendix 2 are those known to be utilized asfood resources (e.g. giant clams and beche-de-mer) or have other commercial value (e.g.trochus and pearl oysters) or have traditional, cultural and custom values (e.g. B.semiorbiculata and A. vexillum) and indicators of coral reef health (e.g. triton shell andAcanthaster planci). During the survey, 19 species of sea cucumbers, 10 species of bivalves(giant clams and oyster shells), 4 species of gastropods (trochus and the triton shell), 3 speciesof lobsters and the coral predator crown of thorns were recorded (Appendix 2 and also Table1).These species occurred in varying numbers not only in the two habitats surveyed (shallow anddeep) but also at the different geographical (sheltered and exposed) locations of the surveysites. For example, in the shallow habitat, the mean number of species recorded ranged from0.50 (±0.22) species per transect at Buala reef (site 3) and Namunga (site 47) (0.50 (±0.34)) to4.33 (±0.56) and 3.83 (±0.40) at Kerehikapa (site 16) and Tuma Island (site 15) in theArnavon Community <strong>Marine</strong> Conservation Area (ACMCA) respectively (Figure 2). RohaeIsland (site 26) in the Shortland <strong>Islands</strong> and Suafa bay (site 59) on Malaita recorded secondhighest mean numbers of 3.50 (±0.67) and 3.33 (±0.49) species per transect respectively. Allother sites recorded less than 3 key invertebrate species per transect.In the deep habitat, the mean number of species recorded ranged from 0 species per transect atBoeboe (site 19), Haipe reef (site 32) and Arai peninsula (site 54) to 3.0 (±0.71) at Kerehikapa(site 16) in ACMCA (Figure 3). Tuma Island (site 15), also in the ACMCA, recorded thesecond highest with 2.4 (±0.51) species per transect followed by Gavutu Island (site 63) with2.0 (±0.84). Rohae reef (site 25), Putuputuru Island (site 22), Tulagi Switzer Island (site 1),Leili Island I (site 56) and Leili Island II (site 57) all recorded 1.6 (±SE) species per transectwhile the rest of the sites recorded 1.4 (±SE) or less (Figure 3).The rest of this Section provides more detail on the key marine invertebrate species surveyed.SEA CUCUMBERSSpecies compositionOf the 19 species of sea cucumbers or beche-de-mer found during the survey, 17 wererecorded within transects while two (Holothuria scabra and Bohadschia similis), werecollected from seagrass beds by the seagrass Survey Team (Table 1). Furthermore, of those 19species, 11 species were found in both shallow and deep habitats while 4 species (Actinopygalecanora, B. similis, H. scabra and Stichopus chloronotus) were found only in the shallowhabitat and another 4 (Actinopyga crassa, Actinopyga miliaris, Stichopus pseudohorrens andThelenota rubralineata encountered only in the deep habitat (Table 1).Species distribution and abundanceThe distribution of species is grouped according to the habitats surveyed as presented in Table1. Occurrence of species is variable with some occurring at a high number of sites whileothers at low numbers (Table 2).336
Fisheries Resources: Commercially Important MacroinvertebratesIn the shallow habitat, Pearsonothuria graeffei was the most widely distributed species,occurring at 38 (57.6%) of the sites (Table 2). Holothuria edulis was encountered at 33 (50%)of the sites, Bohadschia argus at 12 (18.2%) and A. lecanora 9 (13.6%). Other species,including the Holothuria fuscogilva and Thelenota ananas were present at 4 (6.1%) or less ofthe sites (Table 2). While the species A. crassa, A. miliaris, S. pseudohorrens and T.rubralineata were not encountered in the shallow habitat, Actinopyga mauritiana (surfredfish) was not seen at all at any of the sites surveyed.In the deep habitat, H. fuscogilva was the most widely distributed species, occurring at 27(42.9%) of the sites (Table 2). H. edulis and Thelenota anax were the second most widelydistributed species, both occurring at 21 (33.3%) of the sites. B. argus and Holothuria atraoccurred at 12 (19.1%), Holothuria fuscopunctata and T. ananas at 10 (15.9%), P. graeffei at8 (12.7%) and Stichopus hermanni at 7 (11.1%) of the sites. The remaining species, includingA. miliaris, Bohadschia vitiensis, Holothuria nobilis, S. pseudohorrens, T. rubralineata and A.crassa were present at 4 (6.4%) or less of the sites (Table 2). A. lecanora and S. chloronotuswere not encountered in the deep habitat.Occurrence of species by site is also variable with some sites having more sea cucumbers thanothers in the two habitats surveyed (Figures 4 and 5).In the shallow habitat, the Munda (site 31) recorded the highest mean number of seacucumbers per transect with 4.00 (±0.45) (Figure 4). Toatelava (site 36) and Nuhu Island (site62) recorded the second highest mean numbers with 2.17 (±0.54) and 2.17 (±0.60)respectively. The rest of the sites recorded mean numbers of less than 2 sea cucumbers pertransect (Figure 4).Matavaghi Island (site 9) recorded the highest mean number of sea cucumbers per transectwith 5.00 (±1.84) in the deep habitat (Figure 5). Leili Island I (site 56) and II (site 57)recorded mean numbers of 4.60 (±0.93) and 4.00 (±0.89), Tuma Island (site 15) andKerehikapa (site 16) in the ACMCA 4.20 (±1.28) and 4.00 (±1.0) and Gavutu Island (site 63)4.00 (±2.05). Sites recording mean numbers higher than 2.00 (±SE) sea cucumbers pertransect included Falabulu Island I (site 60), Tirahi Island (site 4), Bonegi reef (site 66),Tambea reef (site 65), Buala reef (site 3) and Marautewa Island (site 45). These sites recordedmean numbers of 3.00 (±0.71), 2.80 (±2.08), 2.60 (±0.75), 2.20 (±1.02), 2.20 (±0.92) and 2.20(±1.46) respectively. The rest of the sites recorded mean numbers of 2.00 (±SE) or less seacucumbers per transect (Figure 5).Abundance is variable for the sea cucumber species surveyed (Table 3a). In the shallowhabitat, H. edulis and P. graeffei made up the bulk of sea cucumbers with 151 (48.7%) and104 (33.6%) animals recorded respectively. Other species recorded included B. argus 16(5.2%), A. lecanora 10 (3.2%), T. ananas 6 (1.9%) and the rest of the species 5 (1.6%) or less(Table 3a).The mean abundance of H. edulis range from 0.17 (±0.17) per transect at 5 sites to 2.33(±0.33) at the Munda (site 31) (Figure 6). Nuhu Island (site 62) and Bonegi (site 66) recordedthe second highest mean numbers with 1.67 (±0.67) respectively. The rest of the sitesrecorded mean numbers of 1.33 (±SE) or less (Figure 6). The mean numbers for P. graeffeiranged from 0.17 (±0.17) per transect at 17 sites to 2.00 (±0.63) at Toatelava Island (site 36)(Figure 7). Munda (site 31) recorded the second highest mean abundance with 1.67 (±0.42)while the rest of the sites 1.17 (±SE) or less. Of the 12 sites that B. argus was encountered,Babao point (site 6) in Isabel recorded the highest with a mean number of 0.67 (±0.33) pertransect (Figure 8). Putuputuru Island (site 22) in Choiseul recorded the next highest meanabundance of 0.33 (±0.21) while the remaining 10 sites all recorded 0.17 (±0.17) per transect.A. lecanora was recorded at 9 sites. Of these, Onua Island (site 27) in the Shortland <strong>Islands</strong>337
<strong>Solomon</strong> <strong>Islands</strong> <strong>Marine</strong> <strong>Assessment</strong> Technical Reportrecorded the highest mean number with 0.33 (±0.21) per transect (Figure 9). The other 8 sitesall recorded 0.17 (±0.17).In the deep habitat, H. edulis was also the most abundant species with 138 (38.4%)individuals counted in transects followed by H. fuscogilva with 59 (16.4%), T. anax 36(10.0%), H. atra 32 (8.9%), B. argus 24 (6.7%), H. fuscopunctata 16 (4.5%), S. hermanni 15(4.2%), T. ananas and P. graeffei 10 (2.8%) and A. miliaris 8 (2.2%). The rest of the speciesrecorded 3 (0.8%) or less (Table 3a).The mean abundance of H. edulis in the deep habitat ranged from 0.20 (±0.20) per transect at7 sites to 4.20 (±1.83) at Matavaghi Island (site 9) (Figure 10). Leili Island I (site 56) and II(site 57) recorded the second highest mean numbers of 4.00 (±0.89) and 3.80 (±0.86)respectively while Gavutu Island (site 63) 2.20 (±1.36). The rest of the sites recorded meannumbers less than this (Figure 10). The mean numbers for H. fuscogilva ranged from 0.20(±0.20) per transect at 12 sites to 1.20 (±0.49) at Putuputuru Island (site 22) and 1.20 (±0.97)at Marautewa Island (site 45) (Figure 11). Tuma Island (site 15), Lumalihe (site 35) andFalabulu Island I (site 60) recorded mean numbers of 0.80 (±0.58), 0.80 (±0.49) and 0.80(±0.37) respectively. The rest of the sites recorded mean numbers less than this (Figure 11).Four other sea cucumber species present at sites in the deep habitat are T. anax, H. atra, B.argus and T. ananas. Raverave Island (site 17) recorded the highest mean number of T. anaxper transect of 1.40 (±0.51) followed by Three Sisters I (site 48) with 1.00 (±0.45) (Figure12). The remaining sites recorded mean numbers less than this. Buala reef (site 3) recordedthe highest mean numbers of H. atra per transect with 1.40 (±0.68) followed by Rohae reef(site 25) in the Shortland <strong>Islands</strong> with 1.20 (±0.37) (Figure 13). Kerehikapa (site 16) andTuma Island (site 15) in ACMCA recorded 1.00 (±0.55) and 0.80 (±0.20) respectively. Of the12 sites that B. argus was observed, Tuma Island (site 15) and Kerehikapa (site 16) recordedthe highest mean numbers of the species with 1.80 (±0.80) and 0.80 (±0.37) per transectrespectively (Figure 14). The remaining sites recorded lower mean numbers than these. T.ananas was found at 10 sites only with each site recording a mean number of 0.20 (±0.20) pertransect (Figure 15).There were more sea cucumbers at sites located in sheltered areas than exposed ones with 373and 296 respectively (Table 3b). The abundance of individual species also varied with somemore abundant than others and this observation is the same for both geographical locations.One hundred and ninety two (192) or 51.5% of total number of sea cucumbers recorded atsites in sheltered locations were H. edulis (Table 3b). P. graeffei was the second mostabundant species with 55 (14.7%). Other species recorded included H. fuscogilva 34 (9.1%),B. argus 20 (5.4%), H. atra and S. hermanni 13 (3.5%), H. fuscopunctata 12 (3.2%), T. anax11 (1.9%), B. similis 6 (1.6%) and A. miliaris 5 (1.3%) (Table 3b). T. ananas, A. lecanora, H.nobilis and A. crassa were recorded with 3 (0.8%) or less. S. chloronotus and T. rubralineatawere not recorded at sites in sheltered locations.At exposed habitats, H. edulis was also the most common species with 97 (32.8%), followedby P. graeffei 59 (19.9%), T. anax 30 (10.0%), H. fuscogilva 29 (9.8%), H. atra 24 (8.1%), B.argus 20 (6.8%) and A. lecanora 7 (2.3%) (Table 3b). The rest of the species recorded 5(0.8%) or less (Table 3b). A. crassa and Bohadscia marmoratus were not recorded at sites inexposed locations.Density data (mean numbers or averages) for each species of sea cucumbers found during thesurvey in shallow (mean numbers per transect or 100m 2 ) and deep (mean numbers pertransect or 250m 2 ) habitats are presented in Appendices 3 and 4. These data have beenconverted to mean numbers or averages per hectare in Table 4.The overall averages for sea cucumbers in both habitats are low (Table 4). In the shallowhabitat, the two most abundant species H. edulis and P. graeffei were found with overall338
Fisheries Resources: Commercially Important Macroinvertebratesaverages of 38 and 26 animals per hectare respectively (Table 4). All other species wererecorded with overall averages of 4 or less animals per hectare. Excluding sites with zerovalues shows that these species tend to have a higher density at the sites where they do occur(Table 4). For example, the average for H. edulis increased to 76 animals per hectare, P.graeffei 46, S. chloronotus 50, H. nobilis 33, T. anax 28, T. ananas 25, B. argus 22, A.lecanora 19, B. marmoratus, H. atra, H. fuscogilva, H. fucsopunctata and S. hermanni 17 perhectare (Table 4).In the deep habitat, the overall averages for the sea cucumber species are also low. The twomost abundant species encountered in this habitat H. edulis and H. fuscogilva were found at17.6 and 7.6 animals per hectare respectively (Table 4). Other species such as T. anax, H. atraand B. argus were recorded with mean densities of 4.4, 4.0 and 3.2 animals per hectare. Therest of the species were found with overall averages of 2.0 or less animals per hectare.Excluding zero values, the mean densities for H. edulis increased to 52.4 animals per hectare,T. rubralineata 24, H. atra 19.6, H. fuscogilva 17.6, S. hermanni 17.2, A. lecanora and A.miliaris 16, T. anax 13.6, H. fuscopunctata 12.8, P. graeffei 10, A. crassa, B. marmoratus, H.nobilis, S. pseudohorrens and T. ananas 8 animals per hectare.Size FrequencyH. edulis and P. graeffei were the most abundant species of sea cucumbers in the shallowhabitat. The size frequency distribution for these two species is shown in Figure 16. Sizefrequency distribution was not determined for the other species because of the low number ofindividuals counted (Table 3a). The average size of H. edulis is 33cm (n=138) compared to35cm (n=96) for P. graeffei (Figure 16). From the graph, it is obvious that most of theindividual sea cucumber measured for the two species are large individuals i.e. belonging tosizes 26cm or above. All the individuals measured for the species P. graeffei are larger than25cm.Figure 17 shows the size frequency distribution for the five common (n=20 or more) seacucumber species recorded in the deep habitat. The average size of H. edulis is 30cm (n=135),H. fuscogilva 41cm (n=59), T. anax 62cm (n=36) H. atra 46cm (n=26) and B. argus 38cm(n=20). From this figure, it is also obvious that most of the individuals measured are largeanimals, belonging to sizes 26cm or above.BIVALVESSpecies compositionTen bivalve species recorded during this survey are given in Table 1 (see also Appendix 2).These included six species of giant clams (five of the genus Tridacna and one Hippopus), twospecies of pearl oysters (Pinctada margaritifera and Pteria penguin) and two other shellspecies that are used for making custom shell-money (Beguina semiorbiculata and Atrinavexillum). The gold lip pearl oyster Pinctada maxima, was not seen during the survey.Seven of the ten species, Tridacna crocea, T. maxima, T. derasa, T. gigas, Hippopushippopus, B. semiorbiculata and A. vexillum were observed only at sites in the shallowhabitat. The giant clam T. squamosa, blacklip pearl oyster Pinctada margaritifera and thebrownlip pearl oyster Pteria penguin were recorded at sites in both the shallow and deephabitats (Table 1).339
<strong>Solomon</strong> <strong>Islands</strong> <strong>Marine</strong> <strong>Assessment</strong> Technical ReportSpecies distribution and abundanceThe distribution of the ten important bivalve species is grouped according to the habitatssurveyed (Table 1). Like sea cucumbers, occurrence of these bivalves is also variable withsome occurring at a high number of sites while others at lower numbers (Table 5).Seven species occurred only in the shallow habitat and three in both the shallow and deephabitats at the sites surveyed (Table 5). T. squamosa was the most widely distributed bivalvespecies, occurring at 44 (66.7%) of the sites in the shallow habitat. This species was alsoobserved at 3 (4.8%) of the sites in the deep habitat (Table 5). T. maxima was the second mostwidely distributed species occurring at 35 or 53.0% of the sites while B. semiorbiculata (shellmoney species) was the third most widely distributed species occurring at 33 or 50.0% of thesites. The other species including the P. margaritifera, T. crocea, A. vexillum, T. gigas, T.derasa, Pteria penguin and H. hippopus were recorded at 24 (36.4%), 16 (24.2%), 10(15.2%), 9 (13.6%), 7 (10.6%), 5 (7.6%) and 2 (3.0%) of the sites respectively (Table 5).B. semiorbiculata, was the most abundant species of bivalve recorded in the shallow habitats.A total of 543 were recorded. This represents 57.9% of the total number of bivalves recordedin that habitat (Table 6). Other abundant species included T. maxima with 115 (12.3%), T.squamosa 95 (10.1%), and T. crocea 60 (6.4%). P. penguin and P. margaritifera recorded 41(4.4%) and 39 (4.2%) respectively. T. derasa recorded 17 (1.8%) while T. gigas and A.vexillum 12 (1.3%). H. hippopus was encountered the least with only 4 (0.4%) individualsrecorded (Table 6). The abundance of B. semiorbiculata varied greatly between sites (Figure18). Mean numbers ranged from 0.17 (0.17) per transect at 4 sites to 20.67 (±6.79) atLumalihe (site 35) in the Marovo lagoon. High mean numbers were also recorded at RohaeIsland (site 26) in the Shortlands with 9.00 (±4.66), Gavutu (site 63) 8.50 (±3.46), TirahiIsland (site 4) 6.17 (±0.87), Wakao (site 12) 6.00 (±2.31) and Vurango (site 24) 5.33 (±1.63)while the rest of the sites recorded 4 or less per transect (Figure 18).Occurrence of giant clams by site is variable with some sites having more clams than others(Figure 19). The mean number of giant clams per transect ranged from 0 at nine sites to 3.33(±0.92) at Kerehikapa (site 16) in the ACMCA. Tuma Island (site 15) and Rohae Island (site26) in the Shortland <strong>Islands</strong> recorded 3.17 (±0.48) and 3.17 (±1.08) respectively. Landoro(site 34) in Marovo Lagoon recorded 2.50 (± 1.15). The rest of the sites recorded less than2.00 (±SE) giant clams per transect (Figure 19).Occurrence of individual clam species by sites is also variable with some sites having morethan others (Figures 20, 21, 22, 23 and 24). T. maxima, the most abundant of the clam species,occurred at 35 sites with mean numbers ranging from 0.17 (±0.17) per transect at 10 sites to1.67 (±0.56) at Landoro (site 34), Marovo Lagoon and 1.67 (±1.12) at Pio Island (site 50)(Figure 20). Kerehikapa (site 16) recorded a mean of 1.33 (± 0.67) per transect.T. squamosa was recorded at 44 sites with mean numbers ranging from 0.17 (±0.17) pertransect at 21 sites to 1.17 (± 0.17) at Tuma Island (site 15) in the ACMCA (Figure 21).Babao Point (site 6) and Rohae Island (site 26) recorded 1.00 (±0.37) and 1.00 (±0.26)respectively while the rest of the sites recorded less than 1.00 per transect. T. crocea was seenat 16 sites with mean numbers ranging from 0.17 (±0.17) per transect at 4 sites to 2.00 (±1.06)at Rohae Island (site 26) (Figure 22).The largest of the giant clam species T. gigas was present at 9 sites, with mean numbersranging from 0.17 (±0.17) per transect at 6 sites and 0.33 (±0.21) per transect at the remaining3 sites (Figure 23). The second largest species T. derasa was observed at only 7 sites withmean numbers ranging from 0.17 (±0.17) per transect at 3 sites to 0.83 (±0.31) at Tuma Island(site 15) in the ACMCA (Figure 24). H. hippopus was recorded at only 2 sites. Wakao Island(site 12) in Isabel recorded 0.33 (±0.21) and Kerehikapa (site 16) 0.33 (±0.33) per transect.340
Fisheries Resources: Commercially Important MacroinvertebratesP. margaritifera was recorded at 24 sites with mean numbers ranging from 0.17 (±0.17) pertransect at 16 sites to 0.67 (± 0.33) at Falabulu Island I (site 60) and 0.67 (±0.33) GavutuIsland (site 63) (Figure 25).The 3 species recorded in the deep habitat comprised 48 individuals. Of these, P. penquin wasthe most abundant of the three species with 40 (83.3%), T. squamosa 4 (8.3%) and P.margaritifera 4 (8.3%) respectively (Table 6).A majority of the bivalves i.e. 705 (71.8%) were recorded at sites in sheltered locationscompared to 277 (28.2%) at exposed locations (Table 7). Of these, B. semiorbiculataaccounted for 478 (67.8%), P. penguin 67 (9.5%) and T. crocea 56 (7.9%). Other species suchas T. derasa, H. hippopus, and A. vexillum were also commonly encountered at sheltered sitesthan exposed locations. On the other hand, T. maxima, B. semiorbiculata and T. squamosamade up the bulk of bivalves recorded at sites in exposed locations with 94 (33.9%), 65(23.5%) and 56 (20.2%) respectively (Table 7). T. gigas and P. margaritifera were also seenmore at sites in exposed locations than sheltered ones.Appendices 5 and 6 present density data for the important bivalve species surveyed during thetrip in the shallow habitat (mean numbers per transect or 100m 2 ) and deep habitat (meannumbers per transect or 250m 2 ). These data have been converted to numbers per hectare inTable 8. Overall averages (mean densities) were inclusive of zero values which occurred forall species but these were excluded from density ranges. B. semiorbiculata, the most abundantbivalve species was recorded during the survey with an overall average of 137 animals perhectare (range: 17 – 2067). Excluding zero values, this increased to 274 animals per hectare(Table 8).Of the six species of giant clams recorded in the shallow habitat, T. maxima, T. squamosa andT. crocea were the most common species recorded at sites surveyed with overall averages of28 animals per hectare (range: 17 – 167), 24 animals per hectare (range: 17 – 117) and 15 perhectare (range: 17 – 200) respectively. Excluding zero values, these averages increased to 52,36 and 64 animals restively respectively. The larger species of giant clams T. gigas and T.derasa as well as the horse shoe clam H. hippopus were recorded with lower overall meandensities of 4 or less animals per hectare (Table 8).P. margaritifera and P. penguin (pearl oysters) were recorded with overall averages of 9animals per hectare (range: 17 – 83) and 11 animals per hectare (range: 33 – 233)respectively. A. vexillum was recorded with a mean density of 3 animals per hectare (range:17 – 33).With the exception of T. squamosa, P. margaritifera and P. penguin, the distribution of theother seven species seemed to be restricted to the shallow habitats only. These three specieswere also recorded in the deep habitat with average densities of 0.4 (range: 8 – 16) for T.squamosa and P. margaritifera and 4 (range: 8 – 184) animals per hectare for P. penguin.Excluding zero value sites, the average densities increased to 10.8 for T. squamosa and P.margaritifera and 32 animals per hectare for P. penguin.Size FrequencyThe size frequency distribution of the five Tridacnid clam species recorded during the surveyin the shallow habitat is given in Figure 26. The average size of the most abundant clamspecies T. maxima is 23cm (n=115), T. squamosa 33cm (n=95), T. crocea 11cm (n=60), T.derasa 51cm (n=17) and T. gigas 70cm. This figure shows that most of the clams measuredare large animals.341
<strong>Solomon</strong> <strong>Islands</strong> <strong>Marine</strong> <strong>Assessment</strong> Technical ReportThe average size of P. margaritifera measured in the shallow habitat is 14cm (n=39) (Figure27). Under a Fisheries Regulation, this is a protected species. From the graph, it is obviousthat most of the individuals measured are large animals, belonging to sizes 12cm or above.GASTROPODSSpecies compositionThe four species of gastropods surveyed during the trip are listed in Table 1 (see alsoAppendix 2). These are Trochus niloticus, Tectus pyramis, Trochus maculatus, and Charoniatritonis. None of these four species were observed in the deep habitat. The species Turbomarmoratus (Greensnail) was not recorded at all during the survey.Species distribution and abundanceThe false trochus Tectus pyramis was the most widely distributed of the four species ofgastropods occurring at 27 (40.9%) of the sites surveyed in the shallow habitat (Table 9). T.niloticus was recorded at only 13 (19.7%) of the sites, T. maculatus at 11 (16.7%) and C.tritonis at only 1 (1.5%) site.T. pyramis was also the most abundant species of the gastropods with 91 (62.3%) of thecombined total of 146 gastropods recorded during the survey (Table 10). The meanabundance of the species ranged from 0.17 (±0.17) per transect at 8 sites to 1.50 (±0.90) atHonoa Island (site 42) in Marau Sound (Figure 28). T. niloticus was the second mostabundant species with 38 (26.0%) recorded and mean numbers ranging from 0.17 (±0.17) pertransect at 4 sites to 1.83 (±0.60) at Toi reef (site 58) in North Malaita (Figure 29). TumaIsland (site 15) and Kerehikapa (site 16) in the ACMCA recorded mean numbers of 0.83(±0.40) and 0.5 (±0.22) respectively while Honoa (site 42) in Marau recorded 0.67 (±0.49). T.maculatus was recorded with 16 (11.0%) and C. tritonis with only 1 (0.7%) specimen (Table10). The single C. tritonis was recorded at Naone Island (site 46) in Makira Province.One hundred and twenty eight or 87.7% of the gastropod species were recorded at sites inexposed locations compared to 18 or 12.3% in sheltered locations (Table 11). T. pyramisconstituted the majority with 86 or 67.2%, followed by T. niloticus with 34 or 26.6%. Incontrast, higher numbers of T. maculatus were recorded at sites in sheltered locations thanthose in exposed locations (Table 11).Appendix 7 presents abundance data for gastropod species found during the survey in theshallow (mean numbers per 100m 2 ) habitat. These data have been converted to mean numbersper hectare in Table 12. Overall average densities were inclusive of zero values whichoccurred for all species but these were excluded from density ranges.Of the four species of gastropods, T. pyramis was the most abundant and widely distributedwith an overall average of 23 animals per hectare (range: 17 – 150). Excluding zero values,the average density increased to 56 animals per hectare. T. niloticus and T. maculatus wererecorded with lower overall average densities of 10 (range: 17 – 183) and 4 (range: 17 – 33)animals per hectare respectively. Excluding zero values, the average densities of these twospecies respectively increased to 49 and 24 animals per hectare (Table 12). The triton shell(C. tritonis) was found with very low densities.342
Fisheries Resources: Commercially Important MacroinvertebratesSize FrequencyThe size frequency distribution for T. niloticus is given in Figure 30. The average size of the38 individuals measured during the survey is 10cm. T. niloticus is one of the importantcommercial species in <strong>Solomon</strong> <strong>Islands</strong> and is currently being managed through a Fisherieslicensing system and size limit Regulation. A majority of the T. niloticus measured during thesurvey are big animals and fall within the legal size limits of 8 – 12cm maximum shelldiameter. Only a small number of animals are either smaller or larger than this legal sizerange (Figure 30). No T. niloticus of size 6cm or less were recorded.OTHER INVERTEBRATES OBSERVEDLobstersSpiny lobsters were recorded at 9 sites in Choiseul, Shortland <strong>Islands</strong>, Isabel, Russell <strong>Islands</strong>and the Three Sisters (Table 13). The painted spiny lobster Panulirus versicolor, was the onlyspecies observed in the survey habitats. A total of 33 individuals were counted from 9 sites.Two other species, the Panulirus penicillatus and P. fomoristriga were only identified from37 individuals caught by fishermen at night at Boeboe and Poro villages in Choiseul.Crown of ThornsThe crown of thorns starfish (Acanthaster planci) was recorded at 11 (16.7%) sites with 17(2.1%) individuals counted. No extensive A. planci related coral reef damage was observed atany of the sites. However, Lisamata reef (site 38) in the Russell <strong>Islands</strong> and Wainipareo (site43) in Marau Sound recorded higher mean densities of 0.67 and 0.50 per transect orequivalent to 67 and 50 per hectare respectively.DiscussionThis survey represents the first time quantitative data is collected on various key species ofinvertebrates from different sites throughout the main <strong>Solomon</strong> <strong>Islands</strong> group. While Holland(1994) reported 22 and Ramofafia (2004) a possible 32 species of sea cucumbers beingharvested in <strong>Solomon</strong> <strong>Islands</strong> respectively, this survey identified only 17 in sampled transects.Some species such as the A. mauritiana, H. scabra, B. similis and H. coluber were notencountered in sampled transects although they were recorded outside our study sites. Of the17 species recorded in sampled transects, 11 occurred in both shallow and deep habitats. Inthe shallow habitat, 13 species were recorded while in the deep 15. Whether the low numberof sea cucumber encountered is related to heavy exploitation or not is not clear, consideringthe fact that no historical harvest data for these species is available for the sites surveyed.Ramofafia (2004) lists 10 species which have high commercial value in <strong>Solomon</strong> <strong>Islands</strong>: H.fuscogilva, S. chloronotus, H. scabra, S. hermanni, S. horrens, T. ananas, A. lecanora, A.miliaris, A. mauritiana and H. nobilis. All except H. scabra, S. horrens and A. mauritianawere encountered in survey transects, possibly because our surveys were conducted outsidetheir specific habitats. Transects sampled in the shallow habitat were laid in depths 5–10m butA. mauritiana is known to be more specific to the surf break areas of the reef which was notsampled. H. scabra is an inner reef-flat species (Preston, 1993) whereas S. horrens is anocturnal species in many of its known ranges in <strong>Solomon</strong> <strong>Islands</strong> like Marovo (personalcommunication with fishermen in Marovo Lagoon). In both habitats, not all sites recordedthese high valued sea cucumber species and their mean numbers in sampled transects werealways low (0 – 5). Overall mean densities found for high valued species indicate that their343
<strong>Solomon</strong> <strong>Islands</strong> <strong>Marine</strong> <strong>Assessment</strong> Technical Reportrelative abundance at the sites surveyed were lower than reported elsewhere in the <strong>Solomon</strong>sand the South Pacific region (Lincoln and Bell, 1996 and Preston, 1993). For example, H.fuscogilva, S. hermanni, T. ananas, A. miliaris and H. nobilis were found with overall meandensities of 7.6, 2.0, 1.2, 1.2 and 0.4 individuals per hectare in the deep habitat whereas in theshallow, A. lecanora, T. ananas, H. fuscogilva, S. chloronotus, and H. nobilis were found withoverall mean densities of 3.0, 2.0, 1.0, 1.0 and 1.0 per hectare. This is very low compared tomean densities of up to 18 individuals per hectare reported by Preston (1993) for H.fuscogilva in Tonga, 4,258 and 456 for S. chloronotus and S. hermanni in Papua New Guinea,up to 18 for T. ananas in New Caledonia, 78,900 for A. miliaris in Fiji and 16.3 for H. nobilisin Great Barrier Reef and 18.7 in Tonga. In the ACMCA region, Lincoln-Smith and Bell(1996) reported higher mean densities for S. chloronotus, H. fuscogilva and S. hermanni with31, 16 and 8.4 individuals per hectare respectively but similar low densities of up to 2individuals per hectare for T. ananas, H. nobilis and A. miliaris. Although the overall meandensities of sea cucumber species are lower, their mean densities when zero value sitesexcluded are higher. For example, in the deep, the mean density of H. fuscogilva became 17.6animals per hectare, T. ananas 8.0, S. hermanni 17.2 and A. miliaris 16.0.In contrast, low valued species like H. edulis and P. graeffei were the most abundant in thetwo habitats surveyed. H. edulis was encountered with overall mean densities of 38 and 17.6per hectare in the shallow and deep habitats respectively. P. graeffei on the other hand, wasabundant in the shallow habitat with overall mean densities of 26 per hectare. When zerovalue sites are excluded, the mean densities per hectare for these low value species are evenhigher.There is lack of information on average size at first maturity for sea cucumbers in <strong>Solomon</strong><strong>Islands</strong>. However, within the Pacific region, Conand (1989) gave the size at first maturity forselected sea cucumber species in New Caledonia. Among the species the author worked withwere H. atra and H. fuscogilva. The author estimated the average size at maturity of these twospecies to be 16.5 and 32cm respectively. Taking his result into consideration, this wouldmean that most of the individuals of these two species recorded during this survey in the deephabitat were mature animals. Although Conand (1989) gave the average size at first maturityfor other species such as H. scabra, H. scabra var versicolor, H. nobilis, H. fuscopunctata, A.echinites, A. mauritiana, S. hermanni, and T. ananas the low sample sizes obtained for thesespecies prevented any meaningful size frequency distribution to be determined for them. Thesize frequency distribution for common species such as H. edulis, P. graeffei, B. argus, and T.anax, indicated that most of the individuals recorded for these species were large animals.The bivalve species sampled during this survey were more abundant in the shallow habitatcompared to the deep. B. semiorbiculata was the most abundant species with 137 per hectare.Excluding zero value sites, the mean density increased to 274 (range: 17 – 2067) per hectare.This species prefers sheltered reef habitats over exposed ones. Lumalihe (site 35) in MarovoLagoon, Rohae Island (site 26) in the Shortlands and Gavutu (site 63) in the Florida grouprecorded high densities of this species. The species was less abundant or absent at many sites(Figure 16) including the Langalanga Lagoon sites Falabulu I (site 60) & Falabulu II (site 61),a well known shell money making region of the <strong>Solomon</strong> <strong>Islands</strong>. It may be worthwhile toundertake a detailed stock assessment study in the lagoon so as to ascertain the current statusand stock levels of the species.All six species of giant clams known from the <strong>Solomon</strong> <strong>Islands</strong> were recorded during thissurvey. Although T. squamosa was the most widely distributed of the six species, T. maximawas the most abundant with estimated overall average density of 28 per hectare. The speciesis more abundant on lagoonal reef edge and windward reef slopes. Excluding zero value sites,the mean density increased to 52 per hectare (range: 17 – 167). Compared to mean densitiesreported in other studies in <strong>Solomon</strong> <strong>Islands</strong> and elsewhere, this is very low. Creese andFriedman (1995) reported very high densities for Indispensable reef of 1,400 per hectare344
Fisheries Resources: Commercially Important Macroinvertebrateswhile Munro (1993) reported densities well over 1,000 individuals per hectare in FrenchPolynesia. Lincoln Smith and Bell (1996) reported a mean density range of 98 -194 animalsper hectare for the ACMCA region. T. squamosa was the second most common giant clamspecies with an overall mean density of 24 per hectare. Excluding zero value sites, the meandensity increased to 36 per hectare (range: 17 – 117). Again, this is well below mean densitiesreported in other studies for the species. Creese and Friedman (1995) reported a mean densityof up to 500 per hectare for the species on the Indispensable Reefs. T. crocea was recordedwith an overall mean density of 15 per hectare and a non-zero density of 64 per hectare(range: 17 – 200). This is also low compared to densities of more than 3,000 reported byMunro (1993) for the species. The densities of the larger giant clam species such as T. gigasand T. derasa were similar to that reported by Munro (1993) and Lincoln-Smith and Bell(1996). The majority of these two larger species were recorded at sites in Northern Isabel,ACMCA, Southern Choiseul and the Shortland <strong>Islands</strong>. H. hippopus, however, was the lesscommonly encountered species of the giant clams. The species was seen at only two sites withdensities much lower than what is reported by Munro (1993) and Lincoln-Smith and Bell(1996). Higher numbers of the species were counted in the ACMCA but outside the studysites.The calculated average sizes of the Tridacnid clams recorded during this survey were wellwithin their known size ranges as reported in Copland and Lucas, (1988). Based on their sizefrequency distribution, most of the clams recorded are mature animals.Giant clams (genus Tridacna and Hippopus) are protected under a Fisheries Regulation whichbanned wild harvest of the species for commercial purposes. However, there was norestriction on subsistence use. Although there is currently no fishery based on any of thesespecies in the country, the fact that there is no restriction on the subsistence use of theresource makes the larger species such as T. gigas and T. derasa vulnerable to overexploitation.The low numbers recorded for the two species during this survey is a concernbut whether this is due to over-exploitation or not is not clear as there was no historical catchdata for these species at the sites surveyed.P. margaritifera was more widely distributed than T. niloticus. This species was encounteredat 24 sites in the shallow habitat and 3 in the deep. Mbili passage (site 37) in Marovo Lagoonrecorded the highest density of 0.83 per transect or equivalent to 83 per hectare. Gavutu (site63) in Ngella and Falabulu I (site 60) in Langalanga Lagoon recorded mean densities of 67per hectare. In the shallow habitat, the highest density of P. penquin was recorded at Airasi(site 52) in Are’Are Lagoon with mean density of 2.33 per transect or equivalent to 233 perhectare. In the deep habitat, the species was recorded at eight sites. Airasi (site 52) in Are’AreLagoon also recorded the highest density in this habitat with 4.60 per transect or equivalent to460 per hectare (Appendix 5 & 6). P. maxima was not recorded during this survey but thiswas because this species is more specific to deeper habitats where there is very strong currentflow.Most of the P. margaritifera measured during the survey are large animals and according toSims (1993), larger shells should maintain an even sex ratio in the wild. Whilst objectivesurveys like this <strong>Marine</strong> <strong>Assessment</strong> Survey provide baseline measures of abundance, Sims(1993) suggested that permanent survey sites are needed for monitoring stock changes.T. niloticus was encountered in low numbers and at less number of sites during the survey. Incontrast, T. pyramis was encountered at twice as many number of sites and numbers. Sincethese two species are known to occupy the same habitat and space on the reef, this wouldimply a significant reduction in the stocks of T. niloticus. Specifically, T. niloticus prefer theexposed habitats compared to the sheltered reefs. The species was found with an overall meandensity of 10 per hectare but for the sites which the species was present, the mean density was49 per hectare (range: 17 – 183). The highest density for the species was recorded at the345
<strong>Solomon</strong> <strong>Islands</strong> <strong>Marine</strong> <strong>Assessment</strong> Technical Reportexposed Toi reef (site 58) in North Malaita with mean densities up to 1.83 per transect. This isequivalent to 183 per hectare. Tuma (site 15) and Kerehikapa (site 16) in the ACMCArecorded mean densities of 0.83 and 0.50 per transect or equivalent to 83 and 50 per hectarerespectively. Leary (1993) found low numbers of 28 per hectare for the ACMCA whilstLincoln-Smith and Bell (1996) up to 38 per hectare. Although higher densities are foundduring this study compared to Leary (1993) and Lincoln-Smith and Bell (1996), meandensities found in other parts of the South Pacific region are much higher. In Vanuatu, Aylinget,al., (1990) found densities of up to 750 per hectare and Nash et. al., (1995) reporteddensities well over 2,500 individuals per hectare in the Cook <strong>Islands</strong>. Leary (1993) alsoreported that densities of 100 per hectare are considered normal for a well-fished healthypopulation (Leary, 1993).Although the number of T. niloticus found during the survey is low, size measurementsindicated that a majority of the T. niloticus recorded during the survey are large matureanimals. Nash (1993) reported that the onset of sexual maturity in T. niloticus occurs between5 and 9cm maximum shell diameter. With an average shell size of 10cm, it can be assumedthat most of the T. niloticus recorded during the survey are sexually mature. In addition tothis, most of the T. niloticus are also within the legal harvesting size limits of 8 – 12cmmaximum shell diameter.The fact that no T. niloticus less than 6cm were found also confirm that all the T. niloticusrecorded are mature adults. Juvenile T. niloticus are however, difficult to find due to theircryptic nature (Heslinga et al., 1984 and Nash, 1985) and larval settlement predominantly onthe reef flat in the intertidal zone. This survey was carried out mainly on the reef slopes atdepths 5 to 10m which are known adult habitats.T. marmoratus was absent from this study. It is most likely that this species which has limitedlarval dispersal abilities (Creese and Friedman, 1994) has been depleted throughout the mainisland group. A total protection of this species is needed and a possible reseeding programshould be initiated to rebuild its population.Lobsters were present but in low abundances. These species were seen more often fromfishermen’s catch than observed in transects sampled. Similarly, the crown of thorns starfishwas not abundant in sampled transects and overall, coral damage due to the species wasminimal. However, the Lisamata reef (site 38) in Russell <strong>Islands</strong> and Wainipareo (site 43) inMarau Sound should be monitored closely. These two sites recorded mean densities 50 andhigher per hectare for the species.An important result from this study was the contrast between the ACMCA and the rest of thesites. The mean abundance of many of the invertebrates sampled during this survey washigher in the ACMCA. For example, the ACMCA recorded all the species of giant clamsincluding the largest of the species T. gigas. This species was not seen at most of the sitessampled (Figure 21). T. derasa was found mainly in the ACMCA and the nearby surroundingNorthern Isabel and Southern Choiseul reefs. One specimen was recorded in Marau sound atthe Honoa Island (site 42). Compared to many of the sites sampled, the two sites in theACMCA recorded high mean densities of the giant clam species. The sites in the ACMCAalso recorded the highest number of sea cucumber and T. niloticus during the survey.The result of this study high-lighted a number of points, one of which is that a <strong>Marine</strong>Protected Area (MPA) is not simply a demarcated no-fishing zones but they are areas thathelp to enhance and maintain higher numbers of marine species. Spill over from the protectedarea could help to replenish over-fished reefs. Another finding was that, Toi reef (site 58) inNorth Malaita, sites in Leili Island, Shortland <strong>Islands</strong> and Marovo Lagoon recordedreasonably higher densities of some of the species compared to other sites. Preston (1993)reported high density patches among a generally low background abundance for 18 species in346
Fisheries Resources: Commercially Important MacroinvertebratesVanuatu. However, no high density patches were found for sea cucumber species during thisstudy. Whether this is natural to the sites surveyed or due to past fishing activities cannot bedetermined without further long-term monitoring.<strong>Marine</strong> resources, especially marine invertebrates, are very important to <strong>Solomon</strong> <strong>Islands</strong>.These multi-species fisheries deliver incomes directly to the village fisher and even the moreremote coastal communities. However, the low densities found for these importantinvertebrate species could be telling us that these resources are under increasing pressure ascoastal communities rely more heavily on them for income, food and other benefits. In<strong>Solomon</strong> <strong>Islands</strong>, there is limited understanding and knowledge (biological and ecological) onmany of these key invertebrate species and fishing operations in rural communities aredifficult to monitor. Available export data reveal little information on points of speciescapture or shifts in catches from high to low value species. As a result of this, FisheriesManagers do not have evidence to support management measures such as setting quotas, totalallowable catches or other conservative fishing measures. MPAs offer an alternativemanagement option. The ACMCA has been successful in maintaining stocks of theseinvertebrates. A seven year ban on the sea cucumber fishery has helped increased the numbersof sea cucumbers on reef-flats in Tonga (personal experience). If a ban is not possible,community MPAs could be established in many parts of the country to enhance the dwindlingstocks of these important invertebrates.ConclusionsThe key invertebrates surveyed are not abundant at the sites sampled. Most of the high valuedspecies such as sea cucumbers, giant clams, Trochus niloticus and pearl oysters are low inabundance at the sites surveyed in both the shallow and deep habitats. However, most of theanimals recorded are large and mature.Although the smaller of giant clam species were seen in larger numbers, the large species likeT. gigas and T. derasa were present in low abundance. T. derasa was however, the moreabundant of the two species and localized at sites in Northern Isabel, ACMCA and Waghenaarea in Choiseul.P. margaritifera was more widely distributed than T. niloticus and this is probably a result ofa government ban on the export of the species for the past 13 or so years. The apparentabsence of T. marmoratus in areas where there is plenty of suitable habitats is a majorconcern. It is hoped that past high fishing pressure has not been the main factor. Althoughthere is no ban on this species, there is currently no fishery on this species. It is high time thata formal ban is imposed on future harvesting of the species.T. niloticus abundance is very low except for some sites like Toi reef (site 58), the ACMCA(sites 15 & 16), Honoa (site 42) in Marau and Onua Island (site 27) in the Shortlands. Thewide spread low abundance of this species is also a major concern. Management interventionis required for the management of this species is <strong>Solomon</strong> <strong>Islands</strong>. MPAs like the ACMCAhas proved very effective in enhancing and maintaining stocks of T. niloticus, sea cucumbersand other commercial invertebrate species. It will be better to establish more communityMPAs for the management and conservation of commercial invertebrate to enable sustainableproduction of these resources in the country.347
<strong>Solomon</strong> <strong>Islands</strong> <strong>Marine</strong> <strong>Assessment</strong> Technical ReportConservation RecommendationsThe following recommendations are made in light of the importance of the results of thissurvey.1) <strong>Marine</strong> Conservation Areas like the ACMCA help to maintain and enhance stocks ofcommercially important marine invertebrates. Similar experience like this can also beseen from other parts of the Pacific. It will be in the best interest of the country and themulti-species invertebrate fisheries that our rural communities rely on to establish morecommunity managed “Pocketed MPAs” in <strong>Solomon</strong> <strong>Islands</strong> for the protection andmanagement of these fisheries. Such MPAs are small in size but they are strategicallylocated and habitat specific for these invertebrate resources. A number of these smallMPAs have already been established by communities in Marau Sound, Ngella, MarovoLagoon, Tetepare, Roviana Lagoon and Gizo. Similar networks should be set up in theShortland <strong>Islands</strong>, Russell <strong>Islands</strong>, Three Sisters <strong>Islands</strong>, Leili Island, Lau Lagoon, SuafaBay, Langalanga Lagoon, Are’Are Lagoon and small Malaita, Northern Isabel andNorthern Choiseul. Although such community MPAs would be managed by thecommunities themselves, government and partner (e.g. NGO’s) support would beessential. The government through relevant department(s) should take appropriate steps tolegalize these small MPAs as provided for under provisions of the Fisheries Act 1998.Any reviews planned for this Act in future should ensure that this provision is firmly andclearly addressed or provided for.2) The nature of multi-species invertebrate fisheries made it difficult to monitor them.Harvest data is not specific to species and location and not readily available. Datacollection by important Departments like the Fisheries and <strong>Marine</strong> Resources is alwaysgeared towards earning or increasing revenue. It is now time data collection is also aimedat the conservation of resources. It is highly recommended that the Department ofFisheries and <strong>Marine</strong> Resources consider utilizing existing structures like FisheriesCentres and Extension arrangement already in place to improve data collection andawareness work in the rural areas.3) The Fisheries Regulation banning the use of SCUBA and Hookar gear for harvesting ofvaluable invertebrate resources like sea cucumber should be vigorously enforced.Awareness programs on all Fisheries Regulations should be targeted at ruralcommunities, schools and the public at large. Funding should be sought for radioawareness programs. A meeting should be held with each Provincial Police Commandersto discuss with them aspects relating to the enforcement of Fisheries Regulations.4) The Department of Fisheries and <strong>Marine</strong> Resources should start looking at alternativemanagement options for the Sea cucumber and Trochus fisheries in <strong>Solomon</strong> <strong>Islands</strong>. Anumber of options are suggested:(1) Limiting the numbers of export permits(2) Set annual export quotas for these resources(3) Set size limits for sea cucumbers species (wet and dry size limits)5) The Department of Fisheries and <strong>Marine</strong> Resources should impose a total protection ofthe species greensnail (Turbo marmoratus) through a Fisheries Regulation. A reseedingprogram should be initiated to rebuild its population.348
Fisheries Resources: Commercially Important MacroinvertebratesAcknowledgementsI thank Alec Hughes, Tingo Leve, Michael Ginigele and Dr. Alison Green for assisting meduring the survey. Without their help, it would not be possible to collect data for this study. Ithank also Captain Russell Slater and crew on the FeBrina. Dr. Christain Ramofafia andFerral Lasi reviewed and made constructive comments on an earlier draft of this report. Thisstudy was financially supported by The Nature Conservancy.349
<strong>Solomon</strong> <strong>Islands</strong> <strong>Marine</strong> <strong>Assessment</strong> Technical ReportReferencesAdams, T.J.H., Leqata, J., Ramohia, P., Amos, M. and Lokani, P. (1992). Pilotsurvey of the status of trochus and beche-de-mer resources in the WesternProvince of the <strong>Solomon</strong> <strong>Islands</strong> with options for management. InshoreFisheries Research Project (IFRP) South Pacific Commission (SPC). IFRPUnpublished country report. 34pp.Ayling, A. M., Andrews, G. J., Navin, K.F. and Benzie, J.A.H. (1990). Quantitativesurveys around Malekula Island, pp 119-135 in: Done, T.J. and K.F Navin(Eds.), Vanuatu <strong>Marine</strong> Resources. Australian Institute of <strong>Marine</strong> Science,Townswille.Babcock, R.C. (1994). <strong>Marine</strong> Resources of Rennell Island and Indispensable Reef.University of Auckland Leigh <strong>Marine</strong> Laboratory, New Zealand.Conand, C. (1989). Les Holothuries Aspidochirote du Lagon de Nouvelle-Caledonie:Biology, Ecologie et Exploitation. Ph.D thesis, University of WesternBrittany, Brest, France. 393pp.Creese, B and Friedman, K. (1994). Shellfish and Other Reef Resources, Pp 125-158in R. C. Babcock (ed.) <strong>Marine</strong> Resources of Rennell Island and IndispensableReef. University of Auckland Leigh <strong>Marine</strong> Laboratory, New Zealand.Heslinga, G. A., Perron, F. E. and Orak, O. (1984). Mass culture of giant clams (F.Tridacnidae) in Palau. Aquaculture 39, 197-215.Holland, A. (1994). The beche-de-mer industry in the <strong>Solomon</strong> <strong>Islands</strong>: recent trendsand suggestions for management. SPC Beche-de-Mer Information Bulletin 6:2-8.Leary, T. (1993). Arnavon <strong>Islands</strong> <strong>Marine</strong> Conservation Area Project, <strong>Solomon</strong><strong>Islands</strong>. SPREP/5 th South Pacific Conf. Nat. Cons. And Prot. Areas/CSI.4, pp1-9.Lincoln Smith, M. P. and Bell, J. D. (1996). Testing the use of marine protected areasto restore and manage tropical multispecies invertebrate fisheries at theArnavon <strong>Islands</strong>, <strong>Solomon</strong> <strong>Islands</strong>: Abundance and size distributions ofinvertebrates, and the nature of habitats, prior to declaration of the <strong>Marine</strong>Conservation Area. Prepared for the Great Barrier Reef <strong>Marine</strong> ParkAuthority, Canberra and the Australian Centre for International AgriculturalResearch, Sydney.Lincoln Smith, M. P., Bell, J. D., Ramohia, P. and Pitt, K. A. (2000). Testing the useof marine protected areas to restore and manage tropical multispeciesinvertebrate fisheries at the Arnavon <strong>Islands</strong>, <strong>Solomon</strong> <strong>Islands</strong>:TERMINATION REPORT. Prepared for the Great Barrier Reef <strong>Marine</strong> ParkAuthority, Canberra and the Australian Centre for International AgriculturalResearch, Sydney.Lucas, J. S. (1988). Giant Clams: Description, Destribution and Life History, Pp 21 –32 in, Copland, J. W. and Lucas, J. S. (eds), Giant Clams in Asia and thePacific. Australian Centre for International Agricultural Research, Canberra,Australia.Munro, J. L. (1993). Giant clams, Pp 431-450 in, A. Wright and L. Hill (eds),Nearshore <strong>Marine</strong> Resources of the South Pacific. Institute of Pacific Studies,Suva, Forum Fisheries Agency, Honiara and International Centre for OceanDevelopment, Canada.Nash, W. J. (1985). Aspects of the biology of Trochus niloticus (Gastropoda:Trochidae) and its fishery in the Great Barrier Reef region. Report to the350
Fisheries Resources: Commercially Important MacroinvertebratesQueensland Department of Primary Industries and the Great Barrier Reef<strong>Marine</strong> Park Authority. 210ppNash, W.J. (1993). Trochus, Pp 371-408 in, A. Wright and L. Hill (eds), Nearshore<strong>Marine</strong> Resources of the South Pacific. Institute of Pacific Studies, Suva,Forum Fisheries Agency, Honiara and International Centre for OceanDevelopment, Canada.Oreihaka, E. (1997). Freshwater and <strong>Marine</strong> Aquatic resources in <strong>Solomon</strong> <strong>Islands</strong>.Unpublished report for Fisheries Division, Department of Agriculture andFisheries, Honiara, <strong>Solomon</strong> <strong>Islands</strong>, 60pp.Preston, G. L. (1993). Beche-de-mer, Pp 371-408 in, A. Wright and L. Hill (eds),Nearshore <strong>Marine</strong> Resources of the South Pacific. Institute of Pacific Studies,Suva, Forum Fisheries Agency, Honiara and International Centre for OceanDevelopment, Canada.Preston, G.L. and Lokani, P. (1990). Report of a Survey of the Sea CucumberResources of Ha’apai, Tonga. Inshore Fisheries Research Project (IFRP) SouthPacific Commission (SPC). IFRP Unpublished country report. 17pp.Ramofafia, C. (2004). The Sea Cucumber Fisheries in <strong>Solomon</strong> <strong>Islands</strong>: Benefits andImportance to Coastal Communities. WorldFish Centre, Nusa Tupe FieldStation, 10pp.Ramohia, P. (2004). Baseline Survey: Assessing Abundance of CommerciallyImportant Invertebrates of the Marapa and Simeruka <strong>Marine</strong> Protected Areas,Marau Sound, Guadalcanal. Department of Fisheries and <strong>Marine</strong> Resources,Honiara. Unpublished report. 24pp.SIG, (1994). Fisheries Division Annual Report. Department of Agriculture andFisheries, Honiara, <strong>Solomon</strong> <strong>Islands</strong>. Unpublished.Sims, N. A. (1993). Pearl Oysters, Pp 409 - 430 in, A. Wright and L. Hill (eds),Nearshore <strong>Marine</strong> Resources of the South Pacific. Institute of Pacific Studies,Suva, Forum Fisheries Agency, Honiara and International Centre for OceanDevelopment, Canada.Skewes, T. (1990). <strong>Marine</strong> Resource profiles, <strong>Solomon</strong> <strong>Islands</strong>. South Pacific ForumFisheries Agency, Honiara, 52 pp.Sulu, R., Hay, C., Ramohia, P. and Lam, M. (2000). The status of <strong>Solomon</strong><strong>Islands</strong>’coral reefs. A report prepared for the Global Coral Reef MonitoringNetwork. 59 pp.Wright, A and Hill, L. E. (1993). Nearshore <strong>Marine</strong> Resources of the South Pacific.Institute of Pacific Studies, Suva, 710 pp.351
<strong>Solomon</strong> <strong>Islands</strong> <strong>Marine</strong> <strong>Assessment</strong> Technical ReportTablesTable 1. Invertebrate species composition and distribution for the two habitats surveyed.Shallow Habitat Deep Habitat Shallow and Deep habitatsSea CucumbersActinopyga lecanora (stonefish) A. crassa (spp. Similar to blackfish) B. argus (tigerfish)Bohadschia similes* (chalkfish) A. miliaris (blackfish) B. vitiensis (brown sandfish)Holothuria scabra* (sandfish) S. pseudohorrens (spp. Similar to H. edulis (pinkfish)peanutfish)Stichopus chloronotus (greenfish) T. rubralineatus (lemonfish) H. fuscogilva (white teatfish)H. fuscopunctata (elephant trunkfish)- - H. nobilis (black teatfish)- - H. atra (lollyfish)- - Pearsonothuria graeffei (orangefish)- - S. hermanni (curryfish)- - Thelenota ananas (prickly redfish)T. anax (Amberfish)BivalvesTridacna crocea - Tridacna squamosaTridacna maxima - Pinctada margaritiferaTridacna derasa - Pteria penguinTridacna gigas - -Hippopus hippopus - -Beguina semiorbiculata (Ke’e) - -Atrina vexillum (Kurila) - -GastropodsTrochus niloticus - -Tectus pyramis (False trochus) - -Trochus maculates - -Charonia tritonis (triton shell) - -*Found in sea grass beds by Seagrass Team.Table 2: Occurrence (%) of sea cucumber species found in the different habitatsShallow HabitatDeep HabitatSpeciesNo. sites species PercentNo. sites species Percent occurrence (%)present* occurrence (%) present*Actinopyga crassa - 1 1.6A. lecanora 9 13.6 - -A. miliaris - 4 6.4Bohadschia argus 12 18.2 12 19.1B. vitiensis 3 4.5 3 4.8Holothuria atra 4 6.1 12 19.1H. edulis 33 50.0 21 33.3H. fuscogilva 3 4.6 27 42.9H. fuscopunctata 1 1.5 10 15.9H. nobilis 1 1.5 2 3.2Pearsonothuria graeffei 38 57.6 8 12.7Stichopus chloronotus 1 1.5 - -S. hermanni 1 1.5 7 11.1S. pseudohorrens - - 2 3.2Thelenota ananas 4 6.1 10 15.9T. anax 3 4.5 21 33.3T. rubralineata - - 1 1.6*Total sites surveyed were 66 (shallow habitats) and 63 (deep habitats).352
Fisheries Resources: Commercially Important MacroinvertebratesTable 3a. Abundance (%) of sea cucumber species recorded in the different habitats. n are total numbers ofindividuals found.HabitatSpecies Shallow (n) % of Total Deep (n) % of TotalActinopyga crassa - - 1 0.3A. lecanora 10 3.2 - -A. miliaris - - 8 2.2Bohadschia argus 16 5.2 24 6.7B. vitiensis 3 1.0 3 0.8Holothuria atra 5 1.6 32 8.9H. edulis 151 48.7 138 38.4H. fuscogilva 3 1.0 59 16.4H. fuscopunctata 1 0.3 16 4.5H. nobilis 2 0.6 2 0.6Pearsonothuria graeffei 104 33.6 10 2.8Stichopus chloronotus 3 1.0 - -S. hermanni 1 0.3 15 4.2S. pseudohorrens - - 2 0.6Thelenota ananas 6 1.9 10 2.8T. anax 5 1.6 36 10.0T. rubralineata - - 3 0.8Total 310 359Table 3b. Abundance (%) of sea cucumber species recorded at different geographical locations. n are totalnumbers of individuals found.Geographical LocationSpecies Sheltered (n) % of Total Exposed (n) % of TotalActinopyga crassa 1 0.3 - -A. lecanora 3 0.8 7 2.3A. miliaris 5 1.3 3 1.0Bohadschia argus 20 5.4 20 6.8B. vitiensis 6 1.6 - -Holothuria atra 13 3.5 24 8.1H. edulis 192 51.5 97 32.8H. fuscogilva 34 9.1 29 9.8H. fuscopunctata 12 3.2 5 1.7H. nobilis 3 0.8 1 0.3Pearsonothuria graeffei 55 14.7 59 19.9Stichopus chloronotus - - 3 1.0S. Hermanni 13 3.5 3 1.0S. pseudohorrens 1 0.3 1 0.3Thelenota ananas 4 1.1 12 4.0T. anax 11 2.9 30 10.0T. rubralineata - - 3 1.0Total 373 296Table 4: Mean densities (rounded to whole numbers per hectare) for holothurian species found at theshallow and deep habitats during the survey.SpeciesRange(excludezero values)Shallow (No./ha)OverallaverageAverage(excludezero values)HabitatRange(excludezero values)Deep (No./ha)OverallaverageAverage(excludezero values)Actinopyga crassa - - - 8 0.1 8.0A. lecanora 17 - 33 3.0 19.0 - - -A. miliaris - - - 8 – 32 1.2 16.0Bohadschia argus 17 - 67 4.0 22.0 8 – 72 3.2 16.0B. vitiensis 17 1.0 17.0 8 0.4 8.0Holothuria atra 17 - 33 1.0 17.0 8 – 56 4.0 19.6H. edulis 17 - 233 38.0 76.0 8 – 168 17.6 52.4H. fuscogilva 17 1.0 17.0 8 – 48 7.6 17.6H. fuscopunctata 17 0.003 17.0 8 – 24 2.0 12.8353
<strong>Solomon</strong> <strong>Islands</strong> <strong>Marine</strong> <strong>Assessment</strong> Technical ReportSpeciesRange(excludezero values)Shallow (No./ha)OverallaverageAverage(excludezero values)HabitatRange(excludezero values)Deep (No./ha)OverallaverageAverage(excludezero values)H. nobilis 33 1.0 33.0 8 0.4 8.0Pearsonothuria graeffei 17 - 200 26.0 46.0 8 – 16 1.2 10.0Stichopus chloronotus 50 1.0 50.0 - - -S. hermanni 17 0.003 17.0 8 - 40 2.0 17.2S. pseudohorrens - - - 8 0.4 8.0Thelenota ananas 17 – 50 2.0 25.0 8 1.2 8.0T. anax 17 – 33 1.0 28.0 8 – 56 4.4 13.6T. rubralineata - - - 24 0.4 24.0Table 5: Occurrence (%) of bivalve species found in the different habitatsShallow HabitatDeep HabitatSpeciesNo. sites speciespresent*Percent occurrence(%)No. sites speciespresent*Percent occurrence(%)Tridacna crocea 16 24.2 - -Tridacna maxima 35 53.0 - -Tridacna squamosa 44 66.7 3 4.8Tridacna derasa 7 10.6 - -Tridacna gigas 9 13.6 - -Hippopus hippopus 2 3.0 - -Pinctada margaritifera 24 36.4 3 4.8Pteria penguin 4 6.1 8 12.7Beguina semiorbiculata 33 50.0 - -Atrina vexillum 10 15.2 - -*Total sites surveyed were 66 in the shallow and 63 n the deep habitatsTable 6: Abundance (%) of bivalve species recorded in the different habitats. n are total numbers ofindividuals found.HabitatSpecies Shallow (n) % of Total Deep (n) % of TotalTridacna crocea 60 6.5 - -Tridacna maxima 115 12.3 - -Tridacna squamosa 95 10.3 4 8.3Tridacna derasa 17 1.8 - -Tridacna gigas 12 1.3 - -Hippopus hippopus 4 0.4 - -Pinctada margaritifera 39 4.2 4 8.3Pteria penguin 41 4.4 40 83.3Beguina semiorbiculata 543 57.9 - -Atrina vexillum 12 1.3 - -Total 938 48Table 7: Abundance (%) of bivalve species recorded at different geographical locations. n are total numbersof individuals found.Geographical LocationSpecies Sheltered (n) % of Total Exposed (n) % of TotalTridacna crocea 55 7.8 5 1.8Tridacna maxima 21 3.0 94 33.9Tridacna squamosa 39 5.5 56 20.2Tridacna derasa 10 1.4 7 2.5Tridacna gigas 1 0.1 11 4.0Hippopus hippopus 4 0.6 - -Pinctada margaritifera 19 2.7 22 8.0Pteria penguin 67 9.5 13 4.7Beguina semiorbiculata 478 67.8 65 23.5Atrina vexillum 9 1.3 3 1.1Total 705 277354
Fisheries Resources: Commercially Important MacroinvertebratesTable 8: Mean densities (numbers per hectare) for bivalve species found at the shallow and deep habitatsduring the survey.SpeciesRange(excludezero values)Shallow (No./ha)OverallaverageAverage(excludezero values)HabitatRange(excludezero values)Deep (No./ha)OverallaverageAverage(excludezero values)Tridacna crocea 17 – 200 15 64 - - -Tridacna maxima 17 – 167 28 52 - - -Tridacna squamosa 17 – 117 24 36 8 – 16 0.4 10.8Tridacna derasa 17 – 83 4 40 - - -Tridacna gigas 17 – 33 3 22 - - -Hippopus hippopus 33 1 33 - - -Pinctada margaritifera 17 – 83 9 27 8 – 16 0.4 10.8Pteria penguin 33 – 233 11 143 8 – 184 4 32Beguina semiorbiculata 17 – 2067 137 274 - - -Atrina vexillum 17 – 33 3 20 - - -Table 9: Occurrence (%) of target gastropod species found in the shallow habitatsShallow HabitatSpecies No. sites species present* Percent occurrence (%)Trochus niloticus 13 19.7Tectus pyramis 27 40.9Trochus maculates 11 16.7Charonia tritonis 1 1.5*Total sites surveyed were 66 (shallow habitats)Table 10: Abundance (%) of target gastropod species recorded in the shallow habitat. n are total numbers ofindividuals found.HabitatSpecies Shallow (n) Percent (%) of TotalTrochus niloticus 38 26.0Tectus pyramis 91 62.3Trochus maculates 16 11.0Charonia tritonis 1 0.7146Table 11: Abundance (%) of gastropod species recorded at different geographical locations. n are totalnumbers of individuals found.Geographical LocationSpecies Sheltered (n) % of Total Exposed (n) % of TotalTrochus niloticus 4 22.2 34 26.6Tectus pyramis 5 27.8 86 67.2Trochus maculates 9 50.0 7 5.5Charonia tritonis 1 0.818 128Table 12: Mean densities (numbers per hectare) for gastropods species found at the shallow habitat duringthe survey.SpeciesShallow Habitat (No./ha)Range (exclude zerovalues)Overall average Average (exclude zerovalues)Trochus niloticus 17 – 183 10 49Tectus pyramis 17 – 150 23 56Trochus maculates 17 – 33 4 24Charonia tritonis 17 0 17355
<strong>Solomon</strong> <strong>Islands</strong> <strong>Marine</strong> <strong>Assessment</strong> Technical ReportTable 13: Number of spiny Lobsters observed during the survey.Species Sites Number observedin Shallow habitatNumber Observedin Deep habitatPanulirus versicolor Sirovanga 7 1Putuputuru 7 1Raverave Island 2Sunda Island 1Sibau Island 3Lisamata (Russ.) 2Three Sisters Is. 2Rohae Reef 5Onou Island 2Fishermen catch(Night diving)Panulirus versicolor Boeboe 8Panulirus penicillatus 7Panulirus femoristriga 2Panulirus versicolor Poro 1Panulirus penicillatus 8Panulirus femoristriga 9Total 24 9 37356
Fisheries Resources: Commercially Important MacroinvertebratesFiguresFigure 1. Track and survey sites of the <strong>Solomon</strong> <strong>Islands</strong> <strong>Marine</strong> <strong>Assessment</strong>357
<strong>Solomon</strong> <strong>Islands</strong> <strong>Marine</strong> <strong>Assessment</strong> Technical ReportTulagi Is. (1)Kombuana Is. (2)Buala reef (3)Tirahi Is. (4)Tanabafe Is. (5)Babao pt. (6)Sarao Is. (7)Palunuhukura bay (8)Matavaghi Is. (9)Rapita Is. (10)Kale Is. (11)Wakao Is. (12)Sibau Is. (13)Malakobi (14)Tuma Is. (15)Kerehikapa Is. (16)Raverave Is. (17)Ondolou Is. (18)Boeboe (19)Poro Is. (20)Taro Is. (21)Putuputuru Is. (22)Sirovanga (23)Vurango (24)Rohae reef (25)Rohae Is. (26)Onua Is. (27)Faisi Is. (28)Leona reef (29)Njari Is. (30)Munda reef (31)Haipe reef (32)Veru pt. (33)Landoro (34)Lumalihe (35)Toatelava Is. (36)Mbili passage (37)Lisamata Is. (38)Mbutata Is. (39)Honga pt. (40)Nikatu passage (41)Honoa Is. (42)Wainipareo reef (43)Haurimanu reef (44)Marautewa Is. (45)Naone Is. (46)Namunga (47)Three Sisters I (48)Three Sisters II (49)Pio is. (50)Pawa bay (51)Airasi (52)Komunihaka reef (53)Arai peninsula (54)Anuta Is. (55)Leili Is. I (56)Leili Is. II (57)Toi reef (58)Suafa bay (59)Falabulu Is. I (60)Falabulu Is. II (61)Nuhu Is. (62)Gavutu Is. (63)Savo Is. (64)Tambea reef (65)Bonegi reef (66)6.005.004.003.002.001.000.00Central Isabel ACMCA Choiseul Western Cent Guad Makira Malaita Cent GuadProvinceFigure 2: Mean number (±SE, n=6) of commercially important invertebrate species per site in the shallow habitat.Mean No.of species per transect (100m²)358
Fisheries Resources: Commercially Important MacroinvertebratesTulagi Is. (1)Kombuana Is. (2)Buala reef (3)Tirahi Is. (4)Tanabafe Is. (5)Babao pt. (6)Sarao Is. (7)Palunuhukura bay (8)Matavaghi Is. (9)Rapita Is. (10)Kale Is. (11)Wakao Is. (12)Sibau Is. (13)Malakobi (14)Tuma Is. (15)Kerehikapa Is. (16)Raverave Is. (17)Ondolou Is. (18)Boeboe (19)Poro Is. (20)Taro Is. (21)Putuputuru Is. (22)Sirovanga (23)Vurango (24)Rohae reef (25)Rohae Is. (26)Onua Is. (27)Faisi Is. (28)Leona reef (29)Njari Is. (30)Munda reef (31)Haipe reef (32)Landoro (34)Lumalihe (35)Toatelava Is. (36)Mbili passage (37)Mbutata Is. (39)Honga pt. (40)Nikatu passage (41)Wainipareo reef (43)Haurimanu reef (44)Marautewa Is. (45)Naone Is. (46)Namunga (47)Three Sisters I (48)Three Sisters II (49)Pio is. (50)Pawa bay (51)Airasi (52)Komunihaka reef (53)Arai peninsula (54)Anuta Is. (55)Leili Is. I (56)Leili Is. II (57)Toi reef (58)Suafa bay (59)Falabulu Is. I (60)Falabulu Is. II (61)Nuhu Is. (62)Gavutu Is. (63)Savo Is. (64)Tambea reef (65)Bonegi reef (66)4.003.503.002.502.001.501.000.500.00Central Isabel ACMCA Choiseul Western Cent Guad Makira Malaita Cent GuadProvinceFigure 3: Mean number (±SE, n=5) of commercially important invertebrate species per site in the deep habitatMean number of species per transect (250m)359
<strong>Solomon</strong> <strong>Islands</strong> <strong>Marine</strong> <strong>Assessment</strong> Technical ReportTulagi Is. (1)Kombuana Is. (2)Buala reef (3)Tirahi Is. (4)Tanabafe Is. (5)Babao pt. (6)Sarao Is. (7)Palunuhukura bay (8)Matavaghi Is. (9)Rapita Is. (10)Kale Is. (11)Wakao Is. (12)Sibau Is. (13)Malakobi (14)Tuma Is. (15)Kerehikapa Is. (16)Raverave Is. (17)Ondolou Is. (18)Boeboe (19)Poro Is. (20)Taro Is. (21)Putuputuru Is. (22)Sirovanga (23)Vurango (24)Rohae reef (25)Rohae Is. (26)Onua Is. (27)Faisi Is. (28)Leona reef (29)Njari Is. (30)Munda reef (31)Haipe reef (32)Veru pt. (33)Landoro (34)Lumalihe (35)Toatelava Is. (36)Mbili passage (37)Lisamata Is. (38)Mbutata Is. (39)Honga pt. (40)Nikatu passage (41)Honoa Is. (42)Wainipareo reef (43)Haurimanu reef (44)Marautewa Is. (45)Naone Is. (46)Namunga (47)Three Sisters I (48)Three Sisters II (49)Pio is. (50)Pawa bay (51)Airasi (52)Komunihaka reef (53)Arai peninsula (54)Anuta Is. (55)Leili Is. I (56)Leili Is. II (57)Toi reef (58)Suafa bay (59)Falabulu Is. I (60)Falabulu Is. II (61)Nuhu Is. (62)Gavutu Is. (63)Savo Is. (64)Tambea reef (65)Bonegi reef (66)5.004.504.003.503.002.502.001.501.000.500.00Central Isabel ACMCA Choiseul Western Cent Guad Makira Malaita Cent GuadProvinceFigure 4: Mean number (±SE, n=6) sea cucumbers per site in the shallow habitat.Mean No. sea cucumbers per transect (100m²)360
Fisheries Resources: Commercially Important MacroinvertebratesTulagi Is. (1)Kombuana Is. (2)Buala reef (3)Tirahi Is. (4)Tanabafe Is. (5)Babao pt. (6)Sarao Is. (7)Palunuhukura bay (8)Matavaghi Is. (9)Rapita Is. (10)Kale Is. (11)Wakao Is. (12)Sibau Is. (13)Malakobi (14)Tuma Is. (15)Kerehikapa Is. (16)Raverave Is. (17)Ondolou Is. (18)Boeboe (19)Poro Is. (20)Taro Is. (21)Putuputuru Is. (22)Sirovanga (23)Vurango (24)Rohae reef (25)Rohae Is. (26)Onua Is. (27)Faisi Is. (28)Leona reef (29)Njari Is. (30)Munda reef (31)Haipe reef (32)Landoro (34)Lumalihe (35)Toatelava Is. (36)Mbili passage (37)Mbutata Is. (39)Honga pt. (40)Nikatu passage (41)Wainipareo reef (43)Haurimanu reef (44)Marautewa Is. (45)Naone Is. (46)Namunga (47)Three Sisters I (48)Three Sisters II (49)Pio is. (50)Pawa bay (51)Airasi (52)Komunihaka reef (53)Arai peninsula (54)Anuta Is. (55)Leili Is. I (56)Leili Is. II (57)Toi reef (58)Suafa bay (59)Falabulu Is. I (60)Falabulu Is. II (61)Nuhu Is. (62)Gavutu Is. (63)Savo Is. (64)Tambea reef (65)Bonegi reef (66)8.007.006.005.004.003.002.001.000.00Central Isabel ACMCA Choiseul Western Cent Guad Makira Malaita Cent GuadProvinceFigure 5: Mean No. (±SE, n=5) sea cucumbers per site in the deep habitat.Mean No. sea cucumber per transect (250m 2 )361
<strong>Solomon</strong> <strong>Islands</strong> <strong>Marine</strong> <strong>Assessment</strong> Technical ReportTulagi Is. (1)Kombuana Is. (2)Buala reef (3)Tirahi Is. (4)Tanabafe Is. (5)Babao pt. (6)Sarao Is. (7)Palunuhukura bay (8)Matavaghi Is. (9)Rapita Is. (10)Kale Is. (11)Wakao Is. (12)Sibau Is. (13)Malakobi (14)Tuma Is. (15)Kerehikapa Is. (16)Raverave Is. (17)Ondolou Is. (18)Boeboe (19)Poro Is. (20)Taro Is. (21)Putuputuru Is. (22)Sirovanga (23)Vurango (24)Rohae reef (25)Rohae Is. (26)Onua Is. (27)Faisi Is. (28)Leona reef (29)Njari Is. (30)Munda reef (31)Haipe reef (32)Veru pt. (33)Landoro (34)Lumalihe (35)Toatelava Is. (36)Mbili passage (37)Lisamata Is. (38)Mbutata Is. (39)Honga pt. (40)Nikatu passage (41)Honoa Is. (42)Wainipareo reef (43)Haurimanu reef (44)Marautewa Is. (45)Naone Is. (46)Namunga (47)Three Sisters I (48)Three Sisters II (49)Pio is. (50)Pawa bay (51)Airasi (52)Komunihaka reef (53)Arai peninsula (54)Anuta Is. (55)Leili Is. I (56)Leili Is. II (57)Toi reef (58)Suafa bay (59)Falabulu Is. I (60)Falabulu Is. II (61)Nuhu Is. (62)Gavutu Is. (63)Savo Is. (64)Tambea reef (65)Bonegi reef (66)3.002.502.001.501.000.500.00Central Isabel ACMCA Choiseul Western Cent Guad Makira Malaita Cent GuadProvinceFigure 6: Mean number (±SE, n=6) of Holothuria edulis per site in the shallow habitat.Mean No. H. edulis per transect (100m 2 )362
Fisheries Resources: Commercially Important MacroinvertebratesTulagi Is. (1)Kombuana Is. (2)Buala reef (3)Tirahi Is. (4)Tanabafe Is. (5)Babao pt. (6)Sarao Is. (7)Palunuhukura bay (8)Matavaghi Is. (9)Rapita Is. (10)Kale Is. (11)Wakao Is. (12)Sibau Is. (13)Malakobi (14)Tuma Is. (15)Kerehikapa Is. (16)Raverave Is. (17)Ondolou Is. (18)Boeboe (19)Poro Is. (20)Taro Is. (21)Putuputuru Is. (22)Sirovanga (23)Vurango (24)Rohae reef (25)Rohae Is. (26)Onua Is. (27)Faisi Is. (28)Leona reef (29)Njari Is. (30)Munda reef (31)Haipe reef (32)Veru pt. (33)Landoro (34)Lumalihe (35)Toatelava Is. (36)Mbili passage (37)Lisamata Is. (38)Mbutata Is. (39)Honga pt. (40)Nikatu passage (41)Honoa Is. (42)Wainipareo reef (43)Haurimanu reef (44)Marautewa Is. (45)Naone Is. (46)Namunga (47)Three Sisters I (48)Three Sisters II (49)Pio is. (50)Pawa bay (51)Airasi (52)Komunihaka reef (53)Arai peninsula (54)Anuta Is. (55)Leili Is. I (56)Leili Is. II (57)Toi reef (58)Suafa bay (59)Falabulu Is. I (60)Falabulu Is. II (61)Nuhu Is. (62)Gavutu Is. (63)Savo Is. (64)Tambea reef (65)Bonegi reef (66)32.521.510.50Central Isabel ACMCA Choiseul Western Cent Guad Makira Malaita Cent GuadProvinceFigure 7: Mean number (±SE, n=6) Pearsonothuria graeffei per site in the shallow habitat.Mean No. P. graeffei per transect (100m 2 )363
<strong>Solomon</strong> <strong>Islands</strong> <strong>Marine</strong> <strong>Assessment</strong> Technical ReportTulagi Is. (1)Kombuana Is. (2)Buala reef (3)Tirahi Is. (4)Tanabafe Is. (5)Babao pt. (6)Sarao Is. (7)Palunuhukura bay (8)Matavaghi Is. (9)Rapita Is. (10)Kale Is. (11)Wakao Is. (12)Sibau Is. (13)Malakobi (14)Tuma Is. (15)Kerehikapa Is. (16)Raverave Is. (17)Ondolou Is. (18)Boeboe (19)Poro Is. (20)Taro Is. (21)Putuputuru Is. (22)Sirovanga (23)Vurango (24)Rohae reef (25)Rohae Is. (26)Onua Is. (27)Faisi Is. (28)Leona reef (29)Njari Is. (30)Munda reef (31)Haipe reef (32)Veru pt. (33)Landoro (34)Lumalihe (35)Toatelava Is. (36)Mbili passage (37)Lisamata Is. (38)Mbutata Is. (39)Honga pt. (40)Nikatu passage (41)Honoa Is. (42)Wainipareo reef (43)Haurimanu reef (44)Marautewa Is. (45)Naone Is. (46)Namunga (47)Three Sisters I (48)Three Sisters II (49)Pio is. (50)Pawa bay (51)Airasi (52)Komunihaka reef (53)Arai peninsula (54)Anuta Is. (55)Leili Is. I (56)Leili Is. II (57)Toi reef (58)Suafa bay (59)Falabulu Is. I (60)Falabulu Is. II (61)Nuhu Is. (62)Gavutu Is. (63)Savo Is. (64)Tambea reef (65)Bonegi reef (66)1.201.000.800.600.400.200.00Central Isabel ACMCA Choiseul Western Cent Guad Makira Malaita Cent GuadProvinceFigure 8: Mean number (±SE, n=6) of Bahadschia argus per site in the shallow habitat.Mean No. B. argus per transect (100m 2 )364
Fisheries Resources: Commercially Important MacroinvertebratesTulagi Is. (1)Kombuana Is. (2)Buala reef (3)Tirahi Is. (4)Tanabafe Is. (5)Babao pt. (6)Sarao Is. (7)Palunuhukura bay (8)Matavaghi Is. (9)Rapita Is. (10)Kale Is. (11)Wakao Is. (12)Sibau Is. (13)Malakobi (14)Tuma Is. (15)Kerehikapa Is. (16)Raverave Is. (17)Ondolou Is. (18)Boeboe (19)Poro Is. (20)Taro Is. (21)Putuputuru Is. (22)Sirovanga (23)Vurango (24)Rohae reef (25)Rohae Is. (26)Onua Is. (27)Faisi Is. (28)Leona reef (29)Njari Is. (30)Munda reef (31)Haipe reef (32)Veru pt. (33)Landoro (34)Lumalihe (35)Toatelava Is. (36)Mbili passage (37)Lisamata Is. (38)Mbutata Is. (39)Honga pt. (40)Nikatu passage (41)Honoa Is. (42)Wainipareo reef (43)Haurimanu reef (44)Marautewa Is. (45)Naone Is. (46)Namunga (47)Three Sisters I (48)Three Sisters II (49)Pio is. (50)Pawa bay (51)Airasi (52)Komunihaka reef (53)Arai peninsula (54)Anuta Is. (55)Leili Is. I (56)Leili Is. II (57)Toi reef (58)Suafa bay (59)Falabulu Is. I (60)Falabulu Is. II (61)Nuhu Is. (62)Gavutu Is. (63)Savo Is. (64)Tambea reef (65)Bonegi reef (66)0.600.500.400.300.200.100.00Central Isabel ACMCA Choiseul Western Cent Guad Makira Malaita Cent GuadProvinceFigure 9: Mean number (±SE, n=6) of Actinopyga lecanora per site in the shallow habitat.Mean No. A. lecanora per transect (100m 2 )365
<strong>Solomon</strong> <strong>Islands</strong> <strong>Marine</strong> <strong>Assessment</strong> Technical ReportTulagi Is. (1)Kombuana Is. (2)Buala reef (3)Tirahi Is. (4)Tanabafe Is. (5)Babao pt. (6)Sarao Is. (7)Palunuhukura bay (8)Matavaghi Is. (9)Rapita Is. (10)Kale Is. (11)Wakao Is. (12)Sibau Is. (13)Malakobi (14)Tuma Is. (15)Kerehikapa Is. (16)Raverave Is. (17)Ondolou Is. (18)Boeboe (19)Poro Is. (20)Taro Is. (21)Putuputuru Is. (22)Sirovanga (23)Vurango (24)Rohae reef (25)Rohae Is. (26)Onua Is. (27)Faisi Is. (28)Leona reef (29)Njari Is. (30)Munda reef (31)Haipe reef (32)Landoro (34)Lumalihe (35)Toatelava Is. (36)Mbili passage (37)Mbutata Is. (39)Honga pt. (40)Nikatu passage (41)Wainipareo reef (43)Haurimanu reef (44)Marautewa Is. (45)Naone Is. (46)Namunga (47)Three Sisters I (48)Three Sisters II (49)Pio is. (50)Pawa bay (51)Airasi (52)Komunihaka reef (53)Arai peninsula (54)Anuta Is. (55)Leili Is. I (56)Leili Is. II (57)Toi reef (58)Suafa bay (59)Falabulu Is. I (60)Falabulu Is. II (61)Nuhu Is. (62)Gavutu Is. (63)Savo Is. (64)Tambea reef (65)Bonegi reef (66)76543210Central Isabel ACMCA Choiseul Western Cent Guad Makira Malaita Cent GuadProvinceFigure 10: Mean number (±SE, n=5) of Holothuria edulis per site in the deep habitat.Mean No. H. edulis per transect (250m 2 )366
Fisheries Resources: Commercially Important MacroinvertebratesTulagi Is. (1)Kombuana Is. (2)Buala reef (3)Tirahi Is. (4)Tanabafe Is. (5)Babao pt. (6)Sarao Is. (7)Palunuhukura bay (8)Matavaghi Is. (9)Rapita Is. (10)Kale Is. (11)Wakao Is. (12)Sibau Is. (13)Malakobi (14)Tuma Is. (15)Kerehikapa Is. (16)Raverave Is. (17)Ondolou Is. (18)Boeboe (19)Poro Is. (20)Taro Is. (21)Putuputuru Is. (22)Sirovanga (23)Vurango (24)Rohae reef (25)Rohae Is. (26)Onua Is. (27)Faisi Is. (28)Leona reef (29)Njari Is. (30)Munda reef (31)Haipe reef (32)Landoro (34)Lumalihe (35)Toatelava Is. (36)Mbili passage (37)Mbutata Is. (39)Honga pt. (40)Nikatu passage (41)Wainipareo reef (43)Haurimanu reef (44)Marautewa Is. (45)Naone Is. (46)Namunga (47)Three Sisters I (48)Three Sisters II (49)Pio is. (50)Pawa bay (51)Airasi (52)Komunihaka reef (53)Arai peninsula (54)Anuta Is. (55)Leili Is. I (56)Leili Is. II (57)Toi reef (58)Suafa bay (59)Falabulu Is. I (60)Falabulu Is. II (61)Nuhu Is. (62)Gavutu Is. (63)Savo Is. (64)Tambea reef (65)Bonegi reef (66)2.502.001.501.000.500.00Central Isabel ACMCA Choiseul Western Cent Guad Makira Malaita Cent GuadProvinceFigure 11: Mean number (±SE, n=5) of Holothuria fuscogilva per site in the deep habitat.Mean No. H. fuscogilva per transect (250m 2 )367
<strong>Solomon</strong> <strong>Islands</strong> <strong>Marine</strong> <strong>Assessment</strong> Technical ReportTulagi Is. (1)Kombuana Is. (2)Buala reef (3)Tirahi Is. (4)Tanabafe Is. (5)Babao pt. (6)Sarao Is. (7)Palunuhukura bay (8)Matavaghi Is. (9)Rapita Is. (10)Kale Is. (11)Wakao Is. (12)Sibau Is. (13)Malakobi (14)Tuma Is. (15)Kerehikapa Is. (16)Raverave Is. (17)Ondolou Is. (18)Boeboe (19)Poro Is. (20)Taro Is. (21)Putuputuru Is. (22)Sirovanga (23)Vurango (24)Rohae reef (25)Rohae Is. (26)Onua Is. (27)Faisi Is. (28)Leona reef (29)Njari Is. (30)Munda reef (31)Haipe reef (32)Landoro (34)Lumalihe (35)Toatelava Is. (36)Mbili passage (37)Mbutata Is. (39)Honga pt. (40)Nikatu passage (41)Wainipareo reef (43)Haurimanu reef (44)Marautewa Is. (45)Naone Is. (46)Namunga (47)Three Sisters I (48)Three Sisters II (49)Pio is. (50)Pawa bay (51)Airasi (52)Komunihaka reef (53)Arai peninsula (54)Anuta Is. (55)Leili Is. I (56)Leili Is. II (57)Toi reef (58)Suafa bay (59)Falabulu Is. I (60)Falabulu Is. II (61)Nuhu Is. (62)Gavutu Is. (63)Savo Is. (64)Tambea reef (65)Bonegi reef (66)2.521.510.50Central Isabel ACMCA Choiseul Western Cent Guad Makira Malaita Cent GuadProvinceFigure 12: Mean number (±SE, n=5) of Thelenota anax per site in the deep habitat.Mean No. T. anax per transect (250m 2 )368
Fisheries Resources: Commercially Important MacroinvertebratesTulagi Is. (1)Kombuana Is. (2)Buala reef (3)Tirahi Is. (4)Tanabafe Is. (5)Babao pt. (6)Sarao Is. (7)Palunuhukura bay (8)Matavaghi Is. (9)Rapita Is. (10)Kale Is. (11)Wakao Is. (12)Sibau Is. (13)Malakobi (14)Tuma Is. (15)Kerehikapa Is. (16)Raverave Is. (17)Ondolou Is. (18)Boeboe (19)Poro Is. (20)Taro Is. (21)Putuputuru Is. (22)Sirovanga (23)Vurango (24)Rohae reef (25)Rohae Is. (26)Onua Is. (27)Faisi Is. (28)Leona reef (29)Njari Is. (30)Munda reef (31)Haipe reef (32)Landoro (34)Lumalihe (35)Toatelava Is. (36)Mbili passage (37)Mbutata Is. (39)Honga pt. (40)Nikatu passage (41)Wainipareo reef (43)Haurimanu reef (44)Marautewa Is. (45)Naone Is. (46)Namunga (47)Three Sisters I (48)Three Sisters II (49)Pio is. (50)Pawa bay (51)Airasi (52)Komunihaka reef (53)Arai peninsula (54)Anuta Is. (55)Leili Is. I (56)Leili Is. II (57)Toi reef (58)Suafa bay (59)Falabulu Is. I (60)Falabulu Is. II (61)Nuhu Is. (62)Gavutu Is. (63)Savo Is. (64)Tambea reef (65)Bonegi reef (66)2.521.510.50Central Isabel ACMCA Choiseul Western Cent Guad Makira Malaita Cent GuadProvinceFigure 13: Mean number (±SE, n=5) of Holothuria atra per site in the deep habitat.Mean No. H. atra per transect (250m 2 )369
<strong>Solomon</strong> <strong>Islands</strong> <strong>Marine</strong> <strong>Assessment</strong> Technical ReportTulagi Is. (1)Kombuana Is. (2)Buala reef (3)Tirahi Is. (4)Tanabafe Is. (5)Babao pt. (6)Sarao Is. (7)Palunuhukura bay (8)Matavaghi Is. (9)Rapita Is. (10)Kale Is. (11)Wakao Is. (12)Sibau Is. (13)Malakobi (14)Tuma Is. (15)Kerehikapa Is. (16)Raverave Is. (17)Ondolou Is. (18)Boeboe (19)Poro Is. (20)Taro Is. (21)Putuputuru Is. (22)Sirovanga (23)Vurango (24)Rohae reef (25)Rohae Is. (26)Onua Is. (27)Faisi Is. (28)Leona reef (29)Njari Is. (30)Munda reef (31)Haipe reef (32)Landoro (34)Lumalihe (35)Toatelava Is. (36)Mbili passage (37)Mbutata Is. (39)Honga pt. (40)Nikatu passage (41)Wainipareo reef (43)Haurimanu reef (44)Marautewa Is. (45)Naone Is. (46)Namunga (47)Three Sisters I (48)Three Sisters II (49)Pio is. (50)Pawa bay (51)Airasi (52)Komunihaka reef (53)Arai peninsula (54)Anuta Is. (55)Leili Is. I (56)Leili Is. II (57)Toi reef (58)Suafa bay (59)Falabulu Is. I (60)Falabulu Is. II (61)Nuhu Is. (62)Gavutu Is. (63)Savo Is. (64)Tambea reef (65)Bonegi reef (66)32.521.510.50Central Isabel ACMCA Choiseul Western Cent Guad Makira Malaita Cent GuadProvinceFigure 14: Mean number (±SE, n=5) of Bohadschia argus per site in the deep habitat.Mean No. B. argus per transect (250m 2 )370
Fisheries Resources: Commercially Important MacroinvertebratesTulagi Is. (1)Kombuana Is. (2)Buala reef (3)Tirahi Is. (4)Tanabafe Is. (5)Babao pt. (6)Sarao Is. (7)Palunuhukura bay (8)Matavaghi Is. (9)Rapita Is. (10)Kale Is. (11)Wakao Is. (12)Sibau Is. (13)Malakobi (14)Tuma Is. (15)Kerehikapa Is. (16)Raverave Is. (17)Ondolou Is. (18)Boeboe (19)Poro Is. (20)Taro Is. (21)Putuputuru Is. (22)Sirovanga (23)Vurango (24)Rohae reef (25)Rohae Is. (26)Onua Is. (27)Faisi Is. (28)Leona reef (29)Njari Is. (30)Munda reef (31)Haipe reef (32)Landoro (34)Lumalihe (35)Toatelava Is. (36)Mbili passage (37)Mbutata Is. (39)Honga pt. (40)Nikatu passage (41)Wainipareo reef (43)Haurimanu reef (44)Marautewa Is. (45)Naone Is. (46)Namunga (47)Three Sisters I (48)Three Sisters II (49)Pio is. (50)Pawa bay (51)Airasi (52)Komunihaka reef (53)Arai peninsula (54)Anuta Is. (55)Leili Is. I (56)Leili Is. II (57)Toi reef (58)Suafa bay (59)Falabulu Is. I (60)Falabulu Is. II (61)Nuhu Is. (62)Gavutu Is. (63)Savo Is. (64)Tambea reef (65)Bonegi reef (66)0.450.40.350.30.250.20.150.10.050Central Isabel ACMCA Choiseul Western Cent Guad Makira Malaita Cent GuadProvinceFigure 15: Mean number (±SE, n=5) of Thelenota ananas per site in the deep habitat.Mean No. T. ananas per transect (250m 2 )371
<strong>Solomon</strong> <strong>Islands</strong> <strong>Marine</strong> <strong>Assessment</strong> Technical Report454035302520151050H. edulis (n=138, av. size=33cm) P. graeffei (n=96, av. size=35cm)16 - 20 21 - 25 26 - 30 31 - 35 36 - 40 41 - 45 46 - 50 51 - 55 56 - 60Size classFigure 16: Size frequency distribution graph for H. edulis and P. graeffei in the shallow habitat.Frequency372
Fisheries Resources: Commercially Important Macroinvertebrates50454035302520151050H. fuscogilva (n=59, av. size=41cm) T. anax (n=36, av. size=62cm)B. argus (n=20, av. size=38cm) H. edulis (n=135, av. size=30cm)H. atra (n=26, av. size=46cm)15 - 20 21 - 25 26 - 30 31 - 35 36 - 40 41 - 45 46 - 50 51 - 55 56 - 60 61 - 65 66 - 70 71 - 75 76 - 80Size classFigure 17: Size frequency distribution graph for the five most common sea cucumber species (20 or more recorded) in thedeep habitat.Frequency373
<strong>Solomon</strong> <strong>Islands</strong> <strong>Marine</strong> <strong>Assessment</strong> Technical ReportTulagi Is. (1)Kombuana Is. (2)Buala reef (3)Tirahi Is. (4)Tanabafe Is. (5)Babao pt. (6)Sarao Is. (7)Palunuhukura bay (8)Matavaghi Is. (9)Rapita Is. (10)Kale Is. (11)Wakao Is. (12)Sibau Is. (13)Malakobi (14)Tuma Is. (15)Kerehikapa Is. (16)Raverave Is. (17)Ondolou Is. (18)Boeboe (19)Poro Is. (20)Taro Is. (21)Putuputuru Is. (22)Sirovanga (23)Vurango (24)Rohae reef (25)Rohae Is. (26)Onua Is. (27)Faisi Is. (28)Leona reef (29)Njari Is. (30)Munda reef (31)Haipe reef (32)Veru pt. (33)Landoro (34)Lumalihe (35)Toatelava Is. (36)Mbili passage (37)Lisamata Is. (38)Mbutata Is. (39)Honga pt. (40)Nikatu passage (41)Honoa Is. (42)Wainipareo reef (43)Haurimanu reef (44)Marautewa Is. (45)Naone Is. (46)Namunga (47)Three Sisters I (48)Three Sisters II (49)Pio is. (50)Pawa bay (51)Airasi (52)Komunihaka reef (53)Arai peninsula (54)Anuta Is. (55)Leili Is. I (56)Leili Is. II (57)Toi reef (58)Suafa bay (59)Falabulu Is. I (60)Falabulu Is. II (61)Nuhu Is. (62)Gavutu Is. (63)Savo Is. (64)Tambea reef (65)Bonegi reef (66)302520151050Central Isabel ACMCA Choiseul Western Cent Guad Makira Malaita Cent GuadProvinceFigure 18: Mean number (±SE, n=6) of Beguina semiorbiculata per site in the shallow habitat.Mean No. B. semiorbiculata per transect (100m 2 )374
Fisheries Resources: Commercially Important MacroinvertebratesTulagi Is. (1)Kombuana Is. (2)Buala reef (3)Tirahi Is. (4)Tanabafe Is. (5)Babao pt. (6)Sarao Is. (7)Palunuhukura bay (8)Matavaghi Is. (9)Rapita Is. (10)Kale Is. (11)Wakao Is. (12)Sibau Is. (13)Malakobi (14)Tuma Is. (15)Kerehikapa Is. (16)Raverave Is. (17)Ondolou Is. (18)Boeboe (19)Poro Is. (20)Taro Is. (21)Putuputuru Is. (22)Sirovanga (23)Vurango (24)Rohae reef (25)Rohae Is. (26)Onua Is. (27)Faisi Is. (28)Leona reef (29)Njari Is. (30)Munda reef (31)Haipe reef (32)Veru pt. (33)Landoro (34)Lumalihe (35)Toatelava Is. (36)Mbili passage (37)Lisamata Is. (38)Mbutata Is. (39)Honga pt. (40)Nikatu passage (41)Honoa Is. (42)Wainipareo reef (43)Haurimanu reef (44)Marautewa Is. (45)Naone Is. (46)Namunga (47)Three Sisters I (48)Three Sisters II (49)Pio is. (50)Pawa bay (51)Airasi (52)Komunihaka reef (53)Arai peninsula (54)Anuta Is. (55)Leili Is. I (56)Leili Is. II (57)Toi reef (58)Suafa bay (59)Falabulu Is. I (60)Falabulu Is. II (61)Nuhu Is. (62)Gavutu Is. (63)Savo Is. (64)Tambea reef (65)Bonegi reef (66)4.504.003.503.002.502.001.501.000.500.00Central Isabel ACMCA Choiseul Western Cent Guad Makira Malaita Cent GuadProvinceFigure 19: Mean number (±SE, n=6) of species of giant clams per site in the shallow habitat.Mean No. of giant clams per transect (100m²)375
<strong>Solomon</strong> <strong>Islands</strong> <strong>Marine</strong> <strong>Assessment</strong> Technical ReportTulagi Is. (1)Kombuana Is. (2)Buala reef (3)Tirahi Is. (4)Tanabafe Is. (5)Babao pt. (6)Sarao Is. (7)Palunuhukura bay (8)Matavaghi Is. (9)Rapita Is. (10)Kale Is. (11)Wakao Is. (12)Sibau Is. (13)Malakobi (14)Tuma Is. (15)Kerehikapa Is. (16)Raverave Is. (17)Ondolou Is. (18)Boeboe (19)Poro Is. (20)Taro Is. (21)Putuputuru Is. (22)Sirovanga (23)Vurango (24)Rohae reef (25)Rohae Is. (26)Onua Is. (27)Faisi Is. (28)Leona reef (29)Njari Is. (30)Munda reef (31)Haipe reef (32)Veru pt. (33)Landoro (34)Lumalihe (35)Toatelava Is. (36)Mbili passage (37)Lisamata Is. (38)Mbutata Is. (39)Honga pt. (40)Nikatu passage (41)Honoa Is. (42)Wainipareo reef (43)Haurimanu reef (44)Marautewa Is. (45)Naone Is. (46)Namunga (47)Three Sisters I (48)Three Sisters II (49)Pio is. (50)Pawa bay (51)Airasi (52)Komunihaka reef (53)Arai peninsula (54)Anuta Is. (55)Leili Is. I (56)Leili Is. II (57)Toi reef (58)Suafa bay (59)Falabulu Is. I (60)Falabulu Is. II (61)Nuhu Is. (62)Gavutu Is. (63)Savo Is. (64)Tambea reef (65)Bonegi reef (66)3.532.521.510.50Central Isabel ACMCA Choiseul Western Cent Guad Makira Malaita Cent GuadProvinceFigure 20: Mean number (±SE, n=6) of Tridacna maxima per site in the shallow habitat.Mean No. T. maxima per transect (100m²)376
Fisheries Resources: Commercially Important MacroinvertebratesTulagi Is. (1)Kombuana Is. (2)Buala reef (3)Tirahi Is. (4)Tanabafe Is. (5)Babao pt. (6)Sarao Is. (7)Palunuhukura bay (8)Matavaghi Is. (9)Rapita Is. (10)Kale Is. (11)Wakao Is. (12)Sibau Is. (13)Malakobi (14)Tuma Is. (15)Kerehikapa Is. (16)Raverave Is. (17)Ondolou Is. (18)Boeboe (19)Poro Is. (20)Taro Is. (21)Putuputuru Is. (22)Sirovanga (23)Vurango (24)Rohae reef (25)Rohae Is. (26)Onua Is. (27)Faisi Is. (28)Leona reef (29)Njari Is. (30)Munda reef (31)Haipe reef (32)Veru pt. (33)Landoro (34)Lumalihe (35)Toatelava Is. (36)Mbili passage (37)Lisamata Is. (38)Mbutata Is. (39)Honga pt. (40)Nikatu passage (41)Honoa Is. (42)Wainipareo reef (43)Haurimanu reef (44)Marautewa Is. (45)Naone Is. (46)Namunga (47)Three Sisters I (48)Three Sisters II (49)Pio is. (50)Pawa bay (51)Airasi (52)Komunihaka reef (53)Arai peninsula (54)Anuta Is. (55)Leili Is. I (56)Leili Is. II (57)Toi reef (58)Suafa bay (59)Falabulu Is. I (60)Falabulu Is. II (61)Nuhu Is. (62)Gavutu Is. (63)Savo Is. (64)Tambea reef (65)Bonegi reef (66)1.61.41.210.80.60.40.20Central Isabel ACMCA Choiseul Western Cent Guad Makira Malaita Cent GuadProvinceFigure 21: Mean number (±SE, n=6) of Tridacna squamosa per site in the shallow habitat.Mean No. T. squamosa per transect (100m²)377
<strong>Solomon</strong> <strong>Islands</strong> <strong>Marine</strong> <strong>Assessment</strong> Technical ReportTulagi Is. (1)Kombuana Is. (2)Buala reef (3)Tirahi Is. (4)Tanabafe Is. (5)Babao pt. (6)Sarao Is. (7)Palunuhukura bay (8)Matavaghi Is. (9)Rapita Is. (10)Kale Is. (11)Wakao Is. (12)Sibau Is. (13)Malakobi (14)Tuma Is. (15)Kerehikapa Is. (16)Raverave Is. (17)Ondolou Is. (18)Boeboe (19)Poro Is. (20)Taro Is. (21)Putuputuru Is. (22)Sirovanga (23)Vurango (24)Rohae reef (25)Rohae Is. (26)Onua Is. (27)Faisi Is. (28)Leona reef (29)Njari Is. (30)Munda reef (31)Haipe reef (32)Veru pt. (33)Landoro (34)Lumalihe (35)Toatelava Is. (36)Mbili passage (37)Lisamata Is. (38)Mbutata Is. (39)Honga pt. (40)Nikatu passage (41)Honoa Is. (42)Wainipareo reef (43)Haurimanu reef (44)Marautewa Is. (45)Naone Is. (46)Namunga (47)Three Sisters I (48)Three Sisters II (49)Pio is. (50)Pawa bay (51)Airasi (52)Komunihaka reef (53)Arai peninsula (54)Anuta Is. (55)Leili Is. I (56)Leili Is. II (57)Toi reef (58)Suafa bay (59)Falabulu Is. I (60)Falabulu Is. II (61)Nuhu Is. (62)Gavutu Is. (63)Savo Is. (64)Tambea reef (65)Bonegi reef (66)3.532.521.510.50Central Isabel ACMCA Choiseul Western Cent Guad Makira Malaita Cent GuadProvinceFigure 22: Mean number (±SE, n=6) of Tridacna crocea per site in the shallow habitat.Mean No. T. crocea per transect (100m²)i378
Fisheries Resources: Commercially Important MacroinvertebratesTulagi Is. (1)Kombuana Is. (2)Buala reef (3)Tirahi Is. (4)Tanabafe Is. (5)Babao pt. (6)Sarao Is. (7)Palunuhukura bay (8)Matavaghi Is. (9)Rapita Is. (10)Kale Is. (11)Wakao Is. (12)Sibau Is. (13)Malakobi (14)Tuma Is. (15)Kerehikapa Is. (16)Raverave Is. (17)Ondolou Is. (18)Boeboe (19)Poro Is. (20)Taro Is. (21)Putuputuru Is. (22)Sirovanga (23)Vurango (24)Rohae reef (25)Rohae Is. (26)Onua Is. (27)Faisi Is. (28)Leona reef (29)Njari Is. (30)Munda reef (31)Haipe reef (32)Veru pt. (33)Landoro (34)Lumalihe (35)Toatelava Is. (36)Mbili passage (37)Lisamata Is. (38)Mbutata Is. (39)Honga pt. (40)Nikatu passage (41)Honoa Is. (42)Wainipareo reef (43)Haurimanu reef (44)Marautewa Is. (45)Naone Is. (46)Namunga (47)Three Sisters I (48)Three Sisters II (49)Pio is. (50)Pawa bay (51)Airasi (52)Komunihaka reef (53)Arai peninsula (54)Anuta Is. (55)Leili Is. I (56)Leili Is. II (57)Toi reef (58)Suafa bay (59)Falabulu Is. I (60)Falabulu Is. II (61)Nuhu Is. (62)Gavutu Is. (63)Savo Is. (64)Tambea reef (65)Bonegi reef (66)0.60.50.40.30.20.10Central Isabel ACMCA Choiseul Western Cent Guad Makira Malaita Cent GuadProvinceFigure 23: Mean number (±SE, n=6) of Tridacna gigas per site in the shallow habitat.Mean No. T. gigas per transect (100m²)379
<strong>Solomon</strong> <strong>Islands</strong> <strong>Marine</strong> <strong>Assessment</strong> Technical ReportTulagi Is. (1)Kombuana Is. (2)Buala reef (3)Tirahi Is. (4)Tanabafe Is. (5)Babao pt. (6)Sarao Is. (7)Palunuhukura bay (8)Matavaghi Is. (9)Rapita Is. (10)Kale Is. (11)Wakao Is. (12)Sibau Is. (13)Malakobi (14)Tuma Is. (15)Kerehikapa Is. (16)Raverave Is. (17)Ondolou Is. (18)Boeboe (19)Poro Is. (20)Taro Is. (21)Putuputuru Is. (22)Sirovanga (23)Vurango (24)Rohae reef (25)Rohae Is. (26)Onua Is. (27)Faisi Is. (28)Leona reef (29)Njari Is. (30)Munda reef (31)Haipe reef (32)Veru pt. (33)Landoro (34)Lumalihe (35)Toatelava Is. (36)Mbili passage (37)Lisamata Is. (38)Mbutata Is. (39)Honga pt. (40)Nikatu passage (41)Honoa Is. (42)Wainipareo reef (43)Haurimanu reef (44)Marautewa Is. (45)Naone Is. (46)Namunga (47)Three Sisters I (48)Three Sisters II (49)Pio is. (50)Pawa bay (51)Airasi (52)Komunihaka reef (53)Arai peninsula (54)Anuta Is. (55)Leili Is. I (56)Leili Is. II (57)Toi reef (58)Suafa bay (59)Falabulu Is. I (60)Falabulu Is. II (61)Nuhu Is. (62)Gavutu Is. (63)Savo Is. (64)Tambea reef (65)Bonegi reef (66)1.210.80.60.40.20Central Isabel ACMCA Choiseul Western Cent Guad Makira Malaita Cent GuadProvinceFigure 24: Mean number (±SE, n=6) of Tridacna derasa per site in the shallow habitat.Mean No. T. derasa per transect (100m²)380
Fisheries Resources: Commercially Important MacroinvertebratesTulagi Is. (1)Kombuana Is. (2)Buala reef (3)Tirahi Is. (4)Tanabafe Is. (5)Babao pt. (6)Sarao Is. (7)Palunuhukura bay (8)Matavaghi Is. (9)Rapita Is. (10)Kale Is. (11)Wakao Is. (12)Sibau Is. (13)Malakobi (14)Tuma Is. (15)Kerehikapa Is. (16)Raverave Is. (17)Ondolou Is. (18)Boeboe (19)Poro Is. (20)Taro Is. (21)Putuputuru Is. (22)Sirovanga (23)Vurango (24)Rohae reef (25)Rohae Is. (26)Onua Is. (27)Faisi Is. (28)Leona reef (29)Njari Is. (30)Munda reef (31)Haipe reef (32)Veru pt. (33)Landoro (34)Lumalihe (35)Toatelava Is. (36)Mbili passage (37)Lisamata Is. (38)Mbutata Is. (39)Honga pt. (40)Nikatu passage (41)Honoa Is. (42)Wainipareo reef (43)Haurimanu reef (44)Marautewa Is. (45)Naone Is. (46)Namunga (47)Three Sisters I (48)Three Sisters II (49)Pio is. (50)Pawa bay (51)Airasi (52)Komunihaka reef (53)Arai peninsula (54)Anuta Is. (55)Leili Is. I (56)Leili Is. II (57)Toi reef (58)Suafa bay (59)Falabulu Is. I (60)Falabulu Is. II (61)Nuhu Is. (62)Gavutu Is. (63)Savo Is. (64)Tambea reef (65)Bonegi reef (66)1.401.201.000.800.600.400.200.00Central Isabel ACMCA Choiseul Western Cent Guad Makira Malaita Cent GuadProvinceFigure 25: Mean number (±SE, n=6) of Pinctada margaritifera per site in the shallow habitat.Mean No. P. margaritifera per transect (100m²)381
<strong>Solomon</strong> <strong>Islands</strong> <strong>Marine</strong> <strong>Assessment</strong> Technical Report4035302520151050T. gigas (n=12, av. Size=70cm) T. derasa (n=17, av. Size=51cm)T. squamosa (n=95, av. Size=33cm) T. maxima (n=115, av.size=23cm)T. crocea (n=60, av.size = 11cm)0 - 5 6 - 10 11 -1516 -2021 -2526 -3031 -3536 -4041 -4546 -5051 -5556 -60Size class61 -6566 -7071 -7576 -8081 -8586 -9091 -9596 -100101 -105106 -110111 -115Figure 26: Size frequency distribution graph for the five Tridacnid clam species encountered during survey in the shallowhabitat.Frequency382
Fisheries Resources: Commercially Important Macroinvertebrates20181614121086420P. margaritifera (n=39, av. Size=14cm)6.0 - 7.9 8.0 - 9.9 10.0 - 11.9 12.0 - 13.9 14.0 - 15.9 16.0 - 17.9 18.0 - 19.9Size classFigure 27: Size frequency distribution graph of P. margaritifera recorded during the survey in the shallow habitat.Frequency383
<strong>Solomon</strong> <strong>Islands</strong> <strong>Marine</strong> <strong>Assessment</strong> Technical ReportTulagi Is. (1)Kombuana Is. (2)Buala reef (3)Tirahi Is. (4)Tanabafe Is. (5)Babao pt. (6)Sarao Is. (7)Palunuhukura bay (8)Matavaghi Is. (9)Rapita Is. (10)Kale Is. (11)Wakao Is. (12)Sibau Is. (13)Malakobi (14)Tuma Is. (15)Kerehikapa Is. (16)Raverave Is. (17)Ondolou Is. (18)Boeboe (19)Poro Is. (20)Taro Is. (21)Putuputuru Is. (22)Sirovanga (23)Vurango (24)Rohae reef (25)Rohae Is. (26)Onua Is. (27)Faisi Is. (28)Leona reef (29)Njari Is. (30)Munda reef (31)Haipe reef (32)Veru pt. (33)Landoro (34)Lumalihe (35)Toatelava Is. (36)Mbili passage (37)Lisamata Is. (38)Mbutata Is. (39)Honga pt. (40)Nikatu passage (41)Honoa Is. (42)Wainipareo reef (43)Haurimanu reef (44)Marautewa Is. (45)Naone Is. (46)Namunga (47)Three Sisters I (48)Three Sisters II (49)Pio is. (50)Pawa bay (51)Airasi (52)Komunihaka reef (53)Arai peninsula (54)Anuta Is. (55)Leili Is. I (56)Leili Is. II (57)Toi reef (58)Suafa bay (59)Falabulu Is. I (60)Falabulu Is. II (61)Nuhu Is. (62)Gavutu Is. (63)Savo Is. (64)Tambea reef (65)Bonegi reef (66)3.002.502.001.501.000.500.00Central Isabel ACMCA Choiseul Western Cent Guad Makira Malaita Cent GuadProvinceFigure 28: Mean number (±SE, n=6) of Tectus pyramis per site in the shallow habitat.Mean No. T. pyramis per transect (100m²)384
Fisheries Resources: Commercially Important MacroinvertebratesTulagi Is. (1)Kombuana Is. (2)Buala reef (3)Tirahi Is. (4)Tanabafe Is. (5)Babao pt. (6)Sarao Is. (7)Palunuhukura bay (8)Matavaghi Is. (9)Rapita Is. (10)Kale Is. (11)Wakao Is. (12)Sibau Is. (13)Malakobi (14)Tuma Is. (15)Kerehikapa Is. (16)Raverave Is. (17)Ondolou Is. (18)Boeboe (19)Poro Is. (20)Taro Is. (21)Putuputuru Is. (22)Sirovanga (23)Vurango (24)Rohae reef (25)Rohae Is. (26)Onua Is. (27)Faisi Is. (28)Leona reef (29)Njari Is. (30)Munda reef (31)Haipe reef (32)Veru pt. (33)Landoro (34)Lumalihe (35)Toatelava Is. (36)Mbili passage (37)Lisamata Is. (38)Mbutata Is. (39)Honga pt. (40)Nikatu passage (41)Honoa Is. (42)Wainipareo reef (43)Haurimanu reef (44)Marautewa Is. (45)Naone Is. (46)Namunga (47)Three Sisters I (48)Three Sisters II (49)Pio is. (50)Pawa bay (51)Airasi (52)Komunihaka reef (53)Arai peninsula (54)Anuta Is. (55)Leili Is. I (56)Leili Is. II (57)Toi reef (58)Suafa bay (59)Falabulu Is. I (60)Falabulu Is. II (61)Nuhu Is. (62)Gavutu Is. (63)Savo Is. (64)Tambea reef (65)Bonegi reef (66)32.521.510.50Central Isabel ACMCA Choiseul Western Cent Guad Makira Malaita Cent GuadProvinceFigure 29: Mean number (±SE, n=6) of Trochus niloticus per site in the shallow habitat.Mean No. T. niloticus per transect (100m²)385
<strong>Solomon</strong> <strong>Islands</strong> <strong>Marine</strong> <strong>Assessment</strong> Technical Report14121086420T. niloticus (n=38, av. size=10.0cm)6.0 - 7.9 8.0 - 9.9 10.0 - 11.9 12.0 - 13.9 14.0 - 15.9 16.0 - 17.9 18.0 - 19.9Size classFigure 30: Size frequency distribution graph for T. niloticus recorded during the survey.Frequency386
Fisheries Resources: Commercially Important MacroinvertebratesAppendicesAppendix 1: <strong>Islands</strong>, sites and habitats surveyed in the <strong>Solomon</strong> <strong>Islands</strong> <strong>Marine</strong> <strong>Assessment</strong>. GPScoordinates are provided for each site, and the geographical location of each site is provided in Figure1.Island Site No. Site Name Reef Habitat GPS Co-ordinatesFlorida Is 1 Tulagi Switzer Is. (1) Sheltered S 08 02.106 E160 06.302Florida Is 2 Kombuana Is. (2) Exposed S 08 50.631 E160 02.215Isabel Is 3 Buala reef (3) Exposed S 08 08.810 E159 38.158Isabel Is 4 Tirahi Is. (4) Sheltered S 08 24.692 E159 47.671Isabel Is 5 Tanabafe Is. (5) Exposed ?? ??Isabel Is 6 Babao pt. (6) Sheltered S 08 12.393 E159 13.873Isabel Is 7 Sarao Is. (7) Exposed S 08 00.100 E158 54.531Isabel Is 8 Palunuhukura bay (8) Sheltered S 07 50.769 E158 43.315Isabel Is 9 Matavaghi Is. (9) Sheltered S 07 33.562 E158 18.733Isabel Is 10 Rapita Is. (10) Sheltered S 07 28.914 E158 23.995Isabel Is 11 Kale Is. (11) Exposed S 07 25.872 E158 19.062Isabel Is 12 Wakao Is. (12) Sheltered S 07 26.148 E158 18.145Isabel Is 13 Sibau Is. (13) Exposed S 07 23.267 E158 05.241Isabel Is 14 Malakobi (14) Sheltered S 07 23.110 E158 09.065Arnavon Is 15 Tuma Is. (15) Exposed S 07 28.381 E158 02.584Arnavon Is 16 Kerehikapa Is. (16) Sheltered S 07 27.625 E158 02.505Choiseul Is 17 Raverave Is. (17) Exposed S 07 32.809 E157 47.160Choiseul Is 18 Ondolou Is. (18) Sheltered S 07 31.162 E157 43.671Choiseul Is 19 Boeboe (19) Sheltered S 07 24.721 E157 23.841Choiseul Is 20 Poro Is. (20) Exposed S 07 21.545 E157 05.524Choiseul Is 21 Taro Is. (21) Exposed S 06 43.358 E156 23.528Choiseul Is 22 Putuputuru Is. (22) Sheltered S 06 42.106 E156 24.261Choiseul Is 23 Sirovanga (23) Exposed S 06 36.878 E156 33.907Choiseul Is 24 Vurango (24) Sheltered S 06 36.083 E156 34.603Shortland Is 25 Rohae reef (25) Exposed S 07 00.015 E156 04.408Shortland Is 26 Rohae Is. (26) Sheltered S 07 00.015 E156 03.262Shortland Is 27 Onua Is. (27) Exposed S7 05.177 E155 53.973Shortland Is 28 Faisi Is. (28) Sheltered S7 03.744 E155 52.240Vela Lavella 29 Leona reef (29) Exposed S7 43.597 E156 30.615Gizo 30 Njari Is. (30) Exposed S8 00.853 E156 45.614Munda 31 Munda reef (31) Sheltered S8 20.267 E157 13.741Munda 32 Haipe reef (32) Exposed S8 26.174 E157 16.191Marovo 33 Veru pt. (33) Exposed S8 26.174 E157 16.191Marovo 34 Landoro (34) Exposed S8 26.174 E157 16.191Marovo 35 Lumalihe (35) Sheltered S8 28.324 E158 03.610Marovo 36 Toatelava Is. (36) Exposed S8 39.010 E158 11.848Marovo 37 Mbili passage (37) Sheltered S8 40.381 E158 11.538Russell Is 38 Lisamata Is. (38) Exposed S8 57.954 E159 08.811Russell Is 39 Mbutata Is. (39) Sheltered S8 59.689 E159 07.055Russell Is 40 Honga pt. (40) Exposed S9 08.541 E159 06.194Russell Is 41 Nikatu passage (41) Sheltered S9 07.376 E159 09.288Guadalcanal 42 Honoa Is. (42) Exposed S9 49.032 E160 53.362Guadalcanal 43 Wainipareo reef (43) Sheltered S9 48.651 E160 51.659Makira Is 44 Haurimanu reef (44) Exposed S10 20.932 E161 22.797Makira Is 45 Marautewa Is. (45) Sheltered S10 28.591 E161 30.501387
<strong>Solomon</strong> <strong>Islands</strong> <strong>Marine</strong> <strong>Assessment</strong> Technical ReportIsland Site No. Site Name Reef Habitat GPS Co-ordinatesMakira Is 46 Naone Is. (46) Exposed S10 48.414 E162 17.014Makira Is 47 Namunga (47) Sheltered S10 48.998 E162 16.818Makira Is 48 Three Sisters I (48) Exposed S10 13.919 E161 57.127Makira Is 49 Three Sisters II (49) Sheltered S10 16.236 E161 58.242Pio 50 Pio is. (50) Exposed S10 11.361 E161 40.634Makira Is 51 Pawa bay (51) Sheltered S10 11.361 E161 40.634Malaita 52 Airasi (52) Sheltered S9 23.790 E161 11.383Malaita 53Komunihaka reef(53) Exposed S8 29 539 E161 14.641Malaita 54 Arai peninsula (54) Sheltered S9 20.188 E161 19.996Malaita 55 Anuta Is. (55) Exposed S9 19.415 E161 18.089Malaita 56 Leili Is. I (56) Exposed S8 46.389 E161 01.036Malaita 57 Leili Is. II (57) Sheltered S8 45.377 E161 01.232Malaita 58 Toi reef (58) Exposed S8 19.046 E160 39.987Malaita 59 Suafa bay (59) Sheltered S8 20.164 E160 41.698Malaita 60 Falabulu Is. I (60) Exposed S8 50.450 E160 43.597Malaita 61 Falabulu Is. II (61) Sheltered S8 50 416 E160 43.833Ngella Is 62 Nuhu Is. (62) Exposed S9 16.969 E160 20.779Ngella Is 63 Gavutu Is. (63) Sheltered S9 06.493 E160 11.332Savo Is 64 Savo Is. (64) Exposed S9 07.975 E159 46.981Guadalcanal 65 Tambea reef (65) Exposed S9 15.780 E159 39.389Guadalcanal 66 Bonegi reef (66) Exposed S9 23.623 E159 52.841388
Fisheries Resources: Commercially Important MacroinvertebratesAppendix 2: Invertebrates included in the surveySPECIES COMMON NAME COMMENTS(1) Holothurians Sea cucumbersActinopyga crassa ? Only 1 specimen recorded in deep transect in Mbili (site 37). Also identified from a specimen by seagrass team.A. lecanora Stonefish Only 10 individuals recorded from six sites in shallow habitat from Isabel, Arnavons, North Choiseul, shortlands and Marau.A. mauritiana Surf redfish Not seen in transects. (Only found in surf break areas and reef flats on fringing reefs).A. miliaris Blackfish Encountered only in deep habitat. Only 8 recorded from 4 sites. 6 of these 8 were recorded in the Arnavon <strong>Islands</strong> (ACMCA).Bohadschia argus Tigerfish Recorded at many sites in both deep and shallow habitats. ACMCA sites (15 & 16) recorded the highest numbers.B. similis Chalkfish Not encountered in transects but one specimen identified in seagrass areas in Florida.B. vitiensis Brown Sandfish Only 6 individuals recorded from both deep and shallow habitats in Isabel, ACMCA, Choiseul, Florida and Malaita .Holothuria atra Lollyfish Low numbers in shallow habitat transects. High counts in deep transects at ACMCA, Shortlands and Buala reef (site 3).H. coluber Snakefish Not seen in transects.H. edulis Pinkfish The most common species in both deep and shallow habitats. Seen at the most number of sites during the survey.H. fuscogilva White Teatfish Only 3 specimens recorded in shallow. Seen at many sites in deep habitat (second common species to pinkfish).H. fuscopunctata Elephant's Trunkfish Seen at least 10 sites in deep habitat. Uncommon in shallow habitat (only 1 specimen recorded in transects).H. nobilis Black Teatfish Only seen in the ACMCA and one other site on Isabel in both deep and shallow habitats.H. scabra Sandfish Not seen in transects but identified in seagrass areas in Isabel (near San George Island).Pearsonothuria graeffei Orangefish Second most common species to pinkfish in the shallow habitat. Not seen at some sites in the deep habitat.Stichopus chloronotus Greenfish Seen in very low numbers. Only 3 recorded in the shallow habitat at Onua Island (site 27) in the Shortland <strong>Islands</strong>.S. horrens Dragonfish/Peanutfish Not recorded during the survey.S. hermanni Curryfish Seen in low numbers. Only 15 recorded from 7 sites in deep habitat. Not seen in the shallow habitat.S. pseudohorrens ? Not seen in shallow habitat. Only 2 specimens were recorded in transects at two sites (48 & 49) in the Three Sister <strong>Islands</strong>.Thelenota ananas Prickly Redfish Seen in low numbers in both deep and shallow habitats.T. anax Amberfish Seen at many sites in the deep habitat but at less number of sites and low numbers in shallow habitat.T. rubralineata Lemonfish Only recorded at Bonegi (site 66) in deep habitat. 3 specimens in transect.(2) Bivalves Clams & OystersTridacna gigas Giant clam Only 12 recorded from 9 sites in Isabel, ACMCA, Waghena, Taro, Shortland, Marovo and Are'Are lagoon.Tridacna derasa Smooth giant clam Only 17 recorded during the survey. Most of these from sites in Isabel and the ACMCA.Tridacna squamosa Fluted giant clam Encountered at about 70% of sites. Four individuals were also recorded in the deep habitat.Tridacna maxima Rugose giant clam The most abundant clam species on the survey but encountered at less number of sites compared to T. squamosa.Tridacna crocea Burrowing giant clam A common clam species. High counts made in Shortlands and Marovo. Seagrass team recorded high density near site 8 in Isabel.Hippopus hippopus Horseshoe clam Very low numbers. Only 4 animals recorded during the survey (mainly in Isabel and ACMCA).Pinctada margaritifera Blacklip pearl oyster Seen at many sites (at least 23 sites).Pinctada maxima Goldlip pearl oyster None seen during the survey.Pteria penquin Brownlip pearl oyster Encountered at 5 sites but 95 % of specimen recorded at sites 18 (Ondolou Is.), 29 (Leona reef), 37 (Mbili) and 52 (Airasi).Beguina semiorbiculata White rock shell The most common bivalve. Present at many sites (33) especially at sheltered sites.Atrina vexillum Not seen at many sites. Prefer sandy bottom habitats.(3) Gastropods SnailsTrochus niloticus Trochus Seen at least 13 sites. Some sites like Toi reef (site58) on Malaita and ACMCA recorded high numbers.Turbo marmoratus Greensnail None seen.Pyramis tectus False trochus Commonly encountered or recorded at many sites.389
<strong>Solomon</strong> <strong>Islands</strong> <strong>Marine</strong> <strong>Assessment</strong> Technical ReportSPECIES COMMON NAME COMMENTS(4) CrayfishPanulirus penicillatus Double-spinned rock lobster Not seen on transect but common in fishermen catch.Panulirus versicolor Painted rock lobster Occasionally seen – Seen at 9 sites during the survey.Panulirus femoristriga Stripe-leg spiny lobster Only seen from fishermen catch in Choiseul.Panulirus ornatus Ornate spiny lobster Not seen.(5) OthersAcanthaster planci Crown of thorns starfish Seen at least 12 sites in but relatively low numbers.Charonia tritonis Triton shell Only 1 specimen recorded at Naone Is. (site 46) in Makira.Parribaccus spp. Slipper lobster None seen in transects but two were seen in fishermen (night diving) catch in Choiseul .390
Fisheries Resources: Commercially Important MacroinvertebratesAppendix 3: Survey data for sea cucumber in shallow habitat. n are numbers found at sites (all transects) and m are mean numbers per transect (100m 2 )SPECIESSITESH.fuscogilva B. argus H. edulis P. graeffei T. ananas T. anax S. hermanni H. nobilisH.fuscpunctata H. atraS.chloronotus B. vitiensis A. lecanoran m n m n m n m n m n m n m n m n m n m n m n m n mTulagi Is. (1) 1 0.17 5 0.83Kombuana Is. (2)Buala reef (3) 2 0.33Tirahi Is. (4) 2 0.33Tanabafe Is. (5) 1 0.17Babao pt. (6) 4 0.67 7 1.17Sarao Is. (7)Palunuhukura bay (8) 2 0.33Matavaghi Is. (9) 5 0.83 3 0.50Rapita Is. (10) 7 1.17Kale Is. (11) 4 0.67Wakao Is. (12) 2 0.33 1 0.17Sibau Is. (13) 1 0.17 2 0.33 1 0.17 1 0.17Malakobi (14) 1 0.17 1 0.17 1 0.17 1 0.17Tuma Is. (15) 1 0.17Kerehikapa Is. (16) 1 0.17 2 0.33 1 0.17 2 0.33 2 0.33 1 0.17Raverave Is. (17) 4 0.67Ondolou Is. (18)Boeboe (19) 1 0.17 7 1.17Poro Is. (20) 4 0.67Taro Is. (21)Putuputuru Is. (22) 1 0.17 2 0.33 1 0.17 1 0.17 1 0.17Sirovanga (23) 8 1.33 1 0.17Vurango (24) 7 1.17Rohae reef (25) 1 0.17 1 0.17Rohae Is. (26) 4 0.67Onua Is. (27) 3 0.50 3 0.50 2 0.33Faisi Is. (28) 1 0.17 4 0.67Leona reef (29) 1 0.17Njari Is. (30) 2 0.33 5 0.83Munda reef (31) 14 2.33 10 1.67Haipe reef (32) 2 0.33 1 0.17Veru pt. (33) 1 0.17 2 0.33 1 0.17Landoro (34)Lumalihe (35) 1 0.17391
<strong>Solomon</strong> <strong>Islands</strong> <strong>Marine</strong> <strong>Assessment</strong> Technical ReportToatelava Is. (36) 1 0.17 12 2.00Mbili passage (37)Lisamata Is. (38)Mbutata Is. (39) 1 0.17 1 0.17 1 0.17Honga pt. (40) 1 0.17Nikatu passage (41) 2 0.33Honoa Is. (42)Wainipareo reef (43) 5 0.83 4 0.67 1 0.17Haurimanu reef (44) 1 0.17Marautewa Is. (45) 4 0.67 1 0.17Naone Is. (46) 1 0.17Namunga (47) 1 0.17Three Sisters I (48)Three Sisters II (49) 2 0.33 1 0.17Pio is. (50) 1 0.17 1 0.17Pawa bay (51) 1 0.17 2 0.33Airasi (52) 5 0.83 1 0.17 1 0.17Komunihaka rf (53)Arai peninsula (54) 8 1.33Anuta Is. (55) 2 0.33 3 0.50Leili Is. I (56) 2 0.33 1 0.17 1 0.17 2 0.33Leili Is. II (57) 1 0.17 6 1.00 2 0.33Toi reef (58) 1 0.17Suafa bay (59) 8 1.33 3 0.50Falabulu Is. I (60) 1 0.17 8 1.33 1 0.17 1 0.17Falabulu Is. II (61) 5 0.83 2 0.33 1 0.17Nuhu Is. (62) 1 0.17 10 1.67 2 0.33Gavutu Is. (63) 2 0.33 2 0.33Savo Is. (64)Tambea reef (65) 1 0.17 8 1.33 1 0.17Bonegi reef (66) 10 1.67TOTAL 3 16 151 104 6 5 1 2 1 5 3 3 10OVERALL AVER. 0.05 0.01 0.24 0.04 2.29 0.38 1.58 0.26 0.09 0.02 0.08 0.01 0.02 0.00 0.03 0.01 0.02 0.00 0.08 0.01 0.05 0.01 0.05 0.01 0.15 0.03NON-ZERO AVE. 1.00 0.17 1.33 0.22 4.58 0.76 2.74 0.46 1.50 0.25 1.67 0.28 1.00 0.17 2.00 0.33 1.00 0.17 1.25 0.21 3.00 0.50 1.00 0.17 1.11 0.19392
Fisheries Resources: Commercially Important MacroinvertebratesAppendix 4: Survey data for sea cucumber in deep habitat. n are numbers found at each site. m are mean numbers per transect (250m 2 ). Note: No deep survey was done at sites 33, 38 and 42SPECIESSITES H. fuscog. B. argus H. edulis P. graeffei T. ananas T. anax S. herman.n m n m n m n m n m n m n m n m n m n m n m n m n m n m n mTulagi Is.(1) 2 0.40 1 0.20 4 0.80 1 0.20 1 0.20H.nobilisH.fuscopunctata. H. atraA.miliaris B. vitiensis A. crassa S pseudohor.T.rubralinea.Kombuana Is.(2) 1 0.20 1 0.20Buala Reef (3) 4 0.80 7 1.40Tirahi Is.(4) 9 1.80 5 1.00Tanabafe Is.(5) 2 0.40 1 0.20 1 0.20Babao pt. (6) 1 0.20 1 0.20Sarao Is. (7) 2 0.40Palunuhukura (8) 1 0.20Matavaghi Is.(9) 1 0.20 21 4.20 2 0.40 1 0.20Rapita Is.(10) 1 0.20Kale Is.(11) 1 0.20Wakao Is.(12) 1 0.20Sibau Is.(13) 2 0.40 1 0.20 1 0.20Malakobi Is.(14) 1 0.20Tuma Is.(15) 4 0.80 9 1.80 2 0.40 4 0.80 2 0.40Kerehikapa Is.(16) 1 0.20 4 0.80 1 0.20 2 0.40 1 0.20 1 0.20 5 1.00 4 0.80 1 0.20Raverave Is.(17) 7 1.40 1 0.20Ondolou Is.(18) 1 0.20Boeboe (19)Poro Is. (20) 1 0.20Taro Is. (21) 2 0.40utuputuru Is.(22) 6 1.20 1 0.20 1 0.20 2 0.40Sirovanga (23) 1 0.20Vurango (24) 2 0.40Rohae reef (25) 1 0.20 1 0.20 1 0.20 1 0.20 6 1.20Rohae Is. (26) 2 0.40 1 0.20 1 0.20Onua Is.(27) 1 0.20 1 0.20Faisi Is.(28) 1 0.20Leona Reef (29) 1 0.20 1 0.20 1 0.20Njari Is.(30) 1 0.20 1 0.20 1 0.20Munda Reef (31) 1 0.20 6 1.20Haipe Reef (32)Veru pt (33)Landoro (34) 1 0.20 1 0.20Lumalihe (35) 4 0.80 1 0.20 2 0.40 1 0.20393
<strong>Solomon</strong> <strong>Islands</strong> <strong>Marine</strong> <strong>Assessment</strong> Technical ReportToatelava Is.(36) 1 0.20Mbili Passage (37) 1 0.20 1 0.20 1 0.20Lisamata Is. (38)Mbutata Is.(39) 1 0.20 1 0.20Honga Point (40) 3 0.60 1 0.20 1 0.20Nikatu (41) 2 0.40 1 0.20Honoa Is. (42)Wainipareo (43) 2 0.40 6 1.20 1 0.20Haurimanu (44) 1 0.20 2 0.40Marautewa Is. (45) 6 1.20 1 0.20 1 0.20 3 0.60Naone Is.(46)Namuga .(47) 1 0.20Three Sisters I(48) 1 0.20 5 1.00 1 0.20Three Sisters II(49) 2 0.40 1 0.20 1 0.20Pio Is. (50) 1 0.20Pawa Bay (51) 2 0.40Airasi (52) 2 0.40Komunihaka (53) 3 0.60 1 0.20 1 0.20Arai (54)Anuta Is.(55) 1 0.20Leili Is. I (56) 1 0.20 20 4.00 1 0.20 1 0.20Leili Is. II (57) 19 3.80 1 0.20Toi Reef (58) 1 0.20Suafa Bay (59) 7 1.40Falabulu Is. I (60) 4 0.80 10 2.00 1 0.20Falabulu Is. II (61)Nuhu Is. (62) 1 0.20 1 0.20 1 0.20 1 0.20Gavutu Is. (63) 1 0.20 1 0.20 11 2.20 2 0.40 1 0.20 3 0.60 1 0.20Savo Is. (64) 1 0.20Tambea (D65) 3 0.60 5 1.00 3 0.60Bonegi (66) 7 1.40 3 0.60 3 0.60TOTAL 59 24 138 10 10 36 15 2 16 32 8 3 1 2 3OVERALL AVER. 0.94 0.19 0.38 0.08 2.19 0.44 0.16 0.03 0.16 0.03 0.57 0.11 0.24 0.05 0.03 0.01 0.25 0.05NON-ZEROAVER. 2.19 0.44 2.00 0.40 6.57 1.31 1.25 0.25 1.00 0.20 1.71 0.34 2.14 0.43 1.00 0.20 1.60 0.320.51 0.10 0.13 0.03 0.05 0.01 0.02 0.00 0.03 0.01 0.05 0.012.46 0.49 2.00 0.40 1.00 0.20 1.00 0.20 1.00 0.20 3.00 0.60394
Fisheries Resources: Commercially Important MacroinvertebratesAppendix 5: Survey data for bivalves in the shallow habitat. n are numbers found in all transects. m are mean numbers per transect (100 m 2 ).SPECIEST. gigas T. derasa T. squamosa T. maxima T. crocea H. hippopus P. margarit P. penquin B. semiorbicu A. vexillumSITES No. n m n m n m n m n m n m n m n m n m n mTulagi Is. 1 2 0.33Kombuana Is. 2 1 0.17 1 0.17Buala Reef 3Tirahi Is. 4 1 0.17 37 6.17 1 0.17Tanabafe Is. 5 4 0.67Babao pt. 6 6 1 3 0.50Sarao Is. 7 2 0.33 2 0.33 1 0.17Palunuhukura bay. 8 1 0.17 1 0.17Matavaghi Is. 9 3 0.5 1 0.17 1 0.17 5 0.83 3 0.50Rapita Is. 10 6 1.00Kale Is. 11 1 0.17 5 0.83 1 0.17 4 0.67Wakao Is. 12 6 1 2 0.33 1 0.17 36 6.00Sibau Is. 13 1 0.17 1 0.17 1 0.17 2 0.33 1 0.17Malakobi Is. 14 2 0.33 2 0.33 12 2.00Tuma Is. 15 2 0.33 5 0.83 7 1.17 5 0.83 2 0.33Kerehikapa Is. 16 4 0.67 2 0.33 8 1.33 4 0.67 2 0.33 2 0.33Raverave Is. 17 2 0.33 2 0.33 2 0.33 1 0.17 3 0.50 1 0.17Ondolou Is. 18 1 0.17 2 0.33 3 0.5 3 0.50 1 0.17 9 1.50 25 4.17 1 0.17Boeboe 19 13 2.17Poro Is. 20 4 0.67 1 0.17 1 0.17Taro Is. 21 2 0.33 2 0.33 2 0.33Putuputuru Is. 22 1 0.17 1 0.17 9 1.50Sirovanga 23 2 0.33 2 0.33Vurango 24 2 0.33 32 5.33Rohae reef 25 1 0.17 1 0.17 1 0.17Rohae Is. 26 1 0.17 6 1 12 2 1 0.17 54 9.00 2 0.33Onua Is. 27 2 0.33Faisi Is. 28 1 0.17 1 0.17 4 0.67 1 0.17Leona Reef 29 1 0.17 1 0.17 11 1.83 8 1.33Njari Is. 30 4 0.67 2 0.33 6 1.00Munda Reef 31 6 1.00Haipe Reef 32 3 0.5 5 0.83 2 0.33Veru pt. 33 2 0.33Landoro 34 1 0.17 4 0.67 10 1.67 12 2.00Lumalihe 35 1 0.17 6 1 2 0.33 0.33 124 20.67 1 0.17Toatelava Is. 36 1 0.17 13 2.17 2 0.33 1 0.17 25 4.17Mbili Passage 37 1 0.17 5 0.83 7 1.17 1 0.17Lisamata Is. 38 1 0.17 3 0.5 1 0.17 1 0.17395
<strong>Solomon</strong> <strong>Islands</strong> <strong>Marine</strong> <strong>Assessment</strong> Technical ReportMbutata Is. 39 6 1.00Honga Point 40 2 0.33 1 0.17Nikatu passage 41 1 0.17Honoa Is. 42 1 0.17 1 0.17 1 0.17Wainipareo reef 43 2 0.33 2 0.33 4 0.67Haurimanu reef 44 4 0.67 1 0.17Marautewa Is. 45 2 0.33 7 1.17 1 0.17 19 3.17Naone Is. 46 3 0.50Namuga 47 1 0.17Three Sisters I 48 3 0.5 2 0.33Three Sisters II 49 1 0.17Pio Is. 50 10 1.67 1 0.17 2 0.33Pawa Bay 51 1 0.17 1 0.17 1 0.17Airasi 52 2 0.33 14 2.33 26 4.33Komunihaka reef 53 1 0.17 2 0.33Arai peninsula 54 1 0.17 4 0.67 1 0.17Anuta Is. 55 5 0.83 1 0.17Leili Is. I 56 2 0.33 4 0.67Leili Is. II 57Toi Reef 58 2 0.33Suafa Bay 59 3 0.5 5 0.83 3 0.5Falabulu Is. I 60 1 0.17 5 0.83 4 0.67Falabulu Is. II 61 1 0.17 5 0.83Nuhu Is. 62Gavutu Is. 63 1 0.17 4 0.67 51 8.50 2 0.33Savo Is. 64 1 0.17 1 0.17 2 0.33 1 0.17Tambea 65 1 0.17 2 0.33 1 0.17 2 0.33 1 0.17Bonegi 66TOTAL 12 17 95 115 60 4 39 41 543 12OVERALL AVERAGE 0.18 0.03 0.26 0.04 1.44 0.24 174 0.29 0.92 0.15 0.06 0.01 0.59 0.09 0.62 0.11 8.23 1.37 0.18 0.03NON-ZERO AVERAGE 1.33 0.22 2.43 0.41 2.16 0.36 3.29 0.55 3.81 0.63 2.00 0.33 1.63 0.26 10.25 1.79 16.45 2.74 1.20 0.20396
Fisheries Resources: Commercially Important MacroinvertebratesAppendix 6: Survey data for bivalves in the deep habitats. n are numbers found in all transects. mare mean numbers per transect (250m 2 ).SPECIESSITES No. P. margaritifera Pteria penquin T. squamosan m n m n mTulagi Is. 1Kombuana Is. 2Buala Reef 3Tirahi Is. 4Tanabafe Is. 5Babao pt. 6Sarao Is. 7Palunuhukura bay. 8Matavaghi Is. 9Rapita Is. 10Kale Is. 11Wakao Is. 12Sibau Is. 13Malakobi Is. 14Tuma Is. 15Kerehikapa Is. 16Raverave Is. 17Ondolou Is. 18Boeboe 19Poro Is. 20Taro Is. 21Putuputuru Is. 22Sirovanga 23Vurango 24Rohae reef 25Rohae Is. 26 2 0.40Onua Is. 27Faisi Is. 28Leona Reef 29 1 0.20 1 0.20Njari Is. 30Munda Reef 31Haipe Reef 32Veru pt. 33Landoro 34Lumalihe 35Toatelava Is. 36 2 0.40Mbili Passage 37 10 2.0Lisamata Is. 38Mbutata Is. 39Honga Point 40Nikatu passage 41 1 0.20Honoa Is. 42Wainipareo reef 43397
<strong>Solomon</strong> <strong>Islands</strong> <strong>Marine</strong> <strong>Assessment</strong> Technical ReportHaurimanu reef 44Marautewa Is. 45Naone Is. 46 1 0.20Namuga 47Three Sisters I 48Three Sisters II 49Pio Is. 50Pawa Bay 51 1 0.20Airasi 52 23 4.60Komunihaka reef 53Arai peninsula 54Anuta Is. 55Leili Is. I 56Leili Is. II 57 1 0.20 1 0.20Toi Reef 58 2 0.40Suafa Bay 59Falabulu Is. I 60Falabulu Is. II 61 1 0.20Nuhu Is. 62Gavutu Is. 63Savo Is. 64 1 0.20Tambea 65Bonegi 66TOTAL 4 40 4OVERALLAVERAGENON-ZEROAVERAGE0.06 0.01 0.63 0.10 0.06 0.011.30 0.27 5.00 0.80 1.30 0.27398
Fisheries Resources: Commercially Important MacroinvertebratesAppendix 7: Survey data for gastropods in the shallow habitat. n are numbers found in all transects. m are meannumbers per Transect (100m 2 )SPECIESTrochus niloticus Tectus pyramisTrochusmaculatusCharonia tritonisSITES No. n m n m n m n mTulagi Is. (1) 1 1 0.17Kombuana Is.(2) 2 3 0.50Buala Reef (3) 3 2 0.33Tirahi Is. (4) 4Tanabafe Is. (5) 5 1 0.17 4 0.67Babao pt. (6) 6Sarao Is. (7) 7 1 0.17Palunuhukura bay. (8) 8Matavaghi Is. (9) 9Rapita Is. (10) 10Kale Is. (11) 11Wakao Is. (12) 12Sibau Is. (13) 13Malakobi Is. (14) 14 1 0.17Tuma Is. (15) 15 5 0.83 5 0.83Kerehikapa Is. (16) 16 3 0.50Raverave Is. (17) 17Ondolou Is. (18) 18Boeboe (19) 19Poro Is. (20) 20Taro Is. (21) 21 2 0.33 2 0.33Putuputuru Is. (22) 22Sirovanga (23) 23 2 0.33Vurango (24) 24 2 0.33Rohae reef (25) 25 1 0.17 3 0.50Rohae Is. (26) 26Onua Is. (27) 27 3 0.50 8 1.33Faisi Is. (28) 28Leona Reef (29) 29 4 0.67Njari Is. (30) 30Munda Reef (31) 31Haipe Reef (32) 32 5 0.83Veru pt. (33) 33Landoro (34) 34Lumalihe (35) 35 1 0.17 1 0.17Toatelava Is. (36) 36Mbili Passage (37) 37Lisamata Is. (38) 38 1 0.17Mbutata Is. (39) 39Honga Point (40) 40Nikatu passage (41) 41 1 0.17 1 0.17399
<strong>Solomon</strong> <strong>Islands</strong> <strong>Marine</strong> <strong>Assessment</strong> Technical ReportHonoa Is. (42) 42 4 0.67 9 1.50Wainipareo reef (43) 43 1 0.17Haurimanu reef (44) 44 2 0.33 6 1.00Marautewa Is. (45) 45Naone Is. (46) 46 2 0.33 4 0.67 1 0.17Namuga (47) 47 1 0.17Three Sisters I (48) 48 2 0.33 2 0.33Three Sisters II (49) 49Pio Is. (50) 50Pawa Bay (51) 51 1 0.17Airasi (52) 52Komunihaka reef (53) 53 1 0.17 6 1.00Arai peninsula (54) 54Anuta Is. (55) 55 1 0.17Leili Is. I (56) 56Leili Is. II (57) 57 1 0.17Toi Reef (58) 58 11 1.83 8 1.33Suafa Bay (59) 59 2 0.33 2 0.33Falabulu Is. I (60) 60 1 0.17 1 0.17Falabulu Is. II (61) 61Nuhu Is. (62) 62 1 0.17Gavutu Is. (63) 63Savo Is. (64) 64 6 1.00Tambea (65) 65 2 0.33 3 0.50Bonegi (66) 66 2 0.33TOTAL 38 91 16 1OVERALL AVERAGE 0.58 0.10 1.38 0.23 0.24 0.04 0.02 0.00NON-ZERO AVERAGE 2.92 0.49 3.37 0.56 1.45 0.24 1.00 0.17400
June 2006TNC Pacifi c Island CountriesReport No 1/06<strong>Solomon</strong> <strong>Islands</strong>GovernmentChapter 7Seagrasses& Mangroves<strong>Solomon</strong> <strong>Islands</strong> <strong>Marine</strong> <strong>Assessment</strong>Len McKenzie 1 , Stuart Campbell 2 & Ferral Lasi 31CRC Reef/Department Primary Industries & Fisheries2Wildlife Conservation Society3The Nature Conservancy401
Published by: The Nature Conservancy, Indo-Pacific Resource CentreAuthor Contact Details:Len McKenzie: CRC Reef/Department Primary Industries & Fisheries, Northern FisheriesCentre, PO Box 5396, Cairns Qld, 4870, AustraliaTel.: +61 7 4035 0131; fax: +61 7 4035 4664.E-mail address: Len.McKenzie@dpi.qld.gov.auSuggested Citation:McKenzie, L., S. Campbell and F. Lasi. 2006. Seagrasses and Mangroves. In: Green, A., P.Lokani, W. Atu, P. Ramohia, P. Thomas and J. Almany (eds). 2006. <strong>Solomon</strong> <strong>Islands</strong> <strong>Marine</strong><strong>Assessment</strong>: Technical report of survey conducted May 13 to June 17, 2004. TNC PacificIsland Countries Report No 1/06.© 2006, The Nature ConservancyAll Rights Reserved.Reproduction for any purpose is prohibited without prior permission.Design: Jeanine AlmanyArtwork: Nuovo DesignMaps: Stuart Sheppard & Jeanine AlmanyCover Photo: © David Wachenfeld, Triggerfish ImagesAvailable from:Indo-Pacific Resource CentreThe Nature Conservancy51 Edmondstone StreetSouth Brisbane, QLD 4101AustraliaOr via the worldwide web at: www.conserveonline.org402
Seagrasses and MangrovesContentsintroduction & Background ...................................................................................................... 405Seagrass Meadows ....................................................................................................................................405Mangroves ................................................................................................................................................. 406Seagrasses of the <strong>Solomon</strong> <strong>Islands</strong>...................................................................................................... 407Mangroves of the <strong>Solomon</strong> <strong>Islands</strong> .................................................................................................... 408Methodology........................................................................................................................................409Survey Strategy ......................................................................................................................................... 409Data Collection........................................................................................................................................ 409Geographic Information Systems (GIS)............................................................................................411The Biogeography of the <strong>Solomon</strong> Archipelago Seagrasses .....................................412Malaita Province........................................................................................................................................415Choiseul Province..................................................................................................................................... 418Isabel Province......................................................................................................................................... 420Western Province.....................................................................................................................................424Central Province.......................................................................................................................................428Guadalcanal Province ...............................................................................................................................431Makira Province........................................................................................................................................ 432Discussion ................................................................................................................................................436Seagrass........................................................................................................................................................ 436Mangroves .................................................................................................................................................. 438Threats ......................................................................................................................................................439Recommended Actions.....................................................................................................................440Acknowledgements............................................................................................................................440References ................................................................................................................................................441403
<strong>Solomon</strong> <strong>Islands</strong> <strong>Marine</strong> <strong>Assessment</strong> Technical ReportExecutive Summary• This is the first extensive survey of seagrass resources in the <strong>Solomon</strong> <strong>Islands</strong>.• 10 species of seagrass were identified in the <strong>Solomon</strong> <strong>Islands</strong>. The survey involvedexamination of 1,426 sites and identified 486 individual meadows.• 6,633 ±1,446 hectares (ha) of predominately intertidal and shallow subtidal seagrassmeadows were mapped in the <strong>Solomon</strong> <strong>Islands</strong> between 13 May and 16 June 2004.• 54% of all seagrass meadows (per hectare basis) were found in Malaita Province. Allother provinces each included less than 12% of the seagrass meadows.• Most <strong>Solomon</strong> <strong>Islands</strong> seagrasses were found in water less than 10m deep andmeadows were monospecific or consisted of multispecies communities, with up to 6species present at a single location.• The dominant species encountered were Enhalus acoroides and Thalassia hemprichii.• Seagrass distribution appears to be primarily influenced by the degree of wave action(exposure) and nutrient availability.• <strong>Solomon</strong> <strong>Islands</strong>’ seagrass habitats can be generally categorised into four broadhabitats: estuaries (incl. large shallow lagoons), coastal (incl. fringing reef), deep-waterand reef (e.g., barrier or isolated)• Seagrass meadows in the region as a whole are in relatively healthy conditioncompared to many other regions globally.• Coastal fringing mangrove communities appear to be generally intact, with onlylocalised impacts.• High sedimentation/turbidity in coastal waters, primarily the result of logging activities,was identified as a major threat at some locations.• Other impacts were similarly localised, and included soil erosion related to coastalagriculture (coconut plantations), sewage discharge (human and agriculture), industrialpollution, port/village infrastructure/dwellings and overfishing. Most of these impactscan be managed with appropriate environmental guidelines.• Future recommendations include: establishing more protected areas, promotingseagrass and mangrove conservation through development of education resourcematerials, and establishing a Pacific Island monitoring program of seagrass andmangrove ecosystem health.404
Seagrasses and MangrovesIntroduction & BackgroundThe primary goal of the survey was to provide a comprehensive inventory of seagrass speciesand to map their distribution in the <strong>Solomon</strong> <strong>Islands</strong>.The <strong>Solomon</strong> <strong>Islands</strong> is the third largest archipelago in the South Pacific, comprising a total of992 islands, scattered in a chain in a south-easterly direction from PNG (Figure 1). The bulk ofthe land area comprises seven large volcanic islands, which form a double chain running fromnorthwest to southwest and converging on the island of Makira. The Santa Cruz <strong>Islands</strong>(Temotu Province) are a second group of three larger volcanic islands lying to the east, andseparated from the main archipelago of the country by the 6000m deep Torres Trench. Thesehowever are outside the boundaries of the scope of the assessment and are not included in thisreport.The coastal marine ecosystem of the <strong>Solomon</strong> <strong>Islands</strong> includes wide areas still largelyunimpacted by human activities, although there are also areas where such pressures areincreasing. The islands have one of the fastest population growth rates in the world, and 86percent of the people are rural. Dependence on coastal marine ecosystems for protein remainshigh and subsistence fishing is widespread.Figure 1. Map of the <strong>Solomon</strong> <strong>Islands</strong> <strong>Marine</strong> <strong>Assessment</strong> survey route.SEAGRASS MEADOWSSeagrass meadows are a significant coastal habitat of the <strong>Solomon</strong> <strong>Islands</strong>. Seagrasses are afunctional grouping referring to vascular flowering plants, which grow fully submerged androoted in soft bottom estuarine and marine environments. In the <strong>Solomon</strong> <strong>Islands</strong>, they arefound in habitats extending from the intertidal to subtidal, along mangrove coastlines, estuaries,shallow embayments, as well as coral-reef, inter-reef and offshore island situations.405
<strong>Solomon</strong> <strong>Islands</strong> <strong>Marine</strong> <strong>Assessment</strong> Technical ReportSeagrasses rank as one of the major marine ecosystems on world terms. In the last few decades,seagrass meadows have received greater attention with the recognition of their importance instabilising coastal sediments, providing food and shelter for diverse organisms, as a nurseryground for fish and invertebrates of commercial and artisanal fisheries importance, as carbondioxide sinks and oxygen producers, and for nutrient trapping and recycling. Seagrass are ratedthe 3rd most valuable ecosystem globally (on a per hectare basis) and the average global valuefor their nutrient cycling services and the raw product they provide has been estimated at1994 US$19,004 ha -1 yr -1 (Costanza et al. 1997). This value would be significantly greater if thehabitat/refugia and food production services of seagrasses were included.Seagrasses are also food for the endangered green sea turtle (Chelonia mydas) and dugong(Dugong dugon) (Lanyon et al. 1989), which are found throughout the <strong>Solomon</strong> <strong>Islands</strong>, andused by traditional communities for food and ceremonial use. Tropical seagrasses are alsoimportant in their interactions with mangroves and coral reefs. All these systems exert astabilizing effect on the environment, resulting in important physical and biological support forthe other communities. Seagrasses slow water movement, causing suspended sediment to fallout, and thereby benefiting corals by reducing sediment loads in the water.MANGROVESMangroves are a taxonomically diverse group of predominantly tropical shrubs and treesgrowing in the intertidal zone between Mean Sea Level (MSL) and Highest Astronomical Tide(HAT) bordering the banks of estuaries and foreshores along protected parts of the coastline(Duke 1992).Areas of deposition of mud and silt at the mouths of rivers and creeks and in the lee of largeroffshore islands protected from strong wave action support the most extensive mangrovecommunities (Dowling and McDonald 1982). Mangroves can tolerate a wide range of sedimenttypes, water temperatures, flow rates, salinity, nutrient and oxygen levels. Mangroves vary intheir tolerance of these environmental factors, and a pattern of species zonation occurs(Lovelock 1993).Mangroves form complex systems in coastal waters providing physical, biological andecosystem functions which include:• Habitat, shelter and structural complexity for resident and transient birds, fish,crustaceans and reptiles. Many prawns and fish that inhabit mangroves are ofcommercial and recreational importance or important to traditional fishingcommunities (Rönnbäck 1999);• Providing a major marine source of carbon for complex food webs through directgrazing or through detrital pathways (Clough 1992);• Assisting in the stabilisation of coastlines, assimilating wastes, mitigating flood waterby controlling the outflow, buffering pollution and storms and reclaiming land (i.e.helping in the formation of islands and the extension of shorelines);• Providing for human uses, including recreational (fishing and boating) and indigenoususes (food, medicine, weapons and other tools).Mangrove roots, debris, and other vegetation structures provide structural complexity inintertidal habitat. The structural complexity that mangrove roots and debris form are oftenreferred to as “snags”, and enhances the refuge aspect of the marine environment. Mangrovesprovide a sub-surface shelter by trapping soft muds suitable for burrowing (Rönnbäck 1999).Mangroves also have the hydrodynamic ability to retain immigrating fish, crustacean andmollusc larvae and juveniles. Spatio-temporal variations in the availability of food and shelter,406
Seagrasses and Mangrovesand retention capacity, affect the quality of individual mangrove microhabitats for fish andshellfish (Rönnbäck 1999).The presence of wetland vegetation improves water quality of estuaries and near-shore watersthrough nutrient storage in plant tissues and their regulated release into the surrounding water,and also by removal of water-borne contaminants (e.g. heavy metals and pesticides) andsuspended sediments. Extensive tidal wetlands also stabilise channel banks and protectshorelines from erosion and store and dissipate the energy of floodwaters.A study from a mangrove forest in north-eastern Australia has found that mangrove primaryproductivity and associated leaf litterfall can be substantial (Clough 1992). The annual litterfallhas been estimated at 8-10t dry weight per ha, with a maximum of up to 20t dry weight perhectare (Clough 1992). The mangrove crab can consume or store 30-80% of this litterfall(Robertson et al. 1992). These crabs are subsequently consumed by fishes and thereforeconstitute an important link at the primary consumer level in food webs, beginning withmangrove plant production and leading to higher level consumers harvested by humans.Mangrove communities have long been recognised for their value to fisheries production.Mangrove habitat (particularly Rhizophora stylosa) is important as a feeding and nursery areafor fish species that contribute to fisheries values (Halliday and Young 1996). Fishes inhabitingtropical mangroves (eg sardines and herring) eat plankton and small bottom-dwelling prey andsupport fisheries indirectly by providing a food source for larger pelagic species (eg mackerel,tuna, trevally and sharks) that may not use the forest directly (Halliday and Young 1996).The economic value of natural products and ecosystem services generated by mangrove forestsis generally underestimated (Saenger et al. 1983). As a consequence mangrove ecosystemshave become prime candidates for conversion into large-scale development activities such asagriculture, aquaculture, forestry, salt extraction and infrastructure. More than 50% of theworld’s mangroves have been removed (World Resources Institute 1996).It has been estimated that the total value to ecosystem services per hectare of mangroves is1994 US$9990, with a large portion of this value from waste treatment, food production, andrecreation provision (Costanza et al. 1997). The value of ecosystem goods (such as food) andservices (such as waste assimilation) represent the benefits human populations derive, directlyor indirectly, from ecosystem functions.Mangroves form an interface between terrestrial and marine environments. Harmful land useand marine activities can threaten mangrove distribution and abundance. Potential threats tomangrove populations include: natural sources (pathogens, violent storms, fluctuations inrainfall and climatic patterns); land uses (habitat modifications, excess nutrients, toxic chemicalleachate, pesticides, herbicides, algicides and insecticides); or marine activities (oil and othercontaminant spills) (Duke et al. 2005).Small-scale modifications to the physical structure of mangrove forests can lead to significanteffects on the diversity and abundance of macro benthic organisms in mangrove habitats(Skilleter and Warren 2000). Such modifications have the potential to cause cascading effects athigher trophic levels with deterioration in the value of these habitats as nursery and feedinggrounds (Skilleter and Warren 2000).SEAGRASSES OF THE SOLOMON ISLANDSThere is some confusion regarding the number of seagrass species in the <strong>Solomon</strong> <strong>Islands</strong>, dueto the lack of any comprehensive surveys. Green & Short (2003) list 3 species, howeverJohnstone (1982) and Womersley & Baily (1969) suggested there could be at least 7. Reviews407
<strong>Solomon</strong> <strong>Islands</strong> <strong>Marine</strong> <strong>Assessment</strong> Technical Reportby Coles and Kuo (1995) and Coles & Lee Long (1999) failed to locate any validated recordsfrom herbarium collections or available scientific literature on the seagrasses of the <strong>Solomon</strong><strong>Islands</strong>. Nevertheless, Coles and Lee Long (1999) predicted between 5 and 10 species mayoccur in the <strong>Solomon</strong> <strong>Islands</strong> based on a probability model of species diversity across thePacific; high in the west and declining towards the east.The total area of seagrass meadows in the <strong>Solomon</strong> <strong>Islands</strong> is also unknown, as no broad scalemapping exercises have been conducted (Coles et al. 2003). This is because mapping in tropicalsystems is generally from field observations, since remotely sensed data (satellite and aerialimagery) is generally ineffective for detecting tropical seagrasses of low biomass and/or inturbid water (McKenzie et al. 2001). Some estimation could be possible using a simplemodelling approach, based on the high likelihood that between 4% and 5% of almost allshallow water areas of reef and continental slope within the depth range of most seagrasses(less than 10 metres below MSL) would have at least a sparse seagrass cover. This however,has not been attempted. The closest attempt so far is a new dataset prepared by the UnitedNations Environment Programme World Conservation Monitoring Centre (http://stort.unepwcmc.org/maps).These maps however should be interpreted with caution as they have beenmigrated to GIS based on literature review and outreach to expert knowledge. Much of theinformation is from only a few localities and is generally historic.MANGROVES OF THE SOLOMON ISLANDSThe area of mangroves in the Pacific <strong>Islands</strong> is estimated at 343,735ha, approximately 2.4percent of the worlds mangroves (Ellison 1999). 20 species and 2 hybrids of mangrove havebeen reported in the <strong>Solomon</strong> <strong>Islands</strong> (Ellison 1995). They include: Heritiera littoralis,Aegiceras corniculatum, Sonneratia alba, S caseolaris, S x gulngai, Osbornia octodonata,Lumnitsera littorea, Rhizophora apiculata, R stylosa, R x lamarckii, R mucronata, Bruguieragymnorrhiza, B parviflora, B sexangula, Ceriops tagal, Excoecaria agallocha, Xylocarpusgranatum, X mekongensis, Avicennia alba, A marina, Scyphiphora hydrophyllacea and Nypafruticans (from Ellison 1995, Spalding et al. 1997). These mangroves are of the Indo-Malayanassemblage. The greatest diversity of mangroves is found in northern Australia and southernPNG, and decline in diversity from west to east across the Pacific, reaching a limit at AmericanSamoa. The <strong>Solomon</strong> <strong>Islands</strong> is the eastern limit for some mangrove species. 4 species do notextend beyond the <strong>Solomon</strong> <strong>Islands</strong> to the rest of the Pacific <strong>Islands</strong>, and 8 other species do notextend past the Solommon, Vanuato and New Caledonia island groups (Ellison 1999).Larger areas of mangrove are limited in the <strong>Solomon</strong> <strong>Islands</strong> due to the lack of suitableintertidal habitat. In the <strong>Solomon</strong> <strong>Islands</strong>, Hansell & Wall (1976) mapped 642km 2 (64,200 ha)of mangroves from air photographs, which constitutes 2.6 percent of the total forest area. Thelargest area (208km 2 on Isabel, followed by Rennell & Shortland (137km 2 ), Malaita (124km 2 )and New Georgia (97km 2 ). This area has been reduced by clearance for subsistence agricultureand commercial logging (Scott 1993).In the <strong>Solomon</strong> <strong>Islands</strong>, mangroves are protected under the Forest Resources and Timber Act(Kwanairara 1992). However, although legislation exists to control the use of mangroves, is notalways exercised (Spalding et al. 1997). Mangroves are exploited for firewood, and areas aredegraded by siltation or lost to landfill and settlements.Mangrove areas in the Pacific <strong>Islands</strong> are traditionally used for fishing and gathering of clamsand crabs, wood for construction and handicrafts, and for fuelwood. Tannins from theRhizophoraceae are also used for protection of nets and fish traps owing to their fungicidalproperties. The prop roots of Rhizophora are frequently used for the construction of fish traps,fuelwood or light construction. A brown dye is obtained from the bark.408
Seagrasses and MangrovesScientific information about mangroves in the Pacific <strong>Islands</strong> tends to be generally poor and notwell documented, though the local knowledge in some locations is very detailed. Studies in the<strong>Solomon</strong> <strong>Islands</strong> have shown significant fish stocks in association with mangroves. There is anendemic subspecies of the mangrove monitor Varanus indicus spinulosus with very limiteddistribution and populations of the saltwater crocodile Crocodylus porosus are threatened in the<strong>Solomon</strong> <strong>Islands</strong> (Messel & King 1989)MethodologySURVEY STRATEGYThe survey focused on the main island group of the <strong>Solomon</strong> <strong>Islands</strong>, stretching from ChoiseulIsland in the northwest to Makira in the southeast (Figure 1). While a comprehensive survey ofthe entire <strong>Solomon</strong> <strong>Islands</strong> archipelago, including the outer islands, would be desirable, it wasbeyond the scope of this assessment. Similarly, due to the size of the SI coastline (over 6000km), locations were selected for detailed assessment based on the probability of significantseagrass communities, logistic constraints and with the guidance of the <strong>Solomon</strong> <strong>Islands</strong><strong>Marine</strong> <strong>Assessment</strong> Coordinating Committee(SIMACC) (see Conservation Context, thisreport). These areas included representative examples of marine habitats of interest and specialand unique areas.The survey was conducted from 13 May to 16 June 2004, and primarily focused on toproviding detailed information (distribution & abundance) on high priority intertidal andshallow subtidal seagrass ecosystems in the regions. Where possible, similar observations weremade for mangrove forests.Within each location, field sites were chosen for examination (ground truthing) to ensure allsuitable/possible seagrass habitats were assessed. Intertidal and sub-tidal areas were surveyedusing boats and divers. This was done with points and transects approximately 100-500 mapart. Benthos was examined at sites along transects (sites every 1 m depth contour), whichextended from the upper intertidal to depths beyond the outer edge of seagrass meadows(usually 5-6m). Points (sites) between transects were also dived to check for continuity ofhabitat types. Some locations were surveyed at a lower intensity, with sites >500 m apart, butsufficient to map and describe the major seagrass habitats.Fringing mangroves were examined at coastal sites, and generally incorporated a 10m sectionof frontage to a visual depth of approximately 20m inland (depending on type of mangrovecommunity).DATA COLLECTIONSeagrass habitat characteristics including visual estimates of above-ground biomass/percentagecover (3 replicates of a 0.25 m 2 quadrat), species composition, % algae cover, sediment type,water depth and geographic location were recorded at each site. A Global Positioning System(GPS) was used to accurately determine geographic location of sampling sites (±5 m). Seagrassspecies were identified where possible according to Waycott et al. (2004) and voucherspecimens were collected for taxonomic verification. Depths of survey sites were recordedwith an echo-sounder and field descriptions of sediment type from hand or grab samples wererecorded for each site: shell grit, rock gravel, coarse sand, sand, fine sand and mud.409
<strong>Solomon</strong> <strong>Islands</strong> <strong>Marine</strong> <strong>Assessment</strong> Technical ReportAbove-ground biomass was determined by a “visual estimates of biomass” technique modifiedfrom Mellors (1991). At each intertidal and shallow sub-tidal site, observers recorded anestimated rank of seagrass biomass and species composition in three replicates of a 0.25 m 2quadrat per site. To ensure standardisation over the survey period, a standard set ofphotographs was used as a guide. On completion of the survey (conducted back in Australia),each observer ranked ten quadrats that were harvested and the above-ground dry biomass (gDW. m -2 ) measured. The regression curve representing the calibration of each observer’s rankswas used to calculate above-ground biomass from all their estimated ranks during the survey.Observers had significant linear regressions (r 2 >0.9) when calibrating above-ground biomassestimates against a set of harvested quadrats.Seagrass community types were determined by dominant seagrass species found within eachmeadow (Table 1) and their landscape structure (Figure 2). Seagrass habitat types weredetermined by species composition and physical attributes (ie intertidal or subtidal, coastal orfringing reef) influencing each seagrass community.Table 1. Nomenclature for community types in the <strong>Solomon</strong> <strong>Islands</strong>.Community typeSpecies ASpecies A with Species BSpecies A with Species B/Species CSpecies A/Species BSpecies compositionSpecies A is 100% of compositionSpecies A is 60% of compositionSpecies A is 50% of compositionSpecies A is 50% - 60% of compositionIsolated seagrass patches - The majority of area withinthe meadows consisted of unvegetated sedimentinterspersed with isolated patches of seagrass.Aggregated seagrass patches - Meadows are comprisedof numerous seagrass patches but still featured substantialgaps of unvegetated sediment within the meadowboundaries.Continuous seagrass cover - The majority of area withinthe meadows was comprised of continuous seagrass coverinterspersed with a few gaps of unvegetated sediment.Figure 2. Seagrass meadow patchiness categories used in the seagrass survey.410
Seagrasses and MangrovesAt each of the locations visited, mangrove species and riparian vegetation were also assessed.<strong>Assessment</strong>s only included the immediate (seaward) mangrove fringe, and did not continue upstreaminto brackish/freshwaters. All mangroves at each site were identified to species level inthe field according to Lovelock (1993). Other riparian vegetation was identified as far aspossible in the field. Where positive field identifications could not be made, voucher specimensof species were collected to confirm field identifications.GEOGRAPHIC INFORMATION SYSTEMS (GIS)A GIS of seagrass community distribution was created in MapInfo and ArcMap using theabove survey information. A CD Rom copy of the GIS with metadata has been archived atTNC Brisbane offices and the original archived with the custodians (QDPI&F) at the NorthernFisheries Centre, Cairns.Errors in GIS maps include those associated with digitising and rectifying basemaps and withGlobal Positioning System (GPS) fixes for survey sites. The point at which divers estimatedbottom vegetation may be up to 5 m from the point at which a GPS fix was obtained. Theseerrors are considered to be within the errors associated with distance between survey sites.In the survey, each seagrass meadow was assigned a qualitative mapping value, determined bythe data sources and likely accuracy of mapping. Boundaries of seagrass habitat wereinterpreted using one or more of the following: seagrass data at each dive site, extent of habitatvisible from the vessel, satellite imagery and bathymetry. Boundaries of meadows in intertidaldepths were usually mapped with greatest reliability (identified from surface observations, fromdive sites usually less than 100 m apart). Boundaries in sub-tidal depths were mapped with lessreliability because of a) very gradual changes in habitat and b) poor underwater visibility.Where the depth of outer boundaries were established, bathymetry was used to help outline themeadow boundary between survey sites where possible. Estimates of reliability in mappingmeadow boundaries ranged from 7.5 m to 500 m.411
<strong>Solomon</strong> <strong>Islands</strong> <strong>Marine</strong> <strong>Assessment</strong> Technical ReportThe Biogeography of the <strong>Solomon</strong> Archipelago SeagrassesTen seagrass species were recorded/collected during the <strong>Solomon</strong> <strong>Islands</strong> Rapid Ecological<strong>Assessment</strong> (SIREA), from 13 May to 16 June 2004. They included:Family CYMODOCEACEAE TaylorCymodocea rotundata Ehrenb. & Hemp. Ex AschersCymodocea serrulata (R. Br.) Aschers. & MagnusHalodule uninervis (wide- & narrow-leaf) (Forsk.) Aschers.Syringodium isoetifolium (Aschers.) DandyThalassodendron ciliatum (Forsk.) den Hartog †Family HYDROCHARITACEAE JussieuEnhalus acoroides (L. ƒ) RoyleHalophila decipiens OstenfeldHalophila minor (Zollinger) den HartogHalophila ovalis (R. Br.) Hook f.Thalassia hemprichii (Ehrennb.) Aschers in PetermannApproximately 6,633 ±1,446 hectares (ha) of predominately intertidal and shallow subtidalseagrass meadows were mapped in the <strong>Solomon</strong> <strong>Islands</strong> between 13 May to 16 June 2004. 485individual meadows were identified and mapped from 1,428 ground truthed sites. Aconservative estimate of the total area of seagrass meadows in the <strong>Solomon</strong> <strong>Islands</strong> would be~10,000 ha, taking into account locations which could not be visited during the survey whichpossibly have seagrass present. In interpreting the maps and seagrass distribution it is essentialto note that not all coastal areas were surveyed. The seagrass distribution mapped for this report† Thalassodendron ciliatum has also been reported from East Rennell & Southern Malaita (WCMC,Seagrass Atlas Appendix 1.)412
Seagrasses and Mangrovesis for intertidal and shallow subtidal seagrasses in the provinces of Choiseul, Western, Isabel,Malaita, Central, Makira and Guadalcanal (Figure 3).Figure 3. The provinces of the <strong>Solomon</strong> <strong>Islands</strong>.Meadows are predominately on fringing reef flats and mostly continuous (93% of all meadowarea) in landscape structure (Table 2). Meadows dominated by Thalassia hemprichii were themost common, comprising approximately 42% of area of all meadows encountered. The mostdominant single seagrass community (21%) was monospecific Enhalus acoroides meadows.Meadows of the greatest cover were dominated by Cymodocea spp.Table 2. Meadow categories, total area (hectares) and numbers of intertidal/shallow subtidal meadowsin <strong>Solomon</strong> <strong>Islands</strong> – May/June 2004.CATEGORYBiomass(g DW m -2 )Cover(%)IsolatedseagrasspatchesArea in hectares(number of meadows)AggregatedseagrasspatchesContinuousseagrass coverH. uninervis/T. hemprichii/C. rotundata 49.5 ±1.45 0.19 0.19H. minor 3.52 ±0.78 42.22 ±2.70 0.50 (4) 0.50E. acoroides with H. uninervis 26.67 ±6.67 0.87 (1) 0.87T. hemprichii/H. ovalis with E. acoroides 6.70 ±1.77 0.99 (1) 0.99C. serrulata with mixed species 1.79 ±1.79 83.84 1.07 (1) 1.07H. uninervis with H. ovalis 37.78 ±4.80 1.10 (3) 1.10H. decipiens 6 ±2.08 1.12 (1) 1.12C. rotundata 45.40 ±3.87 0.83 (2) 0.38 (3) 1.21H. ovalis with mixed species 2.68 ±0.67 41.78 ±4.25 0.19 (1) 1.10 (2) 0.15 (1) 1.45H. uninervis 2.01 ±1.16 1.98 (1) 1.98C. rotundata/ H. uninervis with mixed species 32.81 ±1.77 48 ±1.89 1.86 (2) 0.13 (1) 1.99C. rotundata with E. acoroides 74.33 ±12.21 2.43 (2) 2.43E. acoroides/H. ovalis 15.07 ±15.07 12 ±6.24 2.98 (1) 2.98T. ciliatum 0 3.72 (2) 3.72T. hemprichii with H. uninervis & mixed species 58 ±12.81 4.67 (2) 4.67H. minor with H. uninervis 24.17 ±2.63 5.12 (2) 5.12H. ovalis with E. acoroides 5.86 ±2.06 42.29 ±4.68 0.09 (1) 3.00 (1) 2.15 (3) 5.23T. ciliatum/C. rotundata with mixed species 5.36 (1) 5.36H. uninervis with E. acoroides & mixed species 2.34 ±0.39 33.83 ±6.61 0.97 (2) 4.41 (1) 5.38H. uninervis with H. ovalis & mixed species 0.36 ±0.36 24.75 ±6.57 5.54 (2) 5.54Total(ha)413
<strong>Solomon</strong> <strong>Islands</strong> <strong>Marine</strong> <strong>Assessment</strong> Technical ReportCATEGORYBiomass(g DW m -2 )Cover(%)IsolatedseagrasspatchesArea in hectares(number of meadows)AggregatedseagrasspatchesContinuousseagrass coverT. hemprichii with H. ovalis & mixed species 5.69 ±2.44 34.75 ±6.00 0.01 (1) 6.74 (2) 6.75T. hemprichii/E. acoroides with C. rotundata 71.11 6.79 (1) 6.79E. acoroides/Cymodocea spp with mixed species 50.73 ±8.90 0.29 (1) 6.75 (4) 7.04H. uninervis with Cymodocea spp/T. hemprichii & mixedTotal(ha)51.5 ±2.68 0.10 (1) 8.04 (1) 8.14speciesH. uninervis with T. hemprichii & mixed species 23.77 ±8.88 52.33 ±12.32 8.22 (6) 8.22S. isoetifolium with mixed species 111.82 ±5.95 65.00 ±10.63 0.25 (1) 8.69 (3) 8.94T. hemprichii with H. ovalis 16.54 ±7.31 68.61 ±5.40 1.61 (3) 1.49 (1) 8.25 (2) 11.35E. acoroides/H. uninervis with T. hemprichii 63.33 ±3.33 11.84 (1) 11.84E. acoroides with H. ovalis 0.39 ±0.39 36.36 ±4.77 0.56 (1) 5.85 (3) 7.89 (5) 14.30Cymodocea spp with T. hemprichii 14.59 (2) 14.59H. ovalis 2.72 ±1.52 44.24 ±2.24 0.64 (3) 10.61 (11) 3.87 (9) 15.12C. serrulata/S.isoetifolium with mixed species 128.56 85.72 ±5.53 15.80 (2) 15.80H. uninervis/H. ovalis 38.59 ±6.45 16.36 (3) 16.36T. hemprichii/C. rotundata with mixed species 112.49 ±1.16 57.50 ±9.34 16.73 (4) 16.73T. hemprichii with mixed species 42.21 ±8.19 19.31 (1) 19.31E. acoroides with Cymodocea spp & mixed species 20.53 ±20.53 50.56 ±8.02 19.95 (3) 19.95Cymodocea spp with E. acoroides & mixed species 77.27 ±4.72 2.81 (1) 21.27 (4) 24.08T. hemprichii/H. ovalis 4.35 ±0.91 42.33 ±3.18 0.35 (1) 25.09 (3) 25.43E. acoroides/T. hemprichii with mixed species 39.97 ±17.53 61.79 ±7.03 0.11 (1) 29.54 (5) 29.64C. rotundata with mixed species 27.99 ±7.00 54.99 ±6.42 1.30 (2) 0.46 (2) 32.12 (7) 33.88C. serrulata with E. acoroides & mixed species 79.00 ±5.84 0.28 (1) 36.14 (4) 36.43E. acoroides/T. hemprichii 56.48 ±7.59 0.001 (1) 39.11 (7) 39.11C. rotundata with T. hemprichii 75.2 ±6.56 46.08 (6) 46.08C. rotundata/T. hemprichii with mixed species 35.99 ±27.82 59.04 ±10.41 49.03 (10) 49.03C. rotundata with T. hemprichii & mixed species 50.00 ±21.55 58.97 ±6.29 1.73 (2) 2.22 (2) 46.53 (10) 50.47C. rotundata with E. acoroides & mixed species 81.28 ±7.10 51.57 (2) 51.57E. acoroides/S.isoetifolium/C. rotundata & mixed species 53.44 ±4.70 66.19 (1) 66.19C. rotundata/E. acoroides/T. hemprichii with mixed species 9.37 58.22 ±4.91 88.18 (1) 88.18T. ciliatum/T. hemprichii/C. rotundata with mixed species 50.60 90.75 (1) 90.75T. hemprichii with C. rotundata 25.62 ±18.71 51.44 ±5.45 1.10 (3) 1.94 (3) 90.64 (8) 93.69H. ovalis/T. hemprichii with E. acoroides 31.42 ±2.00 99.67 (1) 99.67T. hemprichii 12.26 ±3.23 37.08 ±3.30 1.40 (8) 37.16 (19) 64.58 (18) 103.14C. rotundata/T. hemprichii/H. uninervis with mixed species 51.15 ±2.33 136.42 (1) 136.42E. acoroides with T. hemprichii/H. ovalis 31.43 ±2.61 139.09 (3) 139.09E. acoroides with T. hemprichii/Cymodocea spp & mixed15.49 ±18.85 59.80 ±5.51 150.16 (7) 150.16speciesC. rotundata with E. acoroides/T. hemprichii 6.92 ±6.92 63.33 ±2.89 156.46 (3) 156.46C. rotundata/T. hemprichii 60.60 ±7.70 48.33 ±13.13 14.84 (2) 243.99 (4) 258.83T. hemprichii/E. acoroides 65.29 ±65.29 43.42 ±5.03 0.09 (1) 11.13 (2) 281.59 (3) 292.81E. acoroides with T. hemprichii 27.50 ±15.95 46.10 ±5.46 0.13 (1) 1.673 (3) 297.31 (18) 299.11T. hemprichii with C. rotundata & mixed species 38.61 ±16.16 48.26 ±5.58 347.83 (12) 347.83E. acoroides with T. hemprichii & mixed species 2.01 ±2.00 46.32 ±7.54 6.17 (1) 360.26 (5) 366.43T. hemprichii with E. acoroides & mixed species 20.57 ±14.47 67.19 ±8.54 3.63 (3) 399.95 (8) 403.58T. hemprichii/E. acoroides with S.isoetifolium 65.33 ±4.26 700.14 (1) 700.14T. hemprichii with E. acoroides 9.56 ±2.77 46.461 ±6.62 3.92 (4) 149.49 (3) 630.93 (10) 784.34E. acoroides 6.39 ±3.85 25.78 ±5.24 50.35 (51) 44.70 (35) 1322.07 (51) 1417.13Total 72.08 (85) 375.60 (112) 6186.13 (289) 6633.82Halophila decipiens was the rarest species in the <strong>Solomon</strong> <strong>Islands</strong>, being found at only one sitein Tambea, north western Guadalcanal. This however, may be an artefact of the samplingdesign, as the survey concentrated on areas down to 6m depth and Halophila decipiens isgenerally found in deeper waters. Other species that were also relatively rare inlcude:Thalassodendron ciliatum, being found only on the eastern coastline of Malaita; Halophilaminor, only found at six sites (incl. southern Choiseul, Florida <strong>Islands</strong>, and northernGuadacanal & Savo). Syringodium isoetifolium was absent from Central and Guadalcanalprovinces, and Cymodocea serrulata was mainly restricted to islands south of 8 degreeslatitude. The only location north that Cymodocea serrulata was found was on the fringing reefsbetween Chirovanga and Polo (NE Choiseul). All other species were widely distributedthroughout the <strong>Solomon</strong> <strong>Islands</strong>.Rhizophora stylosa, was the most common mangrove encountered and it had the widestdistribution in the survey area, occurring throughout the <strong>Solomon</strong> <strong>Islands</strong>. Where R. stylosaoccurred it also tended to be the dominant species.414
Seagrasses and MangrovesMALAITA PROVINCELong stretches of white-sand beaches line the shore of northern Malaita Island (Figure 4).3607.62 hectares of seagrass was mapped in 59 meadows in the province between 10 - 14 June2004. 99 percent of seagrass meadows in the province were of continuous cover (Table 3) andlocated on large intertidal reef/mud flats in protected bays, lagoon and on the leeward side ofvegetated islands. Most of the meadows (90%) identified were either Thalassia or Enhalusdominated communities (
<strong>Solomon</strong> <strong>Islands</strong> <strong>Marine</strong> <strong>Assessment</strong> Technical ReportExtensive intertidal and subtidal meadows were present in Lau Lagoon. The large shallow(~1.5m deep) lagoon stretched 3-5 km along the coast between Maana’oba Island and Malaita(Lau’alo Passage), on the north-eastern coast.The lagoon is up to 1 km wide and fringed by significant stands of mangroves (Rhizophorastylosa) on the mainland side. The landward edge was dominated by E. acoroides (meanquadrat cover = 34%) in mud sediments. Towards mid regions of the lagoon communities ofE. acoroides, Thalassia hemprichii, Cymodocea rotundata, Halophila ovalis dominated andwere interspersed with reef. Seagrass cover was generally more abundant (mean quadrat cover= 52%) in the mixed species meadows. The mid region represented the dominant communitytype, surviving in relatively sheltered waters and coarse sand and shell sediments. On theseaward edges of the island expansive Cymodocea rotundata, Thalassia hemprichii andHalophila ovalis were present inside the reef crest. The area possibly represents the largeststand of seagrass in the eastern <strong>Solomon</strong> <strong>Islands</strong>. Seagrass stretched north into a largeembayment and also continued southward through numerous sea-based communities inhabitingdwellings built on modified coral reefs.Along the north western part of the passage, meadows of Thalassia hemprichii/Enhalusacoroides with Syringodium isoetifolium were present on the large fringing reef flats adjacentto the main coastline. Thalassia hemprichii with Enhalus acoroides meadows and Thalassiahemprichii with Cymodocea rotundata & mixed species meadows surrounded Maana’obaIsland. The region is believed to be significant dugong and green turtle feeding grounds (BrunoManele, Ruben Sulu Pers comm.). Thalassodendron ciliatum was reported from Urasi Cove,Malaita (Johnstone 1982) near Fouia village, just south of Lau Lagoon. Also aggregatedpatches of Thalassodendron ciliatum were found in Suafa Bay on the western side of SuafaPoint on the edge of the fringing reef.Table 3. Meadow categories, total area (hectares) and numbers of intertidal/shallow subtidal meadowsin Malaita Province, <strong>Solomon</strong> <strong>Islands</strong> – June 2004.CATEGORYCover(%)IsolatedseagrasspatchesArea in hectares(number of meadows)AggregatedseagrasspatchesContinuousseagrasscoverC. rotundata/T. hemprichii with mixed species 86 ±12 0.1 (1) 0.1C. rotundata/T. hemprichii/H. uninervis with mixed species 51 ±2 136.42 (1) 136.42E. acoroides 17 ±3 0.19 (3) 21.11 (8) 1024.17 (12) 1045.47E. acoroides with T. hemprichii 40 ±3 68.89 (4) 68.89E. acoroides with T. hemprichii & mixed species 54 ±7 357.25 (2) 357.25E. acoroides with T. hemprichii/Cymodocea spp & mixedTotal(ha)47 ±5 4.81 (2) 4.81speciesE. acoroides with T. hemprichii/H. ovalis 38 ±2 2.14 (1) 2.14H. ovalis 39 ±5 0.18 (1) 0.18H. ovalis/T. hemprichii with E. acoroides 31 ±2 99.67 (1) 99.67T. hemprichii 50 ±5 1.33 (1) 10.06 (3) 11.39T. hemprichii with C. rotundata 39 ±3 22.77 (2) 22.77T. hemprichii with C. rotundata & mixed species 55 ±4 215.32 (3) 215.32T. hemprichii with E. acoroides 24 ±5 535.15 (4) 535.15T. hemprichii with H. uninervis & mixed species 58 ±12 3.71 (1) 3.71T. hemprichii with H. ovalis & mixed species 35 ±6 4.72 (1) 4.72T. hemprichii with mixed species 42 ±8 19.31 (1) 19.31T. hemprichii/E. acoroides 33 ±1 280.34 (2) 280.34T. hemprichii/E. acoroides with Syringodium isoetifolium 65 ±4 700.15 (1) 700.15T. ciliatum 3.72 (2) 3.72T. ciliatum/C. rotundata with mixed species 5.36 (1) 5.36T. ciliatum/T. hemprichii/C. rotundata with mixed species 51 ±0 90.75 (1) 90.75Total 0.37 (4) 26.16 (11) 3581.09 (44) 3607.62 (59)Aggregated patches of Enhalus acoroides line the edges of the mangroves of Auki Harbour, innorthern Langalanga Lagoon. Meadows were only 30-40m wide and were generally scatteredsouthward throughout the lagoon. Communities were very patchy with some sheltered Enhalusacoroides, Thalassia hemprichii and Halophila ovalis assemblages near the mangroves. Larger416
Seagrasses and Mangrovesmeadows of continuous and aggregated patches of Thalassia hemprichii with Enhalusacoroides were located on the reef flats of the Falabulu <strong>Islands</strong>. Only a few small aggregatedpatches of Enhalus acoroides were present in the Harbours of Bina and Arabala, south ofLangalanga Lagoon. No seagrasses were present on the seaward edges of Alite, Ba’ali andAulaga <strong>Islands</strong> due to exposure from oceanic swells.The lagoons immediately south and north of Wairokai Harbour were devoid of seagrass, andthere was no seagrass in the entrances from the ocean. Rocky shore platforms on the outer coastwere too exposed and did not appear to support seagrass growth. Mangroves (predominately R.stylosa) and coral reef fringe much of the lagoon except for areas where settlement occurs andnumerous mangrove islands occur throughout the lagoon.South of Wairokai Harbour, in the lagoon between Hokaiwai Island and the mainland, a patch(30mx60m) of Halophila ovalis was found in a small sheltered channel. Further south, patchyEnhalus acoroides meadows were located on the eastern lagoon side of Komusupa Islandextending its entire length to the oceanic entrance with Maroria island. No seagrass was foundon the mainland coast opposite Komusupa Island but patches of monospecific Enhalusacoroides were found on the mainland coast inside Maroria Island. Fringing reefs on MaroriaIsland (north and south) supported Thalassia hemprichii and Cymodocea rotundata meadowsalong the shoreward fringe extending about 50m seaward. The reef crest was situated about200-300m from shore providing sufficient protection for the largest seagrass meadow in theregion. At the entrance between Maroria and Uhu <strong>Islands</strong>, Thalassia hemprichii meadows werefound on the oceanic fringing reefs of Maroria Island but not on Uhu Island (too exposed androcky). Meadows of Enhalus acoroides on the lagoon side of Uhu Island ranged from isolatedpatches to continuous meadows and were also found as isolated patches on the mainland coastinside Uhu Island. A deep-water Halophila ovalis meadow was found at 22m on westernexposed side of Uhu island, outside the entrance of Maroria and Uhu island.On the mainland eastern coast of Malaita, very patchy Enhalus acoroides meadows (few plantsonly) were scattered around the edges of Kwai Harbour, fringing the mangroves. Largercontinuous Thalassia hemprichii meadows were located around Kwai Island, further south. Onthe mainland coast a large expanse (~500m wide) of seagrass in a lagoon on the landward sideof the reef crest dominated the area. Typically communities of seagrass (Thalassia hemprichii,Cymodocea rotundata, Enhalus acoroides, Halophila ovalis) were scattered across the coastline(~3-5km) with small islands and reefs interspersed among seagrass which dominate near thereef crest. In sheltered bays Enhalus acoroides grew adjacent to mangroves in mud sedimentsand interspersed with sheltered reefs. Also in areas along the open coast but sheltered by reefsmore than 500m from the coast are Enhalus acoroides meadows growing to 3m adjacent toblack sand beaches. The waters here were typically brownish in color, possibly tannins fromnearby coastal vegetation. Local men harvest coral for building materials. Numerous smalldwellings are built on coral reefs modified by additions of coral blocks.About 3 km off the Maliata east coast is horseshoe shaped Leli island. In the protected lagoonwere extensive Thalassia hemprichii, Cymodocea rotundata and Halophila ovalis meadowsgrowing in sand dominated sediments. On the outer side of the island were mangroves andcommunities of Thalassia hemprichii and Halophila ovalis on coarse sediments.Off southern Malaita is Maramasike Island. It is separated from Malaita Island proper by the20km long Maramasike Passage which in places is only 400m wide. Nietschmann et al. (2000)reported significant seagrass meadows in the region, but no further description is given.Although not ground truthed, northern Raroi Su’u Lagoon in the northern part of the passagewas visited during the survey. Seagrasses may be extensive in the area, as it is a calm, protectedwaterway fringed by mangroves. At the end of the Maramasike Passage was a number of smallmangrove fringed islands possibly surrounded by small (
<strong>Solomon</strong> <strong>Islands</strong> <strong>Marine</strong> <strong>Assessment</strong> Technical Reportacoroides meadows. The sheltered habitat of this embayment is suitable for Enhalus acoroidesand likely to be present. Mangroves also fringed the mainland coast on both sides of theembayment and scattered patchy Enhalus acoroides meadows may be present.Thalassodendron ciliatum, Halophila ovalis and Cymodocea rotundata were found near thecape of Arai Peninsula.On the south eastern coast of Maramasike Island are the Greenwich (Dolphin) <strong>Islands</strong>. Thisregion had high seagrass diversity and extensive seagrass meadows consisting of shelteredEnhalus acoroides habitat, lagoon communities of Thalassia hemprichii, Halophila ovalis,Cymodocea spp, Halodule uninervis and Thalassodendron ciliatum. A large, abundant andcontinuous Cymodocea rotundata/Thalassia hemprichii/Halodule uninervis with mixed speciesmeadow was located across the extensive reef flat adjacent to Tawaaro. Here the people huntdolphin, capturing up to 700 at one time (see Oceanic Cetaceans & Associated Habitats, thisreport). A population of about 20 dugong were reported to regularly feed in the area.CHOISEUL PROVINCEChoiseul Island is a long, narrow, densely wooded island, with a shoreline consisting of longnarrow beaches, some of which are bordered by large, shallow freshwater wetlands (Figure 5).753.93 hectares of seagrass was mapped in 49 meadows in the province between 21 – 24 May2004. Approximately 80 percent of seagrass meadows were dominated by Thalassiahemprichii, with Enhalus acoroides or other species present. 70 percent of seagrass meadows inthe province were of continuous cover (Table 4) and located on large intertidal fringing reefflats in protected bays, lagoons and on the leeward side of vegetated islands. Meadows locatedon the narrow fringing reefs adjacent to mangroves (predominately R. stylosa) werepredominately aggregated Enhalus communities (
Seagrasses and MangrovesTable 3. Meadow categories, total area (hectares) and numbers of intertidal/shallow subtidal meadowsin Choiseul Province, <strong>Solomon</strong> <strong>Islands</strong> – May 2004.CATEGORYBiomass(g DW m -2 )Cover(%)IsolatedseagrasspatchesArea in hectares(number of meadows)AggregatedseagrasspatchesContinuousseagrasscoverC. rotundata/H. uninervis with mixed species 69 ±4 1.7 (1) 1.7C. serrulata with E. acoroides & mixed species 90 ±6 17.41 (1) 17.41C. serrulata/S.isoetifolium with mixed species 77 ±9 8.75 (1) 8.75E. acoroides 25 ±6 2.45 (6) 2.82 (2) 5.97 (2) 11.24E. acoroides with T. hemprichii 38 ±3 0.91 (1) 0.91E. acoroides with T. hemprichii/Cymodocea spp &Total(ha)58 ±3 24.07 (1) 24.07mixed speciesE. acoroides/S.isoetifolium/C. rotundata & mixedspecies53 ±5 66.19 (1) 66.19E. acoroides/T. hemprichii 10 ±4 0.005 (1) 0.005E. acoroides/T. hemprichii with mixed species 64.95 ±31.6 0.06 (1) 0.06H. minor 3.515 ±0.77 63 ±5 0.03 (2) 0.03H. ovalis 2.845 ±1.18 54 ±4 1.12 (2) 0.36 (3) 1.48H. ovalis with mixed species 56 ±3 0.15 (1) 0.15T. hemprichii 13.11 ±2.60 0.2 (2) 0.68 (1) 5.71 (5) 6.59T. hemprichii with C. rotundata 6.361 ±1.00 1.63 (1) 1.63T. hemprichii with E. acoroides 7.085 ±1.74 48 ±7 1.66 (1) 148.72 (1) 79.58 (3) 229.96T. hemprichii with E. acoroides & mixed species 15.89 ±7.71 64 ±4 374.48 (4) 374.48T. hemprichii with H. ovalis 7.756 ±7.47 71 ±4 0.79 (2) 8.14 (1) 8.93T. hemprichii with H. ovalis & mixed species 9.374 ±3.72 0.01 (1) 0.01T. hemprichii/H. ovalis 0.669 ±0.66 0.33 (1) 0.33Total 5.12 (13) 221.23 (8) 527.58 (28) 753.93 (49)Rob Roy and Wagina <strong>Islands</strong>, off Choiseul’s south-eastern coast, are partly mangrove andsurrounded by large intertidal/shallow subtidal (
<strong>Solomon</strong> <strong>Islands</strong> <strong>Marine</strong> <strong>Assessment</strong> Technical ReportSome of the most extensive seagrass meadows in the province can be found in the north-easterncorner. Large intertidal and shallow subtidal meadows dominated by Enhalus acoroides andThalassia hemprichii can be found across the expansive barrier reef-flats, particularlyassociated with vegetated islands. The most extensive meadows encountered in the provincewere on the reef flats out from Tambatamba Island and Cape Alexander. The meadows coveredan area of approximately 106ha and 260ha, respectively. The meadow off Tambatamba Islandwas significantly greater biomass, and appeared productive for artisinal fisheries as 5 groups offishers were observed using nets and lines during the time of our examination. The meadowwas abundant with goatfish (Barberinus sp), three-line wrasse (Stethojulis strigiventer) andhiding on the seabed with the grass were several white-spotted puffer fish (Arothron hispidus).The coastal meadows sheltered behind the fringing reef flat in the vicinity of Chirivanga, werediverse with up to 7 species present at a single site. Two of the larger meadows encountered,were on the eastern sides of small points opposite Tambatamba and Vacho <strong>Islands</strong>. Thesemeadows (9 and 17ha respectively) were dominated by Cymodocea serrulata and Syringodiumisoetifolium, with a combination of other species (E. acoroides, H. ovalis, H. uninervis (wide &narrow leaf form), C. rotundata, T. hemprichii). These meadows were of high biomass for thespecies mix, and were abundant fish such as the barred halfbeak (Hemiramphus far), scribbledrabbitfish (Siganus spinus) and threespot damselfishes (Pomacentrus tripunchtatus).The remainder of the coastal meadows fringed the mangroves and were dominated byaggregated patches of Enhalus acoroides/Syringodium isoetifolium/Cymodocea rotundata &mixed species. In the mangrove islands surrounding the Chirivanga village, meadows weredominated by Enhalus acoroides with relatively few other species present.ISABEL PROVINCEIsabel is the longest island in the <strong>Solomon</strong>’s and dominates the province (Figure 6). It is a large,mainly volcanic landmass with steep mountain ranges and mangrove and freshwater wetlandsprevalent along the coast. 535.99 hectares of seagrass was mapped in 99 meadows in theprovince between 14 – 20 May 2004. Seagrass communities are dominated by Enhalusacoroides (74% of seagrass area), 86% of which were continuous cover (Table 5). Meadowswere located on large intertidal reef/mud flats in protected bays and lagoons. Seagrass coverwas moderately high and often associated with the macro-alage Caulerpa and Halimeda.420
Seagrasses and MangrovesFigure 6. Isabel ProvinceTable 4. Meadow categories, total area (hectares) and numbers of intertidal/shallow subtidal meadows inIsabel Province, <strong>Solomon</strong> <strong>Islands</strong> – May 2004.CATEGORYBiomass(g DW m -2 )Cover(%)IsolatedseagrasspatchesArea in hectares(number of meadows)Aggregated seagrasspatchesContinuousseagrasscoverC. rotundata 38 ±2 0.2 (2) 0.2C. rotundata with E. acoroides 88 ±4 1.91 (1) 1.91C. rotundata with mixed species 34.23 ±8.66 57 ±5 0.82 (1) 0.46 (2) 1.56 (3) 2.84C. rotundata with T. hemprichii & mixed species 50 ±3 1.84 (1) 1.45 (1) 3.29C. rotundata/T. hemprichii 77 ±9 0.93 (1) 0.93C. rotundata/T. hemprichii with mixed species 6.026 ±3.06 59 ±3 21.25 (2) 21.25C. serrulata with E. acoroides & mixed species 70 ±6 1.5 (1) 1.5E. acoroides 10.82 ±5.87 25 ±4 20.27 (10) 2.1 (6) 202.65 (11) 225.02E. acoroides with H. uninervis 27 ±7 0.87 (1) 0.87E. acoroides with H. ovalis 0.334 ±0.33 48 ±9 0.31 (1) 2.21 (1) 2.52E. acoroides with T. hemprichii 54.23 ±31.1 57 ±7 0.17 (1) 112.5 (4) 112.67E. acoroides with T. hemprichii & mixed species 2.008 ±2.00 15 ±5 6.17 (1) 6.17E. acoroides with T. hemprichii/Cymodocea sppTotal(ha)80 ±6 0.13 (1) 0.13& mixed speciesE. acoroides/Cymodocea spp with mixed species 64 ±7 4.48 (1) 4.48E. acoroides/H. uninervis with T. hemprichii 63 ±3 11.84 (1) 11.84E. acoroides/T. hemprichii 69 ±9 34.93 (3) 34.93H. uninervis 2.008 ±1.15 1.98 (1) 1.98H. uninervis with E. acoroides & mixed species 53 ±12 4.41 (1) 4.41H. uninervis with H. ovalis 11 ±3 0.24 (1) 0.24H. uninervis with T. hemprichii & mixed species 17.40 ±2.41 4.2 (1) 4.2H. uninervis/H. ovalis 27 ±15 0.54 (1) 0.54H. ovalis 3.162 ±1.92 0.45 (1) 9.14 (7) 0.64 (1) 10.23H. ovalis with E. acoroides 5.859 ±2.05 48 ±6 2.15 (3) 2.15S.isoetifolium with mixed species 46 ±4 0.25 (1) 0.25T. hemprichii 11.66 ±2.32 48 ±2 0.66 (1) 18.55 (6) 0.57 (1) 19.78T. hemprichii with C. rotundata 42.85 ±39.8 50 ±12 1.63 (1) 3.98 (2) 5.61T. hemprichii with C. rotundata & mixed species 40.25 ±9.52 15.22 (2) 15.22T. hemprichii with E. acoroides 10.79 ±3.27 63 ±7 0.8 (1) 5.64 (2) 6.44T. hemprichii with E. acoroides & mixed species 89 ±5 0.26 (1) 0.26T. hemprichii with H. ovalis 70.30 ±17.1 63 ±9 0.11 (1) 0.11T. hemprichii with H. ovalis & mixed species 2.008 ±1.15 2.02 (1) 2.02T. hemprichii/E. acoroides 65.28 ±65.2 62 ±6 5.77 (1) 1.25 (1) 7.02T. hemprichii/H. ovalis 8.035 ±1.15 55 ±6 0.35 (1) 23.64 (1) 23.99T. hemprichii/H. ovalis with E. acoroides 6.696 ±1.77 0.99 (1) 0.99TOTAL 29.17 (15) 43.42 (30) 463.4 (54) 535.99 (99)421
<strong>Solomon</strong> <strong>Islands</strong> <strong>Marine</strong> <strong>Assessment</strong> Technical ReportOn the south-eastern coast, seagrasses are located in sheltered lagoons or reef flats. In MaringeLagoon, seagrasses are predominately Enhalus acoroides and Thalassia hemprichii with someHalodule uninervis and Halophila ovalis in places. In the south of Maringe Lagoon, largeseagrass meadows cover much of the fringing reef flats with Enhalus acoroides and Thalassiahemprichii inshore, becoming more isolated patches of Enhalus acoroides toward the reef crestamongst the corals (e.g. Porities). Along the western shores, the fringing reef is narrow anddrops to deep water (~25m) within 100m from the shore. Large beds of Sargassum dominate.Seagrass in these areas in restricted to a narrow shallow subtidal fringe on 5-10m wide,dominated by Thalassia hemprichii and Enhalus acoroides. To the north of the lagoon,seagrasses are absent due to the high exposure to waves. The seabed is barren with isolatedpatches of Sargassum on dark fine highly mobile sands. Turbidity is also noticeably higher. Onthe leeward sides of Fera and Vegane <strong>Islands</strong>, seagrasses cover the nearshore shallow subtidalareas adjacent to patches of Rhizophora stylosa. Seagrass is also present on the protected sideof the main reef. Dominated by Cymodocea rotundata and Halodule uninervis, with Thalassiahemprichii and Halophila ovalis, these meadows are relatively small (
Seagrasses and Mangrovesmore extensive and dominated by abundant (60-80% cover) Thalassia hemprichii/Cymodocearotundata and Enhalus acoroides with Halodule uninervis. <strong>Islands</strong> along the barrier reef aremore exposed and if vegetated often have some Thalassia hemprichii and Halophila ovalispresent (30-50% cover). Unvegetated cays are often associated with more mobile sedimentsand seagrass appears unable to establish.Further northward along the coast, the reefs are fringing and are quite extensive in size.Seagrasses are generally confined to the lee side of large headlands (e.g., Hujuai Point), or areconfined to the very shoreward portion of the reef. Behind headlands, isolated Enhalusacoroides plants are present just inside the reef crest, associated with Caulerpa and Sargassum.Moving shoreward, Thalassia hemprichii becomes more abundant and along the shore a narrowband of seagrass (5-10m wide) is generally dominated by Halodule uninervis/Thalassiahemprichii with Halophila ovalis. On the southern sides of large bays, Halophila ovalis is oftenfound subtidally (down to 4m), and in the calmer inshore waters are Enhalusacoroides/Thalassia hemprichii/Halodule uninervis shoreward. These areas also often havehigh amounts of macroalgae (Caulerpa and Halimeda) and benthic micro-algae.On the large fringing reefs, the seagrass meadows can be very different, depending on the sizeof the reef-flat, the presence of any islands, and the level of water movement. Thalassiahemprichii is often scattered across the reef-flat, and the occasional Enhalus acoroides plant ispresent within the protected environments of Porites corals. Shoreward the meadows becomemore continuous forming a distinct meadow dominated by Thalassia hemprichii/Cymodocearotundata/Halodule uninervis with Enhalus acoroides and Halophila ovalis, often adjacent tomangroves (Rhizophora and Brugeria). On the very large reefs, often mangrove islands haveestablished and a back lagoon is present. These reef-flats are predominately bare sand withisolated pockets of reef. Halophila ovalis is scattered across the sandy banks and can be quiteabundant behind the mangrove islands. Isolated Enhalus acoroides plants are also present,often adjacent to small Porites bommies. Inshore of these large fringing reefs, the back lagoonscan be quite deep (15-20m), rising quickly to the edge of the mangroves. Enhalus acoroides issometimes present in sheltered pockets, but otherwise the extensive mangrove fringe is oftenbare.Seagrass was found surrounding the north western bays of Barora Ite Island. Meadows weregenerally narrow, dominated by Enhalus acoroides and fringe intact Rhizophora stylosa andBruguiera. Often the Enhalus plants are mixed in with coral (e.g., Porities) and macro-alage(Valonia & Caraesmosa). Juveniles of targeted reef fish (e.g., coral trout) were also abundant.On the wider fringing reef flats, meadows are predominately Thalassia hemprichii withCymodocea rotundata. On the eastern facing reef flats protected by small islands, meadows aregenerally continuous Enhalus acoroides/Cymodocea spp with mixed species. These meadowsare often in highly turbid waters, with abundant fish (e.g., trevally, sardines) and highepiphytes. Seagrass was generally absent from the barrier reefs. Small patches of Thalassiahemprichii however were found on vegetated barrier reef islands (e.g., Hilihavo Island).Within Rob Roy Channel, aggregated patches of Enhalus acoroides, Thalassia hemprichii(with Cymodocea rotundata) or Halophila ovalis were found on the fringing reef flats.A small aggregated patch of Enhalus acoroides was the only seagrass located along the passagebetween Barora Ite Island and Isabel Island, contrary to previous reports from the region. Thepassage in generally deep (25-50m), narrow (~10m at the narrowest point), has high currents,turbid (2m visibility) and bordered by Rhizophora stylosa and narrow fringing reefs.Between Kia Bay and Port Praslin, seagrasses communities can be found bordering themangroves adjacent to narrow fringing reefs which surround some of the medium sized midshelf islands (e.g., Ghateghe & Viketongana <strong>Islands</strong>). Between these islands and the larger423
<strong>Solomon</strong> <strong>Islands</strong> <strong>Marine</strong> <strong>Assessment</strong> Technical Reportisland of Barora Fa, seagrasses are less common. Mangroves are more extensive, turbidity ishigher and the sediments muddier. No seagrass was found on the western sides of Ghateghe orVakao <strong>Islands</strong>. Seagrass was not common on the barrier reef islands. No seagrass was foundsurrounding Koropagho, Rapita or Hetaheta <strong>Islands</strong>, although a small meadow of Thalassiahemprichii/Cymodocea rotundata/Halodule uninervis was found on the western side of KaleIsland. The large shallow reef flats were generally barren or contained patches ofHalimeda/Caulerpa.Unfortunately, Rakata Bay and its surrounds the reefs and islands could not be surveyed due totime constraints. It is highly likely that significant seagrass meadows may cover the shelteredfringing reefs in the area. Seagrasses have also been reported from Tina biro on the mid-easterncoast (Paul Riju pers comm.) but these were similarly not examined due to time constraints.The Western <strong>Islands</strong> are a collection of more than 100 islands, along with the tiny Arnavon<strong>Islands</strong>, located off the northern coast of Isabel. Some of these islands are mangrove and haveextensive reefs and sandbars. Seagrasses were not common on the fringing reef flats west ofPopu Passage. Due to the strong currents passing through Kologilo Passage, seagrasses arerestricted to isolated meadows behind larger islands. These meadows are sparse Thalassiahemprichii and Halophila ovalis. In some sites (eg Kohirio Is) the meadows also containCymodocea rotundata and form a more cohesive meadow within a few metres of the shore. Thelarger shallow reef flats are generally bare substrate with isolated patches of Halimeda andCaulerpa.Seagrass was absent from the large shallow reef flats across the very northern tip of IsabelIsland (Maduko, Surimangini & Pizuanakelekele Reefs). Seagrass was generally absent fromthe reef flats surrounding the exposed barrier reef islands of Suki and Malaghara. However,small meadows of Halophila ovalis.and Halodule uninervis were sometimes present in moresheltered locations adjacent to the slightly larger Nohabuna and Sibau <strong>Islands</strong>. Isolated patchesof Enhalus acoroides were adjacent to the mangroves which bordered the passage betweenKohirio and Kohirio <strong>Islands</strong>. No seagrass was on the exposed western reef flats of KohirioIsland.The Arnavon <strong>Islands</strong> contain one of the largest nesting grounds in the world for the endangeredhawksbill turtle (Eretmochelys imbricata) and is a declared MPA. Seagrass was virtually absentfrom the Arnavon <strong>Islands</strong>, with the exception of a small-scattered Cymodocea rotundatameadow adjacent to the TNC Research Station on Kerehikapa Island The remaining reef-flatsand sandbars contained significant amounts of Caulerpa. Can you say any more about themangroves in the Arnavons please?WESTERN PROVINCEThe province includes the New Georgia, Treasury and Shortland <strong>Islands</strong> (Figure 7). 754.5hectares of seagrass was mapped in 134 meadows in the province between 25 May - 1 June2004. The Western Province had the highest diversity of seagrass communities in the <strong>Solomon</strong><strong>Islands</strong>, with 37 different categories identified (Table 6). Most (89%) of seagrass meadows inthe province were of continuous cover (Table 6) and approximately 50% of the meadows wereCymodocea rotundata dominated communities (
Seagrasses and MangrovesFigure 7. Western ProvinceTable 4. Meadow categories, total area (hectares) and numbers of intertidal/shallow subtidal meadowsin Western Province, <strong>Solomon</strong> <strong>Islands</strong> – May/June 2004.CATEGORYBiomass(g DW m -2 )Cover(%)IsolatedseagrasspatchesArea in hectares(number of meadows)AggregatedseagrasspatchesContinuous seagrasscoverC. rotundata 42 ±3 0.23 (1) 0.18 (1) 0.41C. rotundata with E. acoroides & mixed species 81 ±7 51.57 (2) 51.57C. rotundata with E. acoroides/T. hemprichii 6.919 ±6.91 63 ±3 156.46 (3) 156.46C. rotundata with mixed species 3.013 ±0.33 0.42 (1) 27.78 (1) 28.2C. rotundata with T. hemprichii 84 ±2 43.36 (3) 43.36C. rotundata with T. hemprichii & mixed species 31.47 ±26.2 70 ±3 0.62 (1) 0.37 (1) 20.07 (2) 21.06C. rotundata/E. acoroides/T. hemprichii with mixed 9.374 ±9.37 58 ±5 88.18 (1) 88.18speciesC. rotundata/T. hemprichii with mixed species 80 ±9 2.67 (1) 2.67C. serrulata with E. acoroides & mixed species 78 ±6 0.28 (1) 17.24 (2) 17.52C. serrulata with mixed species 1.785 ±1.78 1.07 (1) 1.07C. serrulata/S.isoetifolium with mixed species 128.5 ±4.63 95 ±2 7.04 (1) 7.04Cymodocea spp with E. acoroides & mixed species 78 ±4 2.81 (1) 14.97 (2) 17.78Cymodocea spp with T. hemprichii 14.59 (2) 14.59E. acoroides 0.502 ±0.50 33 ±7 25.3 (26) 15.46 (14) 65.77 (13) 106.53E. acoroides with Cymodocea spp & mixed species 16.74 ±16.7 62 ±8 14.92 (1) 14.92E. acoroides with H. ovalis 43 ±11 0.56 (1) 3.95 (1) 0.18 (1) 4.69E. acoroides with T. hemprichii 47 ±6 0.13 (1) 0.88 (1) 9.17 (3) 10.18E. acoroides with T. hemprichii & mixed species 42 ±12 2.52 (2) 2.52E. acoroides/Cymodocea spp with mixed species 46 ±8 0.29 (1) 1.71 (2) 2E. acoroides/H. ovalis 15.06 ±15.0 12 ±6 2.98 (1) 2.98E. acoroides/T. hemprichii 84 ±3 0.69 (1) 0.69E. acoroides/T. hemprichii with mixed species 88.38 ±31.3 61 ±9 19.42 (3) 19.42H. uninervis with Cymodocea spp/T. hemprichii &38 ±1 8.04 (1) 8.04mixed speciesH. uninervis with E. acoroides & mixed species 2.343 ±0.33 0.61 (1) 0.61H. uninervis with H. ovalis 51 ±6 0.87 (2) 0.87H. uninervis with H. ovalis & mixed species 0.357 ±0.35 23 ±2 3.79 (1) 3.79H. uninervis with T. hemprichii & mixed species 41 ±11 1.29 (1) 1.29H. uninervis/H. ovalis 34 ±4 15.48 (1) 15.48H. uninervis/T. hemprichii/C. rotundata 50 ±1 0.19 (1) 0.19H. ovalis 0.334 ±0.17 36 ±3 0.01 (1) 0.02 (1) 0.4 (2) 0.43H. ovalis with mixed species 2.678 ±0.66 8 ±3 0.19 (1) 0.62 (1) 0.81T. hemprichii 10.95 ±4.88 32 ±3 0.36 (3) 6.3 (4) 16.1 (4) 22.76Total(ha)425
<strong>Solomon</strong> <strong>Islands</strong> <strong>Marine</strong> <strong>Assessment</strong> Technical ReportCATEGORYBiomass(g DW m -2 )Cover(%)IsolatedseagrasspatchesArea in hectares(number of meadows)AggregatedseagrasspatchesContinuous seagrasscoverT. hemprichii with C. rotundata 16.74 ±9.96 60.13 (2) 60.13T. hemprichii with C. rotundata & mixed species 0.167 ±0.16 45 ±12 0.78 (1) 0.78T. hemprichii with E. acoroides 63 ±14 1.47 (2) 1.47T. hemprichii with E. acoroides & mixed species 25.17 ±21.2 75 ±22 3.62 (2) 15.02 (1) 18.64T. hemprichii/E. acoroides 37 ±5 5.36 (1) 5.36TOTAL 31.87 (38) 44.76 (32)677.86(64)Total(ha)754.49 (134)The Shortland <strong>Islands</strong> are a scattered group at the north-western tip of the <strong>Solomon</strong> Island chainand only 9km from Bougainville, Papua New Guinea. The north-western side of ShortlandIsland is dotted with reefs and islets. Seagrass meadows were found fringing the eastern shoresof Togha Harbour and in front of Toumoa (Togha Point). Cymodocea rotundata, Thalassiahemprichii and Cymodocea rotundata dominated these meadows with aggregated Enhalusacoroides plants (generally amongst the reef). Halophila ovalis was also present but onlybordering the main meadows. The remainder of fringing reefs in Togha Harbour were eitherdevoid of seagrass or had a small scattering of Halodule uninervis. Larger meadows of Enhalusacoroides were located on patch reefs within Togha Harbour.Surrounding the many scattered islands in the area, were smaller seagrass meadows. A narrowmeadow of Enhalus acoroides and Thalassia hemprichii surrounded Rohae Island withscattered patches of Halophila ovalis extending down to 12m depth. Mainly intertidal andshallow sand flats, with the occassional scattering of Halophila ovalis and Thalassiahemprichii, surrounded other islands. Denser meadows were located along the sheltered shoesof the larger islands (e.g. Mania Is) and headlands. These meadows were mainly Thalassiahemprichii and Cymodocea rotundata with aggregated patches of Enhalus acoroides and amixture Halophila ovalis and Halodule uninervis.Significant seagrass meadows were located throughout Shortland Harbour, surrounding themain islands. These were predominately Cymodocea rotundata/Thalassia hemprichii in thenorthern parts, but the remainder were dominated by Enhalus acoroides. On the larger sandflatson the eastern sides of Poporang and Magusaiai <strong>Islands</strong>, Thalassia hemprichii was scatteredacross, with a narrow meadow of Enhalus acoroides bordering the mangrove shoreline.The Treasury <strong>Islands</strong> include Mono and Stirling, and are the western most islands of the group.Only very small isolated patches of Halophila ovalis were found within Blanche Harbour,within a small cove west of Wilson Point on Stirling Island. Local villagers also reported smallpatches of Halophila ovalis along the eastern shores of Falamae, however these may be fairlyisolated due to the compact nature of the sandy substrate and the exposure to oceanic waves.No larger meadows were encountered in the remainder of the harbour, a consequence of therelatively small area of fringing reef and the steeply sloping banks into deep (~30m) water.The western region of the New Georgia <strong>Islands</strong> includes the Gizo, Kolombangara, VellaLavella and Ranongga <strong>Islands</strong>. Most of these larger islands are volcanic (e.g., Kolombangara,Simbo, Vella Lavella), and there are also submarine volcanoes in the region.In Vatoro Bay (Vella Lavella Island) seagrasses were restricted to the shoreline behind thelarger reef flats (Cape Middleton) and in shallow sandy bays sheltered behind headlands. Onthe reef flats, seagrass were predominately scattered Thalassia hemprichii with a narrowCymodocea rotundata/Thalassia hemprichii meadow along the shore. In the sheltered bays,sparse meadows of Halodule uninervis (narrow leaf) with Halophila ovalis were present on thesandy substrates.426
Seagrasses and MangrovesMuch of Gizo Island is protected by barrier reefs, sand and coral shoals. Smaller islands andcays with long sandy shores surround the main island. On the barrier reef islands, small patchesof Cymodocea rotundata were present on the sheltered sides (e.g. Njari Island). Narrow (~15m)Enhalus acoroides dominated meadows border the northern shores of Gizo Island. Largersubtidal meadows dominated by Cymodocea rotundata, Cymodocea serrulata, Thalassiahemprichii, Halodule uninervis with some Halophila ovalis and Enhalus acoroides surroundthe islands of Mbambanga and Sepo. Two Seagrass-Watch monitoring sites were established oneither side of Mbambanga Island in April 2004 and are monitored by WWFSPP-Gizo.Two of the larger islands, which could not be examined due to time contratints, wereKolombangara and Ranongga. It is likely however, that the presence of seagrass would belimited as most of Kolombangara coastline is narrow coral-sand beaches/bays, and on the southeast are several small protected coves. Kolombangara has also been heavily logged. Thewestern coast of rugged narrow Ranongga Island falls abruptly into deep water, while theeastern coast is much lower, with terraces and onshore reefs.In the Munda region of the Western New Georgia <strong>Islands</strong> is Vonavona Lagoon. The lagoon(>10m deep) is 28km long and located between Vonavona and Kohinggo <strong>Islands</strong>, and alsoprotected by barrier reefs. Mangrove forests (predominately Rhizophora) fringe many parts ofthe lagoon. Within the lagoon are many islets, ringed by coral-encrusted shallows interspersedwith deeper seas. Most of the inner chain of islets are surrounded by white coral-debrisbeaches, connected by sandbars at low tide. Seagrass meadows in the lagoon are predominantlysubtidal with a narrow intertidal fringe, often adjacent to mangroves. Species include Thalassiahemprichii, Cymodocea rotundata, Cymodocea serrulata, Halodule uninervis, Enhalusacoroides and Halophila ovalis. Approximately 250 ha of seagrass was mapped across theintertidal and shallow-subtidal banks between the islands of Lola and Repi in southernVonovona Lagoon. These large continuous meadows of relatively low cover and biomass weredominated by Cymodocea rotundata with Thalassia hemprichii and isolated patches of Enhalusacoroides. Dugongs are known to frequent these meadows, particularly between Repi and Lola<strong>Islands</strong>. The remaining meadows appear important for turtle feeding and subsistence fisheries.Vonavona is also an area with important hawksbill and green turtle nesting areas.Mercier et al. (2000) and Dance et al. (2003) in a study of Holothuria scabra recruitment,reported significant seagrasses in Kogu Veke, Vonavona Lagoon, along the western coast ofKohinggo Island between 1997 and 1998. The bay of Kogu Veke covers an area of ca. 12 000m 2 in a semi-enclosed lagoon with no freshwater input except for rain. The area wascharacterised by Enhalus acoroides and Thalassia hemprichii meadows on sandy and/or muddysediment, and by coarse coral and shell substrata. An extensive mangrove swamp inundated athigh tide for a distance of ca. 70 m bordered the northern limit of the area uniformly. Thesubtidal area along the southern limit was characterized by the presence of numerous coralpatch reefs. Most of the area was exposed at low tide (excluding the mangrove area), while thedeepest areas had a maximum depth of ca. 3 m. The bay was protected from storms by itsgeographical location and limited fetch.Roviana Lagoon in the north-west New Georgia Group east of Munda, is protected fromoceanic swells by barrier reefs and offshore islands 20-40m high. Within the lagoon are manysmall islets formed from coral shoals. The lagoon contains predominately subtidal seagrassmeadows with a narrow intertidal fringe. Species include Thalassia hemprichii, Cymodocearotundata, Cymodocea serrulata, Halodule uninervis, Enhalus acoroides and Halophila ovalis.The lagoon is a significant dugong and turtle feeding area and is also important to subsistencefishery. Significant hawksbill and green turtle nesting areas are also present. Tabu shells arealso known to be collected from the seagrass meadows of Roviana Lagoon and North NewGeorgia, and are of cultural significance as they are traded to New Britain (Papua New Guinea)where stocks have been depleted.427
<strong>Solomon</strong> <strong>Islands</strong> <strong>Marine</strong> <strong>Assessment</strong> Technical ReportMarovo Lagoon, on New Georgia Island’s eastern seaboard is the world’s largest islandenclosedlagoon. This shallow lagoon is protected along much of it’s north-eastern side bynarrow raised barrier islands, 5-60m high. It was unsuccessfully nominated for World HeritageArea status. Mangroves are found in estuaries shoreward of many fringing reefs and on many ofthe lagoon’s islets. The landmass the lagoon partially surrounds is Vangunu Island. Seagrassmeadows in the lagoon are predominately shallow subtidal with a narrow intertidal fringe.Species include Thalassia hemprichii, Cymodocea rotundata, Halodule uninervis, Enhalusacoroides and Halophila ovalis. The lagoon is a significant dugong and turtle feeding area withimportant hawksbill and green turtle nesting areas. The meadows are also important tosubsistence fisheries.Halophila ovalis and Halodule uninervis dominated meadows were located on the gentlysloping bays on the western sides of the barrier reef islands (e.g., Uepi Island) in the northernsection of the lagoon. The central lagoon islands had predominately rocky shorelines withrelatively narrow fringing reefs and no seagrass. On the eastern sides of the larger islands (NewGeorgia and Vanguru), seagrass was generally isolated plants or patches of Enhalus acoroidesalong the mangrove shoreline. Aggregated patches of Enhalus acoroides were common on thenearshore islands with larger fringing reef flats bordered by R. stylosa. Halophila ovalis wasfound on the sheltered sides of some smaller inshore islands with sandy shorelines.In southern Marovo Lagoon, there appears a habitat gradient with freshwater influenced reefsadjacent to Vangunu Island in the west, across patch reefs, shallow lagoon areas, to barrierislands in the east with pinnacle reefs and double barrier reef south of Uepi Island to NggatokaeIsland. These barrier reefs, with narrow deep channels exiting the main lagoon, are one of theworld's best examples of double barrier reefs. Narrow aggregated Thalassia hemprichii/Enhalusacoroides meadows were present along the outer reefs (e.g., Mbili) and Halodule uninervis(with Halophila ovalis & mixed species) or Enhalus acoroides lined many of the leewardshorelines of the inner barrier reefs. Isolated patches of Enhalus acoroides were often presenton the protected sides of larger mid-lagoon islands adjacent to sandy beaches. The mostsignificant meadow was a narrow meadow along the eastern shoreline of Tengomo Island, withdense Cymodocea serrulata inshore and spare Halodule uninervis and Halophila ovalisseaward. A large meadow dominated by Cymodocea rotundata with mixed species was alsolocated on the large shallow intertidal banks adjacent to the northern coastline Gatokae.Most of the larger bays and inlets of Marovo Lagoon had significantly higher turbidity that theouter barrier islands. This is possibly a consequence of the larger size and shallow depth of thelagoon, with a naturally high sediment load from adjacent major rivers and catchments. Thelevel of turbidity however has been exacerbated by the presence of logging operations aroundmuch of the lagoon. <strong>Assessment</strong>s of inshore areas adjacent to logging camps in some localities(e.g., Merusu) found seagrass absent and higher than considered natural levels of turbidity. Insome instances, the point source of large plumes of very turbid red/brown water was loggingcamps.South of New Georgia is Tetepare Island, the largest uninhabited tropical island in the world.The island covers and areas of 120 km 2 and is surrounded by fringing reefs with large seagrassmeadows which support abundant dugong, fish and invertebrates. Unfortunately, TetepareIsland could not be surveyed due to weather and time constraints. Visits to the islands areplanned by WWFSPP and TNC in the near future and this may be an opportunity to surveysseagrasses in the area.CENTRAL PROVINCEThe province comprises the Melanesian islands of the Nggela (or Florida) Group, Savo and theRussell’s (Figure 8). 651.5 hectares of seagrass were mapped in 56 meadows in the Central428
Seagrasses and MangrovesProvince. These meadows were mostly continuous in character (98% of seagrass area) andcommunities were dominated either by E. acoroides or C. rotundata (56% and 39% of seagrassmeadow area respectively) (Table 7).Figure 8. Central Province and Guadalcanal ProvinceIn calm localities with a relatively wide lagoon (100-300m), such as Tetel Island (Florida<strong>Islands</strong>), the sand-mud flats are generally dominated by T. hemprichii shoreward andE. acoroides seaward and often bordered by mangroves (Avicennia, Rhizophora and Bruguiera)when near rivers or streams (Womersley & Bailey (1969).Table 5. Meadow categories, total area (hectares) and numbers of intertidal/shallow subtidal meadowsin Central Province, <strong>Solomon</strong> <strong>Islands</strong> – June 2004.CATEGORYBiomass(g DW m -2 )Cover(%)IsolatedseagrasspatchesArea in hectares(number of meadows)AggregatedseagrasspatchesContinuousseagrasscoverC. rotundata with E. acoroides 60 ±20 0.52 (1) 0.52C. rotundata with T. hemprichii & mixed species 87.04 ±12.0 63 ±7 1.11 (1) 1.11 (1) 2.22C. rotundata/H. uninervis with mixed species 32.81 ±1.77 0.16 (1) 0.16C. rotundata/T. hemprichii 60.59 ±7.70 26 ±14 0.24 (1) 243.06 (3) 243.3C. rotundata/T. hemprichii with mixed species 65.95 ±52.5 10.6 (1) 10.6Cymodocea spp with E. acoroides & mixed species 76 ±5 6.3 (2) 6.3E. acoroides 0.479 ±0.47 24 ±5 2.09 (5) 2.4 (3) 16.37 (4) 20.86E. acoroides with Cymodocea spp & mixed species 24.32 ±24.3 47 ±1 1.88 (1) 1.88E. acoroides with H. ovalis 0.435 ±0.43 19 ±2 1.59 (1) 3.89 (1) 5.48E. acoroides with T. hemprichii 0.770 ±0.77 37 ±6 0.62 (1) 80.51 (3) 81.13E. acoroides with T. hemprichii/Cymodocea spp &mixed species15.49 ±14.8 57 ±7 107.77 (2) 107.77E. acoroides with T. hemprichii/H. ovalis 24 ±3 136.6 (1) 136.6E. acoroides/Cymodocea spp with mixed species 51 ±15 0.56 (1) 0.56E. acoroides/T. hemprichii 42 ±15 0.31 (1) 0.31E. acoroides/T. hemprichii with mixed species 3.270 ±3.52 63 ±5 0.11 (1) 10.07 (1) 10.18H. uninervis with T. hemprichii & mixed species 30.13 ±15.3 0.31 (1) 0.31H. minor 32 ±2 0.48 (2) 0.48H. ovalis 1.774 ±0.72 0.33 (1) 0.58 (1) 0.91H. ovalis with E. acoroides 45 ±4 0.09 (1) 0.09S.isoetifolium with mixed species 111.8 ±5.95 0.3 (1) 0.3T. hemprichii 18.74 ±2.91 90 ±3 0.65 (2) 0.65T. hemprichii with C. rotundata 35.50 ±25.7 71 ±5 0.72 (2) 0.15 (1) 2.12 (1) 2.99Total(ha)429
<strong>Solomon</strong> <strong>Islands</strong> <strong>Marine</strong> <strong>Assessment</strong> Technical ReportCATEGORYBiomass(g DW m -2 )Cover(%)IsolatedseagrasspatchesArea in hectares(number of meadows)AggregatedseagrasspatchesContinuousseagrasscoverT. hemprichii with C. rotundata & mixed species 56.19 ±30.7 36 ±1 8.94 (2) 8.94T. hemprichii with H. ovalis 2.845 ±2.14 0.82 (1) 1.49 (1) 2.31T. hemprichii/C. rotundata with mixed species 112.4 ±1.15 6.56 (1) 6.56T. hemprichii/E. acoroides 33 ±12 0.09 (1) 0.09Total 4.92 (11) 7.74 (13) 638.84 (32) 651.5 (56)The Russell <strong>Islands</strong> consist of two adjacent larger islands, Mbanika and Pavuvu, plus manysmaller islets. Huge coconut plantations cover the islands. Pavuvu Island is the largest island inthe Russell’s group with extensive reefs to the north and many small, sandy islands withinthem. Cymodocea rotundata/Thalassia hemprichii meadows with some Halopihla ovalisdominate the barrier reefs and the extensive fringing reef flats to the north of the region, whichare popular Green turtle foraging areas (Job Upo, Karol Kisokau pers comm).Extensive continuous Enhalus acoroides with Thalassia hemprichii/Cymodocea spp & mixedspecies meadows are found bordering the edges of Pipisala Bay, which is surrounded bycoconut plantations. These meadows are abundant (58% mean cover) and extend toapproximately 3m in the clear water on coarse sand substrates. Large and abundantholothurians of commercial and artisinal importance are also abundant in the deeper waters ofthe bay. Similarly, these meadows are found in the shallow bays at the northern end of Sera MeOhol (Sunlight) Channel. Mark Savi (pers comm.) reported a large patch of seagrass in YadinaBay. Narrow meadows of aggregated Enhalus acoroides plants, border Sera Me Ohol(Sunlight) Channel, Kokolaonohol Sound, and small inlets, along the edges of the Rhizophorastylosa fringe. These meadows are also adjacent to coconut plantations and villages, receivinghigh nutrients from point sources such as drains and pig sties.Two large islands, Nggela Sule and Nggela Pile, separated by narrow Utaha Passage, dominatethe Florida <strong>Islands</strong>. The Florida <strong>Islands</strong> has a rich coastline consisting of coastal islands repletewith exposed and sheltered seagrass communities. On the mainland coast are a series ofembayment inhabited by coastal peoples and inlets feeding into the inner reaches of FloridaIsland (Negella Sule). In the region from Mbungana <strong>Islands</strong> to Tulaghi Harbour exists a largesystem of inlets with their waterways reaching into coastal riverine systems. It is likely that thishigh-energy coastline, subject to strong onshore winds and currents has resulted in dominanceby sand shell sediments with a negligible mud component throughout tens of kilometers ofseagrass habitat.These habitats are fringed by mangroves and contain dense stands of Enhalus acoroides withThalassia hemprichii and Halophila ovalis. Also found in this sheltered habitat were smallpatches of Halophila minor in sand dominated sediments. Inside the inlet interspersed alongthen mangrove fringed coastline, are areas of sand deposition and beach formation. Low tomoderate stands of Enhalus acoroides and Thalassia hemprichii were found in these sheltered“harbours”. On the open coast areas of beach were found in association with lagoonscontaining a high diversity of seagrass species including Cymodocea serrulata, Cymodocearotundata, Enhalus acoroides, Halophila ovalis. These lagoonal areas with moderate exposureto the open coast were diverse in their assemblage of seagrass yet only represent about 10% ofthe area relative to all meadow types in the region. These areas form a protective barrier andharbour to coastal communities.Sandfly Passage, between Nggela Sule and Mbokonimbeti Island, has deep waters (70-120m),which rise rapidly to narrow (50-100m) shallow fringing reef flats adjacent to mangroves linedshores. Inshore is a 10m wide band of Enhalus acoroides mixed with Thalassia hemprichii andHalophila ovalis. On wider reef flats (100-400m), seagrass communities are dominated bySyringodium isoetifolium and Thalassia hemprichii, mixed with Halodule uninervis,Total(ha)430
Seagrasses and MangrovesCymodocea rotundata, Halophila ovalis and patches of Enhalus acoroides. In these meadows,the sea urchin Tripneutus and juveniles of the emperor (Lutjanus harak) were abundant.In the far north of the Florida <strong>Islands</strong> are the Bueno Vista islands. Patches of Enhalus acoroidesare scattered along the shores between the shoreline and the reef. In the north facing bays (e.g.,Sambani Island & Tadhi village seafront), meadows of aggregated Thalassiahemprichii/Halophila ovalis or Enhalus acoroides/Thalassia hemprichii patches are abundant,inside the reef with isolated Enhalus acoroides patches in close to beach. In more protectedbays (Mbodhoghori Island and Hanesavo Harbour), the seagrass communities are dominated byCymodocea rotundata and Thalassia hemprichii, with patches of Halophila ovalis and Enhalusacoroides. In these areas, the meadow is a relatively narrow band (50-100m wide), beforemixing into the reef (e.g., Porites) proper. In the shallows, the sea cucumbers Holothuria atraand H scarbra were fairly common.Savo is a cone shaped island on Iron Bottom Sound, off northern Guadalcanal Island. Adormant volcano dominates the island, and although it has a significant population (14villages), its 31 km 2 shores have limited fringing reefs and a reputation to be shark-infested. Asmall patchy meadow of Halophila minor (unconfirmed identification) was observed at 25mduring a dive off the island. It is likely that these deeper water meadows may be more extensiveacross the Sound and off the northern shore of Guadalcanal.GUADALCANAL PROVINCETotally 5,302 km 2 , Guadalcanal is the largest island in the <strong>Solomon</strong>’s group (Figure 8). Thenorthern coastal plain contrasts with the weathered southern coast. The southern coast isexposed to the south-easterly trade winds and heavy rainfall, associated with strong currentsand large oceanic swells. The likelihood of seagrass persisting in such environments is verylow.Only 101.25 hectares of seagrass was mapped in 31 meadows in the province between 5 - 16June 2004. 76 percent of seagrass meadows in the province were of continuous cover (Table 8)and restricted to the calmer bays and fringing reefs along the north western shores and theextensive reef complexes at the islands most easterly extent. In these locations the seagrassmeadows were generally continuous in structure and predominately (57% of total seagrass area)T. hemprichii dominated communities.Table 8. Meadow categories, total area (hectares) and numbers of intertidal/shallow subtidal meadowsin Guadalcanal Province, <strong>Solomon</strong> <strong>Islands</strong> – June 2004.CATEGORYCover(%)IsolatedseagrasspatchesArea in hectares(number of meadows)AggregatedseagrasspatchesContinuous seagrasscoverC. rotundata with T. hemprichii 67 ±13 0.67 (1) 0.67C. rotundata with T. hemprichii & mixed species 59 ±7 9.8 (2) 9.8C. rotundata/T. hemprichii 42 ±17 14.61 (1) 14.61C. rotundata/T. hemprichii with mixed species 54 ±13 11.03 (3) 11.03E. acoroides 15 ±4 0.06 (1) 0.81 (2) 3.21 (6) 4.08E. acoroides with T. hemprichii 50 ±8 25.34 (3) 25.34E. acoroides with T. hemprichii/H. ovalis 33 ±3 0.35 (1) 0.35E. acoroides/T. hemprichii 52 ±6 3.18 (2) 3.18H. uninervis with Cymodocea spp/T. hemprichii & mixed species 65 ±4 0.1 (1) 0.1H. uninervis with T. hemprichii & mixed species 67 ±10 1.18 (1) 1.18H. decipiens 6 ±2 1.12 (1) 1.12H. minor with H. uninervis 24 ±3 5.12 (2) 5.12H. ovalis with E. acoroides 28 ±3 3 (1) 3H. ovalis with mixed species 61 ±7 0.49 (1) 0.49T. hemprichii 16 ±3 0.18 (2) 4.4 (2) 4.58T. hemprichii with E. acoroides 17 ±1 0.11 (1) 10.56 (1) 10.67T. hemprichii with E. acoroides & mixed species 60 ±3 1.97 (1) 1.97Total(ha)431
<strong>Solomon</strong> <strong>Islands</strong> <strong>Marine</strong> <strong>Assessment</strong> Technical ReportCATEGORYCover(%)IsolatedseagrasspatchesArea in hectares(number of meadows)AggregatedseagrasspatchesContinuous seagrasscoverT. hemprichii/C. rotundata with mixed species 63 ±15 3.96 (1) 3.96Total 0.24 (3) 23.52 (6) 77.49 (22) 101.25 (31)On the north west of Guadacanal, near Cape Esperance, the coast is semi-exposed and beachesform a uniform stretch of sloping black sand. Close to shore seagrass were mostly absent asthese areas are characterized by high-energy wave-dominated forces that may inhabitcolonization by seagrass seedlings or vegetative shoots. A moderate to dense stand of Haloduleuninervis and Halophila ovalis followed the coastline inside the reef crest in shallow subtidalwaters (1 to 5m deep). Here the reef crest is permanently subtidal and the coral reef slopes to>50m. These meadows provide dugong foraging habitat, which are known to inhabit the area.Halophila decipiens was found at 37 m and was observed in the 36-40m zone, an area with aflat shell sand substrate and low light penetration. Survival in very deep waters suggests thatsufficient light is available for seagrass growth. The absence of seagrass in areas shallowerthan 40m and deeper than 5m is likely due to the lack of available sand substrate, anddominance of hard coral substrate unsuitable for seagrass growth.In moderate wave action localities, such as Mamara and Kukum (west and east of Honiararespectively) on north-west Guadalcanal, the reef is narrow. Seagrasses have been reportedfrom the Catholic Mission (Visale Village), west of Cape Esperance. In calm localities with arelatively wide lagoon (100-30m), such as Komimbo (north-west Guadalcanal) the sand-mudflats are generally dominated by Thalassia hemprichii shoreward and Enhalus acoroidesseaward and often bordered by mangoves (Avicennia, Rhizophora and Bruguiera) when nearrivers or streams (Womersley & Bailey 1969).Marau Sound on the eastern tip of Guadalcanal has the island’s largest expanse of fringing reef.Here fringing reefs were dominated by Enhalus acoroides/Cymodocea rotundata close to shore(0-10m from beach), Thalassia hemprichii/Cymodocea rotundata (20-50m from beach) andThalassia hemprichii/Halophila ovalis (50+m from shore). Most meadows however, were only30m wide fringing mangrove habitats and islands (e.g., Marapa Island). No seagrass waspresent in the channels between mainland and large islands, yet mangroves dominated theshoreline. Some fringing reef meadows extended 50-100m from smaller islands in the MarauSound (e.g., Beura, Henera <strong>Islands</strong>). Sheltered bays on the southern mainland area of MarauSound were dominated by Enhalus acoroides, Thalassia hemprichii and Cymodocea rotundata.Substrate consists of mainly sand, shell and coral reef with algal dominants includingHalimedia, Caulerpa, Dityota and turf algae. No seagrass was found below 2-3 m.Total(ha)MAKIRA PROVINCEMakira (San Cristobal) Island is the largest landmass of the province (Figure 9). It is amountainous island, with steep cliffs along its southern coast. The north-western coast ofMarika Island is rugged. Elsewhere, the island has long black-sand beaches in its many bays,interspersed with mangrove forests.432
Seagrasses and MangrovesFigure 9. Makira ProvinceOff the southern eastern tip of Makira Island are the raised coral atolls of Santa Ana and SantaCatalina <strong>Islands</strong>. Santa Ana has beaches on its western side which support nesting sites forSouth West pacific Hawksbill turtle populations (Ian Bell QPWS pers comm.), however seasare too rough for this to occur on the island’s eastern shore. These islands were not examinedduring this survey as information available indicated that the possibility of seagrass presencewould be low.229.05 hectares of seagrass was mapped in 52 meadows in the province between 6 - 9 June2004. In general, Makira Province has large fringing reefs on the leeward or protected sides ofland masses/islands, where continuous seagrass meadows of predominantly (58% of seagrassarea) Thalassia hemprichii or Cymodocea rotundata (10% of seagrass area) communitiesdominated (Table 9). On the more exposed coastlines, seagrasses were generally absent, unlessa significant reef crest was present.On the north-western coast of Makira, along the exposed coast between Di’una and Oneibia,seagrass meadows in the lagoon (fringing reef) were dominated by Enhalus acoroides,Cymodocea rotundata, Halodule uninervis and Cymodocea serrulata, Halophila ovalis close toshore. Mid and edge of the lagoon was dominated by Thalassia hemprichii and Halophilaovalis with some Cymodocea rotundata. Sediment was white coarse sand and shell with reef.Inside the bay, towards Oneibia, seagrass meadows were dominated by Enhalus acoroides andThalassia hemprichii (shallow) and Halophila ovalis (2-3 m deep). As the coast extendstowards Oneibia, the sediments were darker in color and of terrestrial origin with high mud anddark components. Enhalus acoroides dominated the sheltered regions of Anuta Island withsome Thalassia hemprichii and Halophila ovalis. Dense stands of Syringodium isoetifolium,Cymodocea rotundata and Halodule uninervis dominated inside the reef crest on the westernshores of Anuta Island. Meadows extended only 30-40 m from shore. Halophila ovalis wasfound at 26 and 37m on western shore of Anuta island. Halimedia and turf algae wereabundant.433
<strong>Solomon</strong> <strong>Islands</strong> <strong>Marine</strong> <strong>Assessment</strong> Technical ReportAt Cape d’Entrecasteaux, small (30-50 m wide) reefs on the eastern side had some seagrasses,including E. acoroides, C. rotundata, T. hemprichii, S. isoetifolium and H. ovalis. Seagrassdistribution was patchy and also found on the dark sediments of Marautewa Island(E. acoroides and H. ovalis). E. acoroides was found inside the mangrove lined inlets,particularly near the mouths, but generally did not penetrate far into the inlets. Instead, coraland algae were found dominating deep into the interior, with little or no freshwater influence.Despite the presence of extensive mangroves, seagrass habitat was restricted, possibly aconsequence of high currents and steep sandy slopes with dark colored waters. In smaller bays(e.g., Hunihu) seagrass (H. ovalis, H. uninervis) was found on dark sediments with lots of algae(e.g., turf, Halimeda). The area however, was not extensively surveyed due to time and localcommunity constraints.Table 6. Meadow categories, total area (hectares) and numbers of intertidal/shallow subtidal meadowsin Makira Province, <strong>Solomon</strong> <strong>Islands</strong> – June 2004.CATEGORYCover(%)IsolatedseagrasspatchesArea in hectares(number of meadows)AggregatedseagrasspatchesContinuousseagrasscoverC. rotundata 68 ±9 0.6 (1) 0.6C. rotundata with mixed species 52 ±9 2.78 (3) 2.78C. rotundata with T. hemprichii 70 ±8 2.05 (2) 2.05C. rotundata with T. hemprichii & mixed species 54 ±10 14.09 (4) 14.09C. rotundata/H. uninervis with mixed species 27 ±0 0.13 (1) 0.13C. rotundata/T. hemprichii with mixed species 43 ±10 3.38 (2) 3.38E. acoroides 24 ±0 3.93 (3) 3.93E. acoroides with Cymodocea spp & mixed species 42 ±15 3.15 (1) 3.15E. acoroides with H. ovalis 31 ±8 1.61 (2) 1.61E. acoroides with T. hemprichii & mixed species 72 ±3 0.49 (1) 0.49E. acoroides with T. hemprichii/Cymodocea spp & mixed species 72 ±6 13.38 (1) 13.38H. uninervis with E. acoroides & mixed species 14 ±1 0.36 (1) 0.36H. uninervis with H. ovalis & mixed species 27 ±11 1.75 (1) 1.75H. uninervis with T. hemprichii & mixed species 50 ±14 1.24 (2) 1.24H. uninervis/H. ovalis 55 ±0 0.34 (1) 0.34H. ovalis 1.89 (2) 1.89S.isoetifolium with mixed species 74 ±14 8.39 (2) 8.39T. hemprichii 36 ±5 5.25 (3) 32.14 (5) 37.39T. hemprichii with C. rotundata 38 ±2 0.38 (1) 0.17 (1) 0.55T. hemprichii with C. rotundata & mixed species 47 ±6 107.577 (4) 107.577T. hemprichii with E. acoroides 77 ±6 0.66 (1) 0.66T. hemprichii with E. acoroides & mixed species 59 ±14 0.01 (1) 8.22 (1) 8.23T. hemprichii with H. uninervis & mixed species 58 ±14 0.96 (1) 0.96T. hemprichii/C. rotundata with mixed species 55 ±7 6.21 (2) 6.21T. hemprichii/E. acoroides with C. rotundata 71 ±0 6.79 (1) 6.79T. hemprichii/H. ovalis 17 ±1 1.12 (1) 1.12Total 0.38 (1) 8.8 (9) 219.87 (42) 229.05 (52)At the east end of Makira Island is Star Harbour, the most secure anchorage in the region,which around Na Mugha has extensive fringing coral reefs. On the northern part of coasttowards Io Harbour, the large fringing reefs were covered with E. acoroides/C. rotundatameadows immediately inshore, which changed to C. rotundata/T. hemprichii/H. ovalis mid-reefand T. hemprichii/H. ovalis on the seaward edge inside the reef crest. Meadows in shallownearshore areas extended from the open coast into the mouth of Star Harbour. Meadows were70-150m wide on the open coast but only 20-40m wide on north-western shores of Starharbour.Further west into Star Harbour, away from the open coast, mangroves and beaches fringe thewestern mainland shore, however seagrass meadows were absent. Sediments were finer and ofterrestrial origin (dark in color, high organic content) closer to shore, especially near villages,which may explain the paucity of seagrass. Corals and macro-algae (e.g., Halimedia, Dictyota,)were abundant.Total(ha)434
Seagrasses and MangrovesNevertheless, in the lower southern reaches of Star harbour, large expansive intertidal meadowsof E. acoroides/T. hemprichii and C. rotundata dominated around reefs/islands and mangroves.Much (about 60—70%) of this U-shaped reef, opposite Na Mugha, was covered by seagrass,restricted to coarse sand and shell sediments and fringed by rocky/reef. The meadows were upto 500m long and 50-200m wide and restricted to shallow waters.Along the sheltered mainland coast west of Na Mugha, seagrass was absent on the dark brownsediments, especially near to beaches and villages. However intertidal meadows dominated byE. acoroides/T. hemprichii/C. rotundata were found closer to Na Mugha adjacent to mangroves(R. stylosa and Brugiera) on the small fringing reefs. No seagrass was found inside the inletnear Na Mugha, as water clarity was low due to high suspended matter and tannin content.Mudflats exist deep inside the inlet and mangroves line the inlet in a continuous cover. East ofNa Mugha point, a large expanse of intertidal reef is present and dominated in part by Thalassiahemprichii with Enhalus acoroides & mixed species (41-90% cover).Small islands within greater Star Harbour had some patchy T. hemprichii and isolatedRhizophora trees. These areas were more exposed to wave action and surrounded by coral reefand rocky outcrops. The coral reef was in poor to good condition and at one site Lyngbya wasfound smothering corals. The dark color of the inshore sediments and high abundance ofmangroves suggests high nutrient availability which may promote Lyngbya and other macroalgalgrowth (80-90% cover).Off the northern coast of Makira, are located a couple of islands groups; the Three Sister andUgi <strong>Islands</strong>. Seagrass meadows exist on the leeward side of each Three Sister island, as theeastern shores were too rocky and exposed to waves. On Alite Island (the northern most), verypatchy T. hemprichii was found on the western shore. On Malaulalo Island a more extensivemeadow consisting of T. hemprichii, C. rotundata and H. ovalis was found extending thewestern shore inside the reef crest. This meadow was on coarse sand/shell and macro-alage(incl. Halimeda, turf, Lyngbya) was abundant. The north and southern most points had noseagrass. On Malaupaina Island (the southern most island), no seagrass was found on theexposed northern tip but T. hemprichii, H. ovalis and C. rotundata meadows dominated thebays along the western leeward shores. Inside the lagoon fringed by mangroves, seagrassmeadows (20-30m wide) fringed the lagoon and were dominated by E. acoroides, H. uninervis,C. rotundata and H. ovalis. The sediments were coarse sand and meadows ranged from isolatedpatches to continuous stands and were associated with coral reef patches and macro-algae (e.g.,Halimeda, turf). No seagrass was found south of the lagoon and no seagrass is likely to befound on the exposed eastern shores of the island.The Uki Ni Masi <strong>Islands</strong> are two islands located west of the Three Sister <strong>Islands</strong>. Seagrassmeadows were only present on the western leeward, protected, shores of Pio Island (thenorthern island). At the northern, southern and eastern shores of the island, the reefs areexposed to prevailing north and south easterly swells and dominated by surf beaches and rockyintertidal regions devoid of seagrass. Small, patchy, T. hemprichii meadows were found on thenorthwestern reef flats. Moving south, meadows approximately 20-40 m wide consisted ofC. rotundata close to shore and mixed stands of C. rotundata, T. hemprichii and H. ovalisfurther offshore. These fringing reef meadows were constrained by a reef crest relatively closeto shore (
<strong>Solomon</strong> <strong>Islands</strong> <strong>Marine</strong> <strong>Assessment</strong> Technical Reportmain island. On the south-eastern coast the reef crest lies approximately 400m off the coast andan extensive fringing reef/lagoon area exited shoreward of this reef. Extending from the southfor approximately 1-2km past the village of Makia, and north up to the village of Tawarodo,exited a large (50-60m wide) meadow of C. rotundata, T. hemprichii and H. ovalis. This coastis exposed to strong prevailing winds and wave action, yet the reef crest approximately 400mfrom shore protects the seagrass meadows. At Tawarodo village, S. isoetifolium was foundwithin a boat access channel (approx 200m long,
Seagrasses and MangrovesEpisodic terrigenous runoff events result in pulses of increased turbidity, nutrients and a zoneof reduced salinity in nearshore waters. Seagrasses, especially structurally large species, affectcoastal and reefal water quality by absorbing nutrients and trapping sediments acting as a bufferbetween catchment inputs and reef communities. Unlike neighbouring Australia, where smallspecies (e.g. Halodule and Halophila) comprise the majority of the coastal nearshore seagrassmeadows, <strong>Solomon</strong> Island seagrass are dominated by structurally large seagrasses (Thalassia,Enhalus, Cymodocea). Seagrasses have the ability to act as a bio-sink for nutrients, sometimescontaining high levels of tissue nitrogen and phosphorous. They also provide food and shelterfor many organisms, and are a nursery grounds for commercially important prawn and fishspecies. Macro-grazers, dugongs (Dugong dugon) and green sea turtles (Chelonia mydas) mayalso be an important feature in structuring seagrass communities in the <strong>Solomon</strong> <strong>Islands</strong>.Table 10. Summary of seagrass habitats of the <strong>Solomon</strong> <strong>Islands</strong>.Habitat Limiting factor Seagrass species Feature/threatsEstuaries (incl.large shallowlagoons)Terrigenous runoffCymodocea rotundataCymodocea serrulataHalodule uninervisEnhalus acoroidesHalophila minorHalophila ovalisHighly productiveHigh denisity, low diversityOften associated withmangrovesHighly threatenedCoastal (incl.Fringing reef)Physical disturbanceCymodocea rotundataCymodocea serrulataHalodule uninervisSyringodium isoetifoliumEnhalus acoroidesHalophila ovalisThalassia hemprichiiVery diverseHighly productiveImportant for fisheriesSupports dugongsDynamicThreatened by developmentDeep-water Low light Halophila decipiensHalophila minorHalophila ovalis>10m deepMonospecificHigh turnoverLeast known habitatThreats unknownReef (e.g.,barrier orisolated)Low nutrientsCymodocea rotundataHalodule uninervisSyringodium isoetifoliumThalassodendronciliatumHalophila ovalisThalassia hemprichiiSupport high biodiversityShallow unstable sedimentVariable physical environmentLittle studiedLeast threatenedGlobally, seagrass loss has generally been linked to declining water quality. Seagrass growth ingeneral is limited by light, disturbance and nutrient supply, and changes to any or all of theselimiting factors may cause seagrass decline. The most common cause of seagrass loss beingfrom the reduction of light availability due to chronic increases in dissolved nutrients leading toproliferation of algae reducing the amount of light reaching the seagrass (e.g. phytoplankton,macroalgae or algal epiphytes on seagrass leaves and stems) or chronic and pulsed increases insuspended sediments and particles leading to increased turbidity (Schaffelke et al. 2005). Inaddition, changes of sediment characteristics may also play a critical role in seagrasses loss.There were no indications during the present survey that nutrients appear to be having anegative effect on seagrass growth and distribution throughout the <strong>Solomon</strong> <strong>Islands</strong>. This is notan unexpected observation as the region as a whole is in relatively healthy condition compared437
<strong>Solomon</strong> <strong>Islands</strong> <strong>Marine</strong> <strong>Assessment</strong> Technical Reportto many other regions globally. There was, however, evidence (supported by a number ofanecdotal reports) that the delivery of sediments into coastal waters has increased at somelocations, primarily the result of logging activities (esp. Marovo Lagoon). These sedimentssettle out of the water column, particularly in the protected nearshore areas where seagrassesare most likely to be found. Thus coastal seagrass habitats are vulnerable to changes in waterquality as they are directly exposed to increased sediment loads. These additional sedimentsusually reduce habitat quality as a result of the combined effects of additional sediments andnutrients locally.Loss of seagrass due to storms, flooding and cyclones has undoubtedly occurred in the<strong>Solomon</strong> <strong>Islands</strong> from time to time due to the influx of freshwater and sediment in the waterwhich cuts light penetration underwater. However, without an adequate baseline (until now) tocompare, these large-scale changes would occur relatively undetected. Fortunately tropicalseagrasses are relatively resilient, having evolved and adapted to such natural impacts/change.Defined habitats contain a large range of life history strategies, which provides some insightinto the dynamic but variable physical nature of <strong>Solomon</strong> Island seagrass habitats. E. acoroidesis a slow turnover, persistent species with low resistance to perturbation (Walker et al., 1999),suggesting that there are some coastal habitats that are quite stable over time. Cymodocea andSyringodium are seen as intermediate genera that can survive a moderate level of disturbance,while Halophila and Halodule are described as ephemeral species with rapid turnover and highseed set, well adapted to high disturbance and high rates of grazing (Walker et al., 1999).Therefore the species present in the different habitats reflect the observed physical andbiological impacts, suggesting that reef, deep water and coastal environments are particularlyvariable and dynamic, while estuarine/lagoonal habitats have stable areas but are extremelyharsh.The capacity of seagrasses to recover requires either recruitment via seeds or throughvegetative growth. The recovery of tropical seagrasses depends on the species and location.Some plants are fairly resilient in unstable environments. The ability of seagrass meadows torecover from large scale loss of seagrass cover observed during major events such as cycloneswill usually require regeneration from seed bank (Campbell & McKenzie 2004). Chronic levelsof sediment as well as higher exposure levels during river flood events may reduce growth andreproductive effort, important processes in the recovery of seagrass meadows after disturbanceby turbidity and freshwater runoff (Waycott et al. 2005).In many areas, it is difficult to estimate changes in seagrass because the maps of the distributionof seagrasses area and biomass are still imprecise. Support for continued extensive mapping ofseagrasses studies similar to the present one is commendable. This will help to betterunderstand the anthropogenic and climatic factors that drive changes in seagrass meadows.Precise mapping of seagrass meadow parameters (at appropriate scales) will enable changes tobe more accurately measured and tracked.All identified seagrass habitats have high ecological and/or economic value, whether supportingfisheries or biodiversity. Estuary/lagoonal and coastal habitats are considered to be the mostthreatened, due to extensive coastal development, however the limited knowledge of deeperwater seagrass habitats suggests that impacts to these habitats are extremely difficult todetermine.MANGROVESRhizophora stylosa had the most extensive distribution, was the most abundant species andtended to dominate habitat types along the coastlines. Generally, Rhizophora stylosa is apioneering species that is often found on mud flats and on islands in tidal estuaries. Bunt and438
Seagrasses and MangrovesWilliams (1980) found that Rhizophora spp. emerged as predominant close to the lower tidallimit. Rhizphora stylosa is often associated with Avicennia, Ceriops and Bruguiera (Claridgeand Burnett 1993), as was found in the present survey. Lumnitsera was also found associatedwith Rhizophora spp.Rhizophora spp. contributes greatly to primary productivity in estuaries through litter fall, andsecondary productivity, with prop roots contributing complex structural habitat, or “snags”.Snags provide suitable habitat for many juvenile fish (protection from predatory fish) and adultfish (hiding spaces for ambush).Avicennia marina was not common and was found at northern Isabel sites. A. marina hasefficient salt secreting mechanisms and tends to be more dominant in higher salinity areas(Scholander et al. 1962; Waisel, et al. 1986). The closed Rhizophora stylosa forest thatdominated much of the coastlines may have inhibited the establishment of A. marina.Other remaining species known from the <strong>Solomon</strong> <strong>Islands</strong> mangrove species were notencountered as they are found more commonly further upstream in estuaries. The upstreamenvironment is more protected from wave energy and currents, and most of these speciesrequire some freshwater input, or grow along the landward edge or margin of mangrove forests(Claridge & Burnett 1993; Dowling & McDonald 1982).Youssef & Saenger (1999) suggested that specific segregation of species is the outcome of thecumulative interaction between different environmental gradients on one-hand and toleranceboundaries of each species to each particular gradient on the other. Zones of mangroves speciesare a response of individual mangrove species to the gradients of inundation frequency,waterlogging, nutrient availability and soil salt concentrations across the intertidal area(Hutchings & Saenger, 1987).The number of mangrove species recorded in this survey was low compared with previousrecords, as only the fringing mangroves of coastlines were surveyed, so mangrove speciesgrowing along the more landward edges of wide bands of mangrove forests or high tide regionswere missed. While this survey indicates that the riparian zone appears to be relatively healthy,the area is subject to several threats. Human activities that may affect water quality andmangrove health.ThreatsThe major changes in <strong>Solomon</strong> Island seagrass meadows would have occurred post World WarTwo and are related to coastal development, agricultural land use, or population growth. Ingeneral though there is insufficient information and no long-term studies from which to drawdirect conclusions on historic trends. Munro (1999) reported that 2000 year old mollusc shellmiddens in neighbouring PNG have basically the same composition as present day harvestssuggesting indirectly that the habitats including seagrass habits and their faunal communitiesare stable and any changes occurring are either short term or the result of localised impacts. Itcan be assumed that the same could be concluded for the <strong>Solomon</strong> <strong>Islands</strong>.These localised impacts are likely to be from soil erosion related to coastal agriculture (e.g.,coconut plantations), land clearing (e.g., logging and mining) and bush fires. Other effectsinclude sewage discharge (human and agriculture), industrial pollution, port/villageinfrastructure/dwellings and overfishing. Most of these impacts can be managed withappropriate environmental guidelines, however climate change and associated increase in stormactivity, water temperature and/or sea level rise has the potential to damage seagrasses in theregion or to influence their distribution. Sea level rise and increased storm activity could lead to439
<strong>Solomon</strong> <strong>Islands</strong> <strong>Marine</strong> <strong>Assessment</strong> Technical Reportlarge seagrasses losses. Mangrove swamps, particularly those of low islands, are likely to besensitive to sea-level rise. The response of mangroves to climate change is uncertain, andresearch and monitoring is required.To provide an early warning of change, long-term monitoring sites have been established nearGizo as part of Seagrass-Watch, Global Seagrass Monitoring Network (www.seagrasswatch.orgMcKenzie et al. 2005). The program hopes to expand to include other regions of the <strong>Solomon</strong><strong>Islands</strong>. By working with both scientists and local communities, it is hoped that manyanthropogenic impacts on seagrass meadows which are continuing to destroy or degrade thesecoastal ecosystems and decrease their yield of natural resources can be avoided.Recommended Actions• Promote seagrass and mangrove conservation in the Pacific <strong>Islands</strong> as they have had alow priority in conservation programs in the region.• More protected areas to be established, to ensure that examples of seagrass andmangrove ecosystem remain in the <strong>Solomon</strong> <strong>Islands</strong> for use by future generations• Legislation for the protection of mangroves needs to be enforced.• Seagrass and mangrove conservation values need to be enhanced by development ofeducation resource materials, to be used in schools and community groups• A Pacific Island monitoring program of seagrass and mangrove ecosystem health needsto be established. This could be linked to existing region/global monitoring programs(e.g., Seagrass-Watch, www.seagrasswatch.org) for monitoring climate change/sealevel rise impact.• Detailed maps of seagrasses are needed in locations which are highly threatened bypoor water quality (e.g., Marovo Lagoon).• Detailed surveys and studies on dugong/turtle-seagrass distribution based on the knownseagrass habitats identified in this survey.• Studies on importance, ecology, and population dynamics of subsistence fisheries (e.g.,rabbit fish) which seagrass/mangrove ecosystems supportAcknowledgementsWe are grateful to Louise Goggin (CRC Reef), Ivan Rotu Peoko and Tingo Leve for theirassistance in the field surveys. We thank Stu Shepard (TNC) for providing the basemaps andGIS support, the crew of the “FeBrina” – skipper Russell Slater, and our boatman Elijah for hisboating skills and patience. We also thank Rudi Yoshida for his assistance with data entry/management.This survey was funded by TNC and the David & Lucile Packard Foundation and supported byCRC Reef and the Department of Primary Industries & Fisheries, Queensland.440
Seagrasses and MangrovesReferencesBlaber, JM and Milton, DA (1990) Species composition, community structure, andzoogeography of fishes of mangrove estuaries in the <strong>Solomon</strong> Islnads. <strong>Marine</strong> Biology105: 259-267.Bunt, J.S. and Williams, W.T. (1980). Studies in the analysis of data from Australian tidalforests (‘Mangroves’). I. Vegetational sequences and their graphic representation.Australian Journal of Ecology 5: 385-390.Carruthers TJB, Dennison WC, Longstaff BJ, Waycott M, Abal EG, McKenzie LJ and LeeLong WJ. (2001). Seagrass habitats of north east Australia: models of key processesand controls. Bulletin of <strong>Marine</strong> Science 71(3): 1153-1169.Campbell SJ and McKenzie LJ. (2004) Flood related loss and recovery of intertidal seagrassmeadows in southern Queensland, Australia. Estuarine, Coastal and Shelf Science 60:477 – 490.Claridge, D. and Burnett, J. (1993). Mangroves in Focus. Wet Paper. 160pp.Clough, B.F. (1992). Primary productivity and growth of mangrove forests. In “Coastal andEstuarine Studies - Tropical mangrove ecosystems”(Eds. A.I. Robertson and D.M.Alongi), Chapter 8, pp 225-250.Coles RG and Kuo J (1995) Seagrasses. Chpt 3 In <strong>Marine</strong> and Coastal biodiversity in thetropical islands Pacific region. Vol 1: Species systematics and information managementpriorities. Proceedings of two workshops held at the East-West Center, Honolulu, inNovember 1994. (JE Maragos, MNA Peterson, LG Eldredge, JE Bardach and HFTakeuchi eds) (East-West Center, Honolulu) Pp 39-57.Coles RG and Lee Long WJ (1999) Seagrass. Chpt 2 In <strong>Marine</strong> and Coastal biodiversity in thetropical islands Pacific region. Vol 2: Population, development and conservationpriorities. Proceedings of two workshops held at the East-West Center, Honolulu, inNovember 1994. (LG Eldredge, JE Maragos, PF Holthus and HF Takeuchi eds) (East-West Center, Honolulu) Pp 21-46.Coles RG, McKenzie LJ and Campbell SJ. (2003). The seagrasses of eastern Australia. Chapter11 In: World Atlas of Seagrasses. (EP Green and FT Short eds) Prepared by the UNEPWorld Conservation Monitoring Centre. (University of California Press, Berkeley.USA). Pp 119-133.Costanza, R, D'Arge, R., de Groot, R., Farber, S. Grasso, M., Hannon, B. Limburg, K. Naeem,S., O'Neill, R.V., Paruelo, J. Raskin, R.G.; Sutton, P. and van den Belt, M. (1997). Thevalue of the world's ecosystem services and natural capital. Nature 387 (15 May), 253-260.Dowling, R.M. and McDonald, T.J. (1982). Mangrove Communities of Queensland In“Mangrove Ecosystems of Australia – Structure, function and management” (Ed B.F.Clough) Chapter 5, pp 81-93.Duke, N.C. (1992). Mangrove floristic biogeography. In “Coastal and Estuarine Studies -Tropical mangrove ecosystems”. (Eds A.I. Robertson and D.M. Alongi) Chapter 4, pp63-100.Dance SK, Lane I and Bell JD. (2003) Vairation in short-term survival of cultured sandfish(Holothuria scabra) released in mangrove-seagrass and coral reef flat habitats in<strong>Solomon</strong> <strong>Islands</strong>. Aquaculture 220: 495-505.Duke, NC, Bell, Pederson ADK, Roelfsema CM, Bengtson Nash S. (2005) Herbicidesimplicated as the cause of severe mangrove dieback in the Mackay region, NEAustralia: consequences for marine plant habitats of the GBR World Heritage Area<strong>Marine</strong> Pollution Bulletin 51: 308–324Ellison, JC. (1999) Status report on Pacific Island mangroves. In Eldridge, LG., Maragos, JE.,Holthus, PF. And Takeuchi, HF (Eds) <strong>Marine</strong> and Coastal biodiversity in the tropicalIsland Pacific region: Volume 2: Population, development and conservation priorities.Proceedings of two workshops held at the East-West Centre, Honolulu, in November1994. (Pacific Science Association, Honolulu) Chapter 1. pp2-19.441
<strong>Solomon</strong> <strong>Islands</strong> <strong>Marine</strong> <strong>Assessment</strong> Technical ReportEllison, JC. (1995) Systematics and distributions of Pacific Island mangroves. In Maragos, JE.,Peterson, MN., Eldridge, LG., Bardach, JE. and Takeuchi, HF (Eds) <strong>Marine</strong> andCoastal biodiversity in the tropical Island Pacific region: Volume 1: Speciessystematics and information management priorities. Proceedings of two workshopsheld at the East-West Centre, Honolulu, in November 1994. (East-West Centre,Honolulu) Chapter 4. pp59-74.Green E and FT Short (eds) 2003 World Atlas of Seagrasses. Prepared by the UNEP WorldConservation Monitoring Centre. (University of California Press, Berkeley. USA).298pp.Halliday, I.A. and Young, W.R. (1996). Density, biomass and species composition of fish in asubtropical Rhizophora stylosa mangrove forest. <strong>Marine</strong> and Freshwater Research47(4): 609-615.Hansell, JRF and Wall, JRD (1976) Land resources of the <strong>Solomon</strong> Islnds. In Vol 1,Introduction nd recommendations. Land Resources Study 18, Land Resources Division,Ministry of Overseas Development, London.Hutchings, P. and Saenger, P. (1987). Ecology of Mangroves. (Queensland University Press,Brisbane) 388pp.Johnstone, I.M. (1982) Ecology and distribution of seagrasses. In: Biogepgraphy and ecologyof New Guinea (J.L. Gressitt ed). Monographiae Biologicae Vol 42. (Dr W JunkPublishers, The Hague). Pp 497-512.Kwanairara, DE. (1992) Country report mangrove forests of the <strong>Solomon</strong> <strong>Islands</strong>. In T.Nakamura (ED) Proceedings Second Seminar and Workshop on Integrated Research onmangrove ecosystems in Pacific <strong>Islands</strong> Region. (Japan International Assocition ofmangroves, Tokyo). Pp169-173.Lovelock, C. (1993). Field Guide to Mangroves in Queensland. (Australian Institute of <strong>Marine</strong>Science, Townsville). 72pp.Lanyon, J.M., Limpus, C.J. and Marsh, H. (1989). Dugongs and turtles: grazers in the seagrasssystem. In 'Biology of Seagrasses: A treatise on the biology of seagrasses with specialreference to the Australian region'. A.W.D. Larkum, A.J. McComb and S.A. Shepherd(Eds). Elsevier: Amsterdam, New York. pp. 610-34.McKenzie LJ, Finkbeiner MA and Kirkman H. (2001). Methods for mapping seagrassdistribution. Chapter 5. In: Global Seagrass Research Methods. (FT Short and RGColes eds) (Elsevier Science B.V., Amsterdam). Pp 101-122.McKenzie, LJ., Yoshida, RL., Coles, RG. & Mellors, JE. (2005). Seagrass-Watch.www.seagrasswatch.org. 144pp.Mellors, J.E. (1991). An evaluation of a rapid visual technique for estimating seagrass biomass.Aquatic Botany 42, 67-73.Mercier, A, Battaglene, SC & Hamel1, JF. (2000) Periodic movement, recruitment and sizerelateddistribution of the sea cucumber Holothuria scabra in <strong>Solomon</strong> <strong>Islands</strong>.Hydrobiologia 440: 81–100.Messel, H and King W. (1989) Report on CITES and <strong>Solomon</strong> <strong>Islands</strong>:Government nationalsurvey of crocodile populations in the <strong>Solomon</strong> Island, 20 July-8 September. IUCN,Switzerland.Munro JL (1999) Utilization of coastal molluscan resources in the tropical Insular Pacific andits impacts on biodiversity. In: <strong>Marine</strong>/Coastal biodiversity in the tropical island Pacificregion: Vol 2: Population, development and conservation priorities. Workshopproceedings, Pacific Science Association. (JE Maragos, MNA Peterson, LG Eldredge,JE Bardach, HF Takeuchi eds). (East-West Center, Honolulu) Pp 127-144Nietschmann, B.Q., Norris, T.B., Rose, R.S., and Roswell, J.M., 2000, Coral world map (scale1:28,510,000) and virtual reefscape poster, In Williams, R.S., Steele, J., deBlij, H.J.,and Nietschmann, B.S., eds., National Geographic Society: Committee for Researchand Exploration, Washington, D.C.Robertson, A.I., Alongi, D.M. and Boto, K.G. (1992). Food chains and carbon fluxesIn“Coastal and Estuarine Studies - Tropical mangrove ecosystems”. (Eds. A.I.Robertson and D.M. Alongi), Chapter 10, pp 293-326.442
Seagrasses and MangrovesRönnbäck, P. (1999). The ecological basis for economic value of seafood production supportedby mangrove ecosystems, Ecological Economics 29(2): 235-252.Saenger, P., Hegerl, E.J. and Davie, J.D.S. (Eds.) (1983). Global status of mangroveecosystems. Environ. 3 (Suppl. 3) 88.Schaffelke B, Mellors JE and Duke NC. (2005) Water quality in the Great Barrier Reef region:responses of mangrove, seagrass and macroalgal communities. <strong>Marine</strong> PollutionBulletin 51: 279–296Scholander, P.F., Hammel, H.T., Hemmingsen, E.A. and Garety, W. (1962). Salt balance inmangroves. Plant Physiology 37: 722-729.Scott, DA (1993) A directory of wetlands in Oceania. International Waterfowl and WetlandsResearch Bureau, Slimbridge, U.K., and Asian Wetland Bureau, Kuala Lumpur,Malaysia.Skilleter, G.A. and Warren, S. (2000). Effects of habitat modification in mangroves on thestructure of mollusc and crab assemblages. Journal of Experimental <strong>Marine</strong> Biologyand Ecology 244 (1): 107-129.Spalding, MD., Blasco F. and Field CD. (Eds) (1997) World Mangrove Atlas. (TheInternational Society for Mangrove Ecosystems, Okinawa), Japan 178 pp.Walker DI, Dennison WC, Edgar G (1999) Status of Australian seagrass research andknowledge. In: Seagrass in Australia: Strategic review and development of an R & Dplan. (A Butler and P Jernakoff eds) (CSIRO, Collingwood). Pp 1-24.Waycott M.,McMahan K., Mellors, JE., Calladine, A. and Kleine, D. (2004) A guide to tropicalseagrasses of the Indo-west Pacific. (JCU Press, Townsville)72pp.Waycott M, Longstaff BJ and Mellors JE. (2005) Seagrass population dynamics and waterquality in the Great Barrier Reef region: A review and future research directions.<strong>Marine</strong> Pollution Bulletin 51: 343-350.Womersley HBS and Bailey A. (1969) The marine algae of the <strong>Solomon</strong> <strong>Islands</strong> and their placein biotic reefs. Phil. Trans. Roy. Soc. B 255:433-442.Waisel, Y., Eshel, A., Agami, M. (1986). Salt balance of leaves of the mangroves Avicenniamarina. Plant Physiology 67: 67-72.World Resources Institute (1996). World Resources 1996-1997 Oxford University Press,Oxford. The World Resources Institute, UNEP, UNDP, World Bank 365pp.Youssef, T. and Saenger, P. (1999). Mangrove zonation in Mobbs Bay – Australia. Estuarine,Coastal and Shelf Science. 49A: 43-50.443
June 2006TNC Pacifi c Island CountriesReport No 1/06<strong>Solomon</strong> <strong>Islands</strong>GovernmentChapter 8Oceanic Cetaceans& Associated Habitats<strong>Solomon</strong> <strong>Islands</strong> <strong>Marine</strong> <strong>Assessment</strong>Benjamin KahnAPEX Environmental445
Published by: The Nature Conservancy, Indo-Pacific Resource CentreAuthor Contact Details:Benjamin Kahn: P.O. Box 59 Clifton Beach, Cairns 4879 QLD Australia.e-Mail: bkahn@apex-environmental.comSuggested Citation:Kahn, B. 2006. Oceanic Cetaceans and Associated Habitats. In: Green, A., P. Lokani, W. Atu,P. Ramohia, P. Thomas and J. Almany (eds.) 2006. <strong>Solomon</strong> <strong>Islands</strong> <strong>Marine</strong> <strong>Assessment</strong>:Technical report of survey conducted May 13 to June 17, 2004. TNC Pacific Island CountriesReport No. 1/06© 2006, The Nature ConservancyAll Rights Reserved.Reproduction for any purpose is prohibited without prior permission.Design: Jeanine AlmanyArtwork: Nuovo DesignCover Photo: © Benjamin Kahn, APEX EnvironmentalAvailable from:Indo-Pacific Resource CentreThe Nature Conservancy51 Edmondstone StreetSouth Brisbane, QLD 4101AustraliaOr via the worldwide web at: www.conserveonline.org446
Oceanic Cetaceans & Associated HabitatsCONTENTSExecutive Summary............................................................................................................................................448Introduction ........................................................................................................................................................452The Cetaceans of the <strong>Solomon</strong> <strong>Islands</strong>..............................................................................................................452<strong>Solomon</strong> <strong>Islands</strong> Cetacean Species and Habitats............................................................................................ 453The <strong>Solomon</strong> <strong>Islands</strong> <strong>Marine</strong> <strong>Assessment</strong>’s Contribution to the ‘Cetacean Data Gap’.....................454Limitations of the SI Cetacean REA .................................................................................................................. 455The Goals for the SI Cetacean REA................................................................................................................... 455Survey Methods................................................................................................................................................... 456Visual Cetacean <strong>Assessment</strong>..................................................................................................................................456Acoustic Cetacean <strong>Assessment</strong> ............................................................................................................................. 457Cetacean Activities and Other <strong>Solomon</strong> <strong>Islands</strong> <strong>Marine</strong> <strong>Assessment</strong> Components ...........................458Passages Between Sites – Visual Cetacean Survey .........................................................................................458Long Passages Between Sites and <strong>Islands</strong> – Visual and Acoustic Cetacean Survey .............................458Anchored on Site – Canvassing of Local Community Knowledge on Cetaceans.................................459Other Activities - Large <strong>Marine</strong> Life Sightings (Non-Cetacean) .............................................................459Results and Discussion................................................................................................................................... 459Visual Survey Results...............................................................................................................................................459SI Cetacean REA Results Corrected for Active Survey Effort - Time and Distance..........................463Acoustic Cetacean Survey Results .......................................................................................................................463Cetacean Species Associations – Multi-Species or Mixed Groups...........................................................465Environmental Conditions During the Si Cetacean Rea ........................................................ 465Sighting Conditions .................................................................................................................................................465Acoustic Listening Conditions .............................................................................................................................465Non-Cetacean Sightings........................................................................................................................................ 466traditional Dolphin Hunters of Malaita.........................................................................................468The Fanalei and Bita ’Ama Communities .......................................................................................468Other SI Cetacean REA Activities ...........................................................................................................475SI Cetacean REA visit to the Gavutu captive dolphin facility .................................................................... 475International live dolphin export trade..............................................................................................................476Potentially Significant Cetacean-Fisheries Interactions: The SI Purse Seine Tuna Fishery............477Potential for Cetacean Watching in the <strong>Solomon</strong> <strong>Islands</strong> .................................................. 478Recommendations .............................................................................................................................................. 479Capacity Building for Improved National and Local Cetacean Expertise ..............................................479Addressing the Knowledge Gap on SI Cetaceans – A National Approach...........................................480Short-Term Projects to Address the Knowledge Gap................................................................................... 481Identifying Important Cetacean Habitats for Protective Management.................................................. 481Conservation Options – <strong>Marine</strong> Corridors and Local Dolphin Resting Lagoons...............................482Traditional Dolphin Drives - Fanalei.................................................................................................................484The Case for SI to Become a Signatory State of CITES..............................................................................485Acknowledgements ........................................................................................................................................... 487References ...............................................................................................................................................................488Tables ..........................................................................................................................................................................491Figures....................................................................................................................................................................... 497Appendices................................................................................................................................................................510447
<strong>Solomon</strong> <strong>Islands</strong> <strong>Marine</strong> <strong>Assessment</strong> Technical ReportExecutive SummaryThe <strong>Solomon</strong> <strong>Islands</strong> <strong>Marine</strong> <strong>Assessment</strong> – Oceanic Cetaceans and Associated Habitats wasconducted from 10 May to 16 June 2004. Because of the broad and multi-faceted nature ofthe <strong>Solomon</strong> Island <strong>Marine</strong> <strong>Assessment</strong>’s activities and goals, this program was not designedas a dedicated cetacean survey. As such the <strong>Solomon</strong> Island <strong>Marine</strong> <strong>Assessment</strong> could notaddress certain species- or habitat-specific conservation and management issues for cetaceans– such as the estimation of relative abundances (which can only be estimated through morestructured and periodic surveys). Instead, this program was structured as a Rapid Ecological<strong>Assessment</strong> on <strong>Solomon</strong> <strong>Islands</strong>’ oceanic cetaceans and associated habitats (the SI CetaceanREA) and included the following activities:1. To conduct a visual and acoustic survey on <strong>Solomon</strong> <strong>Islands</strong>’ whale and dolphinspecies diversity, distribution, ranking of total individual count and their associatedhabitats (near shore, yet deep-water);2. To canvass community knowledge on local cetacean sighting patterns, strandings andcetaceans’ role in cultural heritage and folklore;3. To conduct an on-board capacity building program on cetaceans for local scientistsand marine conservationists;4. To assist with the identification of migratory corridors of national and regionalimportance, as well as other critical cetacean habitats;5. To strengthen national conservation policies for large cetaceans and marine biodiversityin general;6. To evaluate the potential for sustainable and responsible (sperm) whale and dolphinwatch activities.The SI Cetacean REA was conducted during 36 survey days in the central and westernprovinces of the <strong>Solomon</strong> <strong>Islands</strong> and included 160.0 hours of visual survey time, covering1228.1 nautical miles. Cetaceans were sighted on 52 separate encounters in which 815animals were counted, belonging to 10 species. The species sighted include (ranked bysighting frequency): Spinner dolphin (Stenella longirostris); Pantropical spotted dolphin(Stenella attenuata); Common bottlenose dolphin (Tursiops truncatus); and single sightingsfor the Indo-Pacific bottlenose dolphin (Tursiops aduncus); Orca or killer whale (Orcinusorca); Risso's dolphin (Grampus griseus); Rough-toothed dolphin (Steno bredanensis); Shortfinnedpilot whale (Globicephala macrorhynchus); Mesoplodon beaked whale (Mesoplodonsp.); Rorqual baleen whale (Balaenoptera sp. – either the common Bryde’s or Sei whale; B.brydei or B. borealis respectively).Acoustic surveys included 49 offshore listening stations. In total, cetacean presence wasacoustically detected on 51% of all listening stations. Sperm whales (Physetermacrocephalus) were positively identified acoustically, bringing the total of species for the SICetacean REA to 11. Acoustic contacts were dominated by oceanic dolphins, followed bysperm whales. Both sighting frequencies and counts of individuals were dominated (>95%)by the same 3 species: spinner dolphins, common bottlenose dolphins and spotted dolphins.Sighting and acoustic results were corrected for survey effort and an initial comparison withsimilar REAs in other regions was made. There were unfavourable sighting conditions duringa substantial number of days. These were spread evenly over all SI Cetacean REA Legs.The SI Cetacean REA visual and acoustic results strongly indicate a relatively low cetaceanspecies diversity and relative low abundance throughout most of the western <strong>Solomon</strong><strong>Islands</strong>’ provinces, at least during the SI Cetacean REA period. In several areas, however,spinner and spotted dolphins were locally abundant. This outcome needs to be furtherinvestigated, as – when confirmed by additional dedicated cetacean surveys - it hassignificance for management of cetacean use and fisheries interactions. Issues highly relevantto the <strong>Solomon</strong> <strong>Islands</strong> are the traditional dolphin drives, the licensed live dolphin captures448
Oceanic Cetaceans & Associated Habitatsfor tourism ventures (for local ‘swim with the dolphins’ programs and trade/internationalexport), and possibly the large-scale tuna purse-seine tuna fisheries in <strong>Solomon</strong> <strong>Islands</strong>’waters.Throughout the survey, local knowledge on cetaceans proved very valuable. Many coastalcommunities, such as the Shortlands and Savo Island, have important spinner dolphin restingareas at their local reef lagoons. These preferred dolphin habitats seem stable for exceptionallong periods and often have been known to villagers for over five generations. Responsible,well regulated, wild cetacean watching may be feasible in these locations (and presumably inmany more similar areas and communities not visited by the <strong>Marine</strong> <strong>Assessment</strong>.Traditional dolphin hunting villages of Fanalei and Bita ‘Ama were also visited. In Fanalei,elders explained that the traditional dolphin drive is practiced with strong cultural heritage andminimal modernisation in fishery methods. Essentially, dolphins are driven from the oceaninto the local reef lagoon by creating an “acoustic net” through strategic placement of canoesaround the pod and well-timed banging of rocks underwater. The aftermath of a recentcapture of spotted dolphins for a live-display facility did cause significant disturbanceamongst the village and this modern influence may not be easily integrated within anotherwise largely traditional community.Although the traditional dolphin drives in Fanalei are largely non-modernized, several aspectsraise serious concerns. The long-term disappearance of the valued melonheaded whales (roboau) in local waters, the increased effort due to population growth and new market forcesclearly indicate that depletion of SI marine mammal resources can and does happen. Hence,additional dedicated cetacean surveys need to be conducted by the SI Government todetermine the sustainability of the traditional dolphin drives, and ultimately, to ensure thepreservation of the unique cultural heritage of the SI.The Bita’ Ama community (a second village with a history of traditional dolphin drives) hasnot hunted dolphins for numerous years. All dolphin hunting canoes – which are different inwood type and design from fishing canoes - are in a state of deterioration. Preparations arebeing made by elders to build new canoes and resume traditional dolphin hunting in thenorthern Indispensable Strait within 2 years.Important cetacean habitats that have been identified are reef lagoons, especially for spinnerdolphins, and the northern Indispensable Strait region, where, according to communityknowledge, large baleen whales are common seasonally. After detailed interviews with eldersfrom Bita ‘Ama it seems that the most likely species involved are blue whales. Otheranecdotal sighting information also strongly indicates that blue whales are present in thesewaters. If confirmed, the Indispensable Strait region, as well as several other narrow yet deepisland passages in the western <strong>Solomon</strong> Seas, are likely to function as marine migratorycorridors for large cetaceans. Such corridors (also called migratory bottlenecks) are oftenused by multiple species of large migratory marine vertebrates - including cetaceans, marineturtles, sharks, billfish and tuna - and have already been recognised to be of regionalconservation importance in several other nations of the Indo-Pacific.<strong>Marine</strong> corridor conservation can be effectively achieved via habitat-based managementframeworks including multi-use <strong>Marine</strong> Protected Areas. Key issues for corridorconservation in the Indo-Pacific include fisheries interactions; especially gill and/or driftnetting practices in or near corridors which may effectively cordon off a passage. Because ofthe seasonal migrations of whales, dolphins and other migratory marine life, even shortperiods of intensive fishing with gillnets in the vicinity of corridors can result in verysignificant by-catch and entanglement rates. Overall, management measures may varysubstantially between corridor sites and ideally are incorporated within long-termmanagement plans.449
<strong>Solomon</strong> <strong>Islands</strong> <strong>Marine</strong> <strong>Assessment</strong> Technical ReportOn several occasions during the SI <strong>Marine</strong> <strong>Assessment</strong> specific reef lagoon areas wereidentified where spinner dolphins were known to ‘rest’. These sites were often known bylocal communities for many generations, indicating long-term site fidelity. In these locationscommunity-based marine management approaches, in collaboration with provincial andnational government agencies, may be an effective management framework to ensure theseimportant dolphin habitats are conserved, and where feasible, regulate any economicopportunities such as local dolphin watching activities.At the Arnavon <strong>Islands</strong> <strong>Marine</strong> Protected Area, the complete skeleton of a previously strandedfalse killer whale, Pseudorca crassidens, was located on a remote beach. With help of theConservation Officers, the bones and skull were transported to the Arnavon research station.The 6m skeleton was assembled into an educational display at the station’s entrance.Furthermore, the Arnavons central location in the Manning Strait (one of the major marinecorridors of the <strong>Solomon</strong> <strong>Islands</strong>), in combination with on-going marine conservation projectsand trained staff which are permanently on-site, mean that conservation activities (i.e.monitoring) on whales and other large migratory marine life could be implemented relativelycost-effectively.The Gavutu live-capture dolphin facility was visited, and included a detailed tour andinspection. The main business of the facility is a local ‘swim-with-dolphin tourism’ ventureand international export of dolphins. The recommendations of a recent IUCN SpeciesSurvival Commission report on the facility and dolphin trade were brought forward duringdiscussions with staff. In addition, an indirect – and unintended - effect of the facility may beover-exploitation of local fish stocks due to high daily food requirements for the dolphins, aswell as price incentives to local fishermen.Key recommendations focus on additional cetacean surveys, ecological research, training andpolicy. In particular, SI would benefit from additional cetacean surveys to estimate relativeabundance for cetacean species of interest and to further identify and confirm high priorityareas for conservation. In order to address the knowledge gap on SI cetaceans, it is vital toimprove the local expertise and build capacity for long-term cetacean survey and ecologicalresearch programs in the <strong>Solomon</strong> Seas. A national cetacean workshop with field-orientedtraining components has been agreed upon by <strong>Marine</strong> <strong>Assessment</strong> stakeholders as an effectivetool to address this. Areas of interest for possible follow-up cetacean training, survey andresearch activities include: The Gizo/New Georgia Group, Malaita, Indispensable Strait,Florida <strong>Islands</strong>, Fauro (Shortlands), and the St. Cruz <strong>Islands</strong> – the latter being the vast easternmostprovince of the SI. St. Cruz province has exceptional oceanic habitat diversity andconsistent anecdotal sightings of large whales (including sperm whales and orcas). Due tologistical constraints St. Cruz was not part of the area of interest for the <strong>Solomon</strong> <strong>Islands</strong><strong>Marine</strong> <strong>Assessment</strong>.Lastly, SI would benefit from becoming a signature state of the Convention of InternationalTrade of Endangered Species (CITES). CITES is an internationally recognized mechanism tosustainably manage wildlife trade in endangered species, including cetaceans. By joiningCITES the <strong>Solomon</strong> <strong>Islands</strong> would improve CITES coverage and effectiveness and in doingso would be welcomed by the wider international community. In addition, <strong>Solomon</strong> <strong>Islands</strong>export a considerable quantity of fauna. While most SI species as reported by CITES maysustain such a trade, there are several cases where CITES has recommended a ban on importsof several species from the <strong>Solomon</strong> <strong>Islands</strong>. By not being a CITES member, the <strong>Solomon</strong><strong>Islands</strong> has no mechanism to officially oppose such trade restrictions.The <strong>Solomon</strong> <strong>Islands</strong> <strong>Marine</strong> <strong>Assessment</strong> provided a good basis for these recommendations.In addition to the significant collection of cetacean data, it increased awareness and activeparticipation amongst key government and non-government stakeholders, and assisted with450
Oceanic Cetaceans & Associated Habitatsthe development of local capacity that may be involved in future projects on <strong>Solomon</strong> <strong>Islands</strong>’diverse whale and dolphin species and habitats.451
<strong>Solomon</strong> <strong>Islands</strong> <strong>Marine</strong> <strong>Assessment</strong> Technical ReportIntroductionTHE CETACEANS OF THE SOLOMON ISLANDSThe limited scientific literature, in combination with traditional knowledge and anecdotalrecords, suggests that cetaceans are relatively frequently observed in <strong>Solomon</strong> <strong>Islands</strong>’ waters.Based on combined sighting information reported for the <strong>Solomon</strong> <strong>Islands</strong>, Papua NewGuinea, wider Melanesia and eastern Indonesia, it is likely that over 30 species of whales anddolphins inhabit the waters under <strong>Solomon</strong> <strong>Islands</strong>’ national jurisdiction (Table 1). Thismeans that more than one third of all known whale and dolphin species worldwide can befound in the <strong>Solomon</strong> Island Seas, including residential, migratory and endangered cetaceanspecies (IUCN 2003).However, despite the numerous and major advances in marine science for the tropical Indo-Pacific region, the lack of information on the ecology and conservation status of whales anddolphins – and their associated coastal and offshore habitats - is one of the largest ‘knowledgegaps’ concerning the marine biology of this exceptionally diverse part of the world’s oceans.This is especially so for the waters of the <strong>Solomon</strong> <strong>Islands</strong>. According to the IUCN SpeciesSurvival Commission – Cetacean Specialist Group (CSG), numerous whale and dolphinspecies which occur in the <strong>Solomon</strong> <strong>Islands</strong> are considered data-deficient on the taxonomic,species, stock and population level (Ross et al. 2003, R. Reeves pers. comm.).The <strong>Solomon</strong> <strong>Islands</strong> have a narrow continental shelf, and as a result its overall length of the200m isobath (4600 km) is only marginally longer than its coastline. This means that oceaniccetaceans and their associated pelagic and deep-sea habitats (>2000m) are often locatedrelatively close to shore. This combination of coastal-oceanic habitat diversity and proximityto shore creates opportunities for marine (mammal) resource conservation and management(Hyrenbach et al. 2000, Kahn and Pet 2003, Kahn 2001a, 2003, Fortes et al. 2003, Malakoff2004, Hoyt 2004).Several whale species that are known or suspected to occur in the <strong>Solomon</strong> Seas are IUCNlisted as vulnerable (humpback, sperm, ‘Pacific’ blue whales) or endangered species (i.e. fin,‘Antarctic’ blue whales, sei whales). Vital information for management such as stockstructure and population estimates and dynamics are virtually non-existent. A similarsituation exists for local species diversity and distribution and ecology. A very limitednumber of scientific studies have been done in these waters on cetacean species diversity,distribution and relative abundance (the latter can only be estimated through structured andperiodic surveys), and none on species-specific cetacean ecology and habitat use (seeAppendix 1 for a shortlist of relevant references).Cetaceans in the Asia-Pacific are thought to be vulnerable to the region's ever-increasingcoastal and marine resource usage (IUCN 2003). These range from broad region-wide issuessuch as:• fisheries by-catch,• chemical pollution and• habitat destruction (including impacts of deforestation on coastal cetacean habitats,and presumably to a lesser extent, noise pollution from seismic oil and gasexploration, military/navy activities involving sonar, shipping)to more specific <strong>Solomon</strong> <strong>Islands</strong> issues such as:452
Oceanic Cetaceans & Associated Habitats• The licensed live-capture trade of catching and exporting bottlenose dolphins (T.aduncus) in SI waters for local and international cetacean displays and ‘swim-withthedolphins’ tourism venues. The <strong>Solomon</strong> <strong>Islands</strong> policy to develop a sustainableexport industry for SI’s cetacean resources has been detailed in governmentstatements (Kile and Watah 2003). A recent export in 2003 to Mexico received widespreadattention from international regulatory bodies such as CITES as well as thescientific and civil community. To avoid any misunderstandings on this complexissue, the IUCN’s Species Survival Commission – Cetacean Specialist Group andVeterinary Specialist Group deployed a joint fact-finding team in late 2003, with theassistance of the SI government, and its report is publicly available (Ross et al. 2003).This SI Cetacean REA was not designed nor conducted to address any of these issuesspecifically (see section: Limitations of the SI Cetacean REA), and this paper willreport on the SI Cetacean REA’s field activities and outcomes. However, it isimportant to note that in early 2005, the government of the <strong>Solomon</strong> <strong>Islands</strong>announced a complete ban on further exports of dolphins. A joint declaration by theMinister for Fisheries and <strong>Marine</strong> Resources and the Minister for Forests,Environment and Conservation detailed that this new policy is effective immediately(see Appendix 5).• The status of the traditional dolphin drives on Malaita and Makira <strong>Islands</strong> (seeSection C for a detailed account).The preparations for the <strong>Solomon</strong> <strong>Islands</strong> <strong>Marine</strong> <strong>Assessment</strong> – Oceanic Cetaceans andAssociated Habitats component (the SI Cetacean REA) included the sourcing and review ofnumerous papers and technical reports related to the survey area (Appendix 1). Thesedocuments were further analysed to produce a preliminary species list for the <strong>Solomon</strong> <strong>Islands</strong>and (where possible) to shortlist potential cetacean habitats and other points of interest duringthe <strong>Solomon</strong> <strong>Islands</strong> <strong>Marine</strong> <strong>Assessment</strong>. However, a more detailed literature review wasbeyond the scope of this project.SOLOMON ISLANDS CETACEAN SPECIES AND HABITATSA preliminary cetacean species list for the <strong>Solomon</strong> <strong>Islands</strong> includes resident and migratoryspecies; several rare, vulnerable and/or endangered whale species - including blue, Bryde’s,sperm, and beaked whales; as well as numerous coastal and oceanic dolphin species (Fam.Balaenopteridae, Physeteridae, Kogiidae, Ziphiidae and Delphinidae respectively – Table 1).The preliminary cetacean species list for the <strong>Solomon</strong> <strong>Islands</strong> is very similar to that ofIndonesia (Rudolph et al. 1997). This may be expected as both nations are tropical Asia-Pacific archipelagos with similar coastal and oceanic cetacean habitats.It seems likely that cetaceans are an important component of coastal and oceanic ecosystemsin the national and EEZ waters of the <strong>Solomon</strong> <strong>Islands</strong> (Reeves et al. 1999). Cetaceanhabitats may include <strong>Solomon</strong> <strong>Islands</strong>’ major rivers (although no riverine species are knownto occur in the SI at this date), mangroves as well as its diverse coastal habitats. Open oceanenvironments include many oceanic islands, oceanic fronts and upwellings, seamounts,guyots, canyons, deep-sea trenches and the water column itself. These diverse habitats areoften in close proximity to one another because of the <strong>Solomon</strong> <strong>Islands</strong>’ narrow continentalshelf, abundant oceanic islands and extreme depth gradients. Examples of cetacean habitatswithin the <strong>Solomon</strong> <strong>Islands</strong> <strong>Marine</strong> <strong>Assessment</strong> (SI MA) survey route included coastal‘hotspots’ for whales and dolphins, local communities engaged in traditional dolphin drivefisheries and narrow yet deep island passages that are known or suspected to function asmigratory corridors of regional significance (WWF 2003).453
<strong>Solomon</strong> <strong>Islands</strong> <strong>Marine</strong> <strong>Assessment</strong> Technical Report<strong>Solomon</strong> <strong>Islands</strong> <strong>Marine</strong> CorridorsFrom a broader – and regional - marine conservation perspective, data on cetacean speciesdiversity, distribution, relative abundance, species-specific sighting frequencies, totalindividual counts and ecology is also crucial when considering the location and complexoceanography of the survey area. The <strong>Solomon</strong> <strong>Islands</strong> are one of the few equatorial regionsworldwide where hemispherical oceanic exchange of a wide variety of marine life occurs.Cetacean movements between the South Pacific and North Pacific are known or suspected(depending on the species) to occur through the major island passages of the <strong>Solomon</strong><strong>Islands</strong>’ archipelago, such as Indispensable Strait, Bougainville Strait - separating the<strong>Solomon</strong> <strong>Islands</strong> from Papua New Guinea (PNG), Manning Strait and New Georgia Sound(also known as The Slot). The ecological significance of these passages as migration corridorsfor whales and dolphins (and other large migratory marine life) remains poorly understood(but see Kahn et al. 2000, Kahn 2002a and 2003, Kahn and Pet 2003 for more on marinecorridors in the Indo-Pacific).Yet <strong>Solomon</strong> <strong>Islands</strong>’ cetaceans which include these passages in their local or long-rangemovements may be increasingly vulnerable to numerous regional and local environmentalimpacts such as habitat destruction, subsurface noise disturbances, net entanglement, marinepollution and over-fishing of marine resources (Hofman 1995, Fair and Becker 2000, Gordonand Moscrop 1998). At least some of these impacts on cetaceans are known to occur in thewaters of the <strong>Solomon</strong> <strong>Islands</strong> (IUCN 2003, Local government officials, pers. comm.). Theseimpacts would affect residential whale and dolphin populations as well as several endangeredmigratory species (such as the sperm, blue and fin whale - Physeter macrocephalus,Balaenoptera musculus and B. physalus respectively) which may include these passages intheir long-range movements.This is of special concern in the <strong>Solomon</strong> <strong>Islands</strong>, where a strictly limited number of deepinter-island channels are suspected to function as migration corridors for cetaceans. Thesepassages have considerable ecological significance and conservation value:1. The <strong>Solomon</strong> <strong>Islands</strong>’ (SI) straits and passages may form an important migrationcorridor network for large cetaceans travelling from the southern and northern partsof the Pacific Ocean, and may even travel to the Indian Ocean via the easternIndonesian Seas, and vice versa. In addition, residential whale and dolphinpopulations are also likely to use these corridors as part of their home range.2. The SI straits and passages are also likely to function as sensitive bottlenecks tonumerous other species of large migratory marine life such as green, hawksbill andleatherback sea turtles, tuna and billfishes, as well as elasmobranchs such as mantarays and (whale) sharks.Local activities such as destructive fishing practices and gill/drift netting near these straits canresult in regional environmental impacts on cetacean populations and affect large marineecosystem dynamics (Agardy 1997, Kahn et al. 2000, Kahn 2003, Perrin et al. in press).THE SOLOMON ISLANDS MARINE ASSESSMENT’S CONTRIBUTION TO THE ‘CETACEAN DATA GAP’To better understand and manage the <strong>Solomon</strong> <strong>Islands</strong>’ (SI) cetaceans, scientists andmanagers need to obtain information about their diversity and distribution, life histories -including their feeding and breeding habits, long and short-term movements, the locations oftheir critical habitats, how they use each habitat, when they travel between them and theroutes the various species take - as well as current and emerging threats.454
Oceanic Cetaceans & Associated HabitatsThis data is difficult and costly to obtain for most marine mammals, even for developednations with ample resources, let alone for the <strong>Solomon</strong> <strong>Islands</strong>. Therefore, the <strong>Solomon</strong><strong>Islands</strong> <strong>Marine</strong> <strong>Assessment</strong> presented a valuable opportunity to make a significantcontribution to address this knowledge gap and increase the understanding of the diverseassemblage of cetacean species in these remote waters of the tropical western Pacific.Importantly, the <strong>Solomon</strong> <strong>Islands</strong> <strong>Marine</strong> <strong>Assessment</strong> – Oceanic Cetaceans and AssociatedHabitats (the SI Cetacean REA) component included the involvement of the <strong>Marine</strong><strong>Assessment</strong>’s community team, as the local communities were a key data source. Through theinformal on-board capacity building of local scientists and conservationists, the SI CetaceanREA also contributed to improved local cetacean expertise and promoted the possibleestablishment of long-term cetacean conservation programs in the <strong>Solomon</strong> <strong>Islands</strong> (seeRecommendations, below).LIMITATIONS OF THE SI CETACEAN REAIt must be noted that because of the broad and multi-faceted nature of the <strong>Solomon</strong> <strong>Islands</strong><strong>Marine</strong> <strong>Assessment</strong>’s activities and goals 1 , this program could not be designed as a dedicatedcetacean survey. As such the SI Cetacean REA could not address species- or habitat-specificconservation and management issues – such as the estimation of relative abundances - whichcan only be estimated through more structured and periodic cetacean surveys. The SICetacean REA’s modus operandi had to be adjusted to accommodate for the complex day-todayschedule of various site visits as well as logistical limitations. Another factor limitingspecies-specific outcomes of the SI Cetacean REA was the relatively short time scale of theproject. Hence, certain key issues (i.e. regarding tourism and traditional dolphin drives) needto be further investigated. For example, management of the export trade of dolphins for thelive-display and ‘swim-with-captive-dolphins’ tourism programs must rely on accurateestimates of stock boundaries and population abundance of the species targeted. This type ofdata can best be obtained through multiple dedicated surveys and longer-term ecologicalresearch on particular cetacean populations. A similar situation may apply to the traditionaldolphin drives – a unique cultural heritage for the SI (see also Sections C and D of thischapter). The SI Cetacean REA provided a good basis for such work: in addition to thesignificant biological data, it has increased awareness and active participation amongst keygovernment and non-government stakeholders, promoted the establishment of long-termcetacean survey and research programs, and assisted with the development of local capacitythat may be involved in future projects.THE GOALS FOR THE SI CETACEAN REAThe SI Cetacean REA goals were to:1. Conduct visual and acoustic surveys of the <strong>Solomon</strong> <strong>Islands</strong>’ whale and dolphinspecies diversity, distribution, ranking of species-specific sighting frequencies andtotal individual count and their associated habitats;2. Assist with the identification of near-shore yet deepwater habitatsthat may be of significance to oceanic cetaceans and associated pelagic deep-seaspecies (i.e. canyons, knolls, seamounts, trenches, upwelling zones);3. Assist with the identification of migratory corridors of nationaland regional importance, as well as other critical habitats;4. Identify, and assess, wherever possible, interactions with coastaland pelagic fisheries (small and large scale);5. Assist with the identification, and assessment of current oremerging threats to cetaceans;1 see <strong>Solomon</strong> <strong>Islands</strong> <strong>Marine</strong> <strong>Assessment</strong>, this report455
<strong>Solomon</strong> <strong>Islands</strong> <strong>Marine</strong> <strong>Assessment</strong> Technical Report6. Use visits to coastal villages to canvass community knowledge onlocal cetacean sighting patterns, strandings, and cetaceans' role incultural heritage and folklore;7. Conduct an on-board capacity building program on cetaceans forlocal scientists and marine conservationists and improve awareness throughparticipatory field work and hands-on training (i.e. research techniques; cetaceanspecies identification at sea; ecology, conservation and management issues);8. Assist with the identification of opportunities for nationalcetacean conservation and management strategies; SI Cetacean REA outcomes maybe incorporated in national programs, regional initiatives and internationalconventions of relevance to cetaceans. 29. Assist with the identification of potential sites with economicopportunities for responsible cetacean watching. The development of possible spermwhale watching has already been indicated to be of national interest by the SIgovernment.Survey MethodsThe visual and acoustic cetacean survey component during the SI Cetacean REA was carriedout from 10 May 3 – 16 June 2004 on the live-aboard the MV FeBrina, a purpose build 22mdive vessel with long range live-aboard capacity. The field work was conducted for a total of36 sea days.VISUAL CETACEAN ASSESSMENTWhile underway between daytime anchorages or longer-range passages, an expert cetaceanobserver (BK) conducted visual surveys of the surrounding waters. The sighting efforts bythe observer were further assisted by the vessel’s captain and to a lesser extent the other<strong>Solomon</strong> <strong>Islands</strong> <strong>Marine</strong> <strong>Assessment</strong> participants. The majority of sighting efforts were madefrom the bridge deck area, which increased observer height to approximately 5m above sealevel.Regular scanning of the surrounding seas with marine binoculars (35x8 Steiner Commander)further increased the visual survey range. Once cetaceans were sighted or a possible cueobserved more than once, the vessel's course and speed was adjusted to allow for a discreetapproach and close observation.For each sighting, a positive species identification (ID) was made whenever conditions andanimal behaviour allowed this to be done safely and with minimal disturbance. Otherstandard data recorded for each sighting included: Date and time; GPS location and areadescription; species identified and any cetacean species associations, group size(s) andcomposition - including the presence of newborn calves; distance from vessel; direction oftravel when first sighted; any natural markings; occurrence of 10 behavioural categories –including feeding, resting, bow riding, aerials, avoidance and data on other behavioursobserved; surface interval and dive durations whenever possible; photo; video data whenever2 Programs and organizations include the SI’s National Biodiversity Strategic Action Plan (NBSAP),South Pacific Regional Environment Programme (SPREP), South Pacific Commission (SPC) andIUCN Species Survival Commission (SSC) Cetacean Action Plans, as well as various internationaltreaties such as the Conventions on Biodiversity and Migratory Species – CBD and CMS);3 These dates include two additional cetacean survey days, as counted from the Papua New Guinea –<strong>Solomon</strong> <strong>Islands</strong> (PNG-SI) border to Honiara, Guadalcanal during the relocation passage of the surveyvessel FeBrina, prior to the start of other <strong>Solomon</strong> <strong>Islands</strong> <strong>Marine</strong> <strong>Assessment</strong> activities.456
Oceanic Cetaceans & Associated Habitatspossible; and sighting condition (a 1-5 ranking of the overall visual conditions for spottingcetaceans, incorporating sea state, ambient light, rain and other weather factors).A Canon 300 Rebel Digital EOS, equipped with a 70-300mm optically stabilized lens, wasused to obtain photo-identifications of individual animals with distinctive colourations, marksor scars. Photographs were used to 'mark' individuals during most sightings and for themajority of cetacean species encountered. These photographic data are crucial for longertermecological focus research including studies on local movements/site fidelity andpopulation/stock assessments. In addition, a Panasonic CCD MZ-350 professional digitalvideo camera was also frequently used to record the diversity of cetacean species and surfacebehaviours.ACOUSTIC CETACEAN ASSESSMENTDuring off-shore routes the visual surveys were complimented by periodical acoustic listeningstations using either omni-directional or directional custom VHLF hydrophones (20Hz-20kHz) connected to a custom-made amplifier equipped with multi-channel high/low passfilters. Detection range for sperm whales was estimated to be 8-10 nm in good conditions,whereas the detection range for smaller cetaceans was estimated to be 2-3 nm. In order tominimise any coastal interference, the acoustic assessment was conducted once the vessel waslocated 4 or more nautical miles offshore. Listening stations were conducted at least 8 nauticalmiles apart, depending on daily schedules and offshore conditions. Digital audio recordingsof cetacean vocalizations were recorded with a Sony Portable MiniDisc Recorder (MZ-R70)during several stations.Each listening station was conducted for at least five minutes, after which the following datawas recorded: Date and time, GPS location and area description; position of high and lowpass audio filters; any acoustic contact with cetaceans 4 ; direction of contact (priority speciesonly); species identification (when applicable), abundance estimate (when applicable);listening conditions (a 1-5 ranking of the overall audio quality of listening stationincorporating sea state, vessel and ambient noise); and the recording’s segment numbers.The acoustic survey component is especially valuable to locate priority cetaceans such assperm whales and other deep-diving oceanic cetaceans. These animals spend the majority oftime underwater, and thus while present in the surveyed area, are not often seen at the surface.However, these same species routinely echolocate and/or communicate underwater duringforaging dives and the hydrophones are able to detect (and locate) the clicks and othervocalizations from most odontocete (toothed whales and dolphins) cetacean species.In addition to data on presence/absence of cetaceans within the estimated listening range, theacoustic assessment can also provide more detailed data for each listening station including:species identification; group size estimates; indications of foraging and/or social behaviours;and determination of local (underwater) movement patterns by conducting acoustic trackingactivities. The acoustic survey results are important for comparative analysis between andwithin sites over time. However, during the SI Cetacean REA the collection of speciesspecificdata was restricted due to operational constraints.After the visual and acoustic data collection was completed for each cetacean encounter andlistening station, the vessel would depart from the area slowly and return to the predeterminedroute. Routes were occasionally adjusted to allow for all <strong>Solomon</strong> <strong>Islands</strong> <strong>Marine</strong><strong>Assessment</strong> activities to be conducted at maximum effectiveness, as well as environmental4 Depending on the species heard, positive identifications can be made and abundance categoriesestimated from these acoustic assessments of cetacean presence in the proximity of the vessel.457
<strong>Solomon</strong> <strong>Islands</strong> <strong>Marine</strong> <strong>Assessment</strong> Technical Reportfactors such as unfavourable currents and/or winds. A more extensive description ofmethodologies and data analysis has been described elsewhere (Whitehead and Kahn 1992;Kahn et al. 1993; Kahn et al. 2000; Kahn and Pet 2003).CETACEAN ACTIVITIES AND OTHER SOLOMON ISLANDS MARINE ASSESSMENT COMPONENTS – coraldiversity and health status, reef fish, sea grass, commercial species, community interviewsThe majority of cetacean activities were conducted when the vessel was underway. Transittime is usually ‘down-time’ for coastal (reef and sea grass) field assessments and ‘up-time’for cetacean surveys. Thus interference with other (mostly site-based) activities was minimal.Some additional travel distance was necessary during longer periods in transit (i.e. passages)to identify any cetacean species seen or pass closer to associated habitats (i.e. canyons,seamounts) that were located nearby the original route. While on-site, the cetaceancomponent of the <strong>Solomon</strong> <strong>Islands</strong> <strong>Marine</strong> <strong>Assessment</strong> also had strong links with thecommunity-based activities (see below). The surveying and boat-handling techniques wereespecially designed to cause minimal disturbance to cetaceans while allowing for discrete andclose observations.PASSAGES BETWEEN SITES – VISUAL CETACEAN SURVEYDuring these relatively short inter-site transfers a visual cetacean survey was conducted.The <strong>Solomon</strong> <strong>Islands</strong> <strong>Marine</strong> <strong>Assessment</strong> travelled along large sections of the <strong>Solomon</strong><strong>Islands</strong>’ coastline that lack a significant continental shelf and include diverse deep-seahabitats close to shore (i.e. canyons, knolls, seamounts, trenches). This route presented aclear opportunity to do cetacean work, as such extreme habitat proximity from coastal tooceanic ecosystems, has yielded substantial whale and dolphin sightings in other comparableareas of the Asia-Pacific region where cetacean surveys have been conducted. During the<strong>Solomon</strong> <strong>Islands</strong> <strong>Marine</strong> <strong>Assessment</strong>, both coastal as well as more oceanic cetacean specieswere encountered relatively close to shore.LONG PASSAGES BETWEEN SITES AND ISLANDS – VISUAL AND ACOUSTIC CETACEAN SURVEYThe passages between the major islands of the <strong>Solomon</strong> <strong>Islands</strong> are known or suspectedmigratory corridors for oceanic cetaceans as well as other large migratory marine life.Constant visual surveys from the upper deck and opportunistic acoustic ‘listening stations’were conducted to assess this key habitat. During listening stations an easily deployeddirectional hydrophone was lowered in the water. The stations took approximately 5-10minutes and were usually spaced 2-3 hours apart depending on vessel speed and travelschedule. Acoustic contacts with cetaceans were digitally recorded, depending on seaconditions.Because of logistical restraints it was not possible to switch from survey mode to trackingmode. Priority species such as sperm whales may be tracked acoustically once detected(usually during a deep foraging dive of approximately 45 min). This would result in closerange observations during their surface intervals (approx. 8-10 min, a pod usually consists of4-12 individuals who may all surface in the same general area). Once sperm whales are heardon the hydrophone, it routinely takes 1-2 hours before close observations (
Oceanic Cetaceans & Associated Habitats1990). Thus, the routine listening stations provided valuable data for the SI Cetacean REA onsperm whales and other species; whether or not acoustic contacts are followed-up by trackingand/or subsequent sightings.ANCHORED ON SITE – CANVASSING OF LOCAL COMMUNITY KNOWLEDGE ON CETACEANSThe SI Cetacean REA included a strong linkage with the <strong>Solomon</strong> <strong>Islands</strong> <strong>Marine</strong> <strong>Assessment</strong>community team when making landfall during site visits. The team assisted with efforts tocanvass local knowledge on cetaceans for the majority of coastal SI communities visited.This was done with relative ease by incorporating several questions on cetaceans during theroutine request to the village elders to be allowed to conduct marine assessment activities inlocal waters. Six questions were of particular interest to a) fill the data gap on cetaceans andb) assist with the identification of conservation issues and strategies:1. Are there any areas of consistent whale and/or dolphin sightings known in the local area,and if so are these seasonal?2. What are the local names for the species seen, and how would the local community rankthese according to perceived local abundance category for each species (i.e. fromcommon to rare)?3. Is there any information available on whale strandings (live or dead, single or group) inthe local area? When, where and what ultimately happened to the animal(s)?4. Are there any fisheries interactions with cetaceans in local waters? This includes positiveinteractions such as fishermen using schools of dolphins as a proxy for tuna and otherlarge pelagics, as well as (by-)catch and depredation (stolen catch) by cetaceans.5. Is there significant historical, traditional or modern usage of cetacean products in thecommunity or local area?6. Do cetaceans feature in the community’s cultural heritage (i.e. storytelling, legends, andmyths)?Depending on such information on cetaceans, the proximity of deepwater habitats nearby andavailability of tenders, a quick assessment of local waters was conducted from the tender at alimited number of sites. In addition, assistance with the in-water survey activities of thecoral, reef fish and commercial species teams was given, including underwater photo andvideo recordings of species and activities of interest.OTHER ACTIVITIES - LARGE MARINE LIFE SIGHTINGS (NON-CETACEAN)While underway, sighting details for other large (and often migratory) marine life wererecorded on a separate ‘non-cetacean’ data sheet (i.e. all marine turtles, manta rays, [whale]sharks, mola mola, all large billfish and tuna sightings).Results and DiscussionVISUAL SURVEY RESULTSVisual Survey EffortThe SI Cetacean REA was conducted over 36 field days and covered an estimated 1228.1nautical miles (nm) and included 7 of <strong>Solomon</strong> <strong>Islands</strong>’ 9 provinces (Figs 1-4, Table 2). Thesurvey included 160.0 active visual survey hours, spread over 3 habitat zones – coastal,459
<strong>Solomon</strong> <strong>Islands</strong> <strong>Marine</strong> <strong>Assessment</strong> Technical Reportoceanic and straits/corridors (Fig 5a). Daily survey distances ranged between 22.0 and 91.3nm. The majority of survey days covered between 21-40 nm (Fig 5b).Cetaceans where sighted during the majority of the 36 survey days (72.2%, Fig 5c). Sightingfrequencies ranged between1-4 separate encounters per day, totalling 1-3 separate species. Aroutine survey day included 1-2 sightings per day (52.8% of survey days), consisting of 1-2species (63.9% of survey days; Figs 5c-d resp.).During the SI Cetacean REA survey period a total of 10 cetacean species were identifiedvisually in 52 sightings. In addition, sperm whales (Physeter macrocephalus) were identifiedacoustically on 4 occasions (operational restraints restricted the time needed to makesubsequent visual contact), bringing the total species positively identified during the SICetacean REA to 11. All cetacean sighting coordinates were transcribed to a GIS format andassigned species-specific colour-coded data points (Figure 3). Cetaceans were assigned thefollowing general symbols according to taxonomic classification, or occasionally, broadercetacean categories depending on the resolution of the field data.Cetacean species categorySub-order Mysticeti – baleen whalesFamilies Physeteridea and Kogiidae - sperm whalesFamily Ziphiidae - beaked whalesFamily Delphinidae –dolphins (mostly oceanic species)Globicephalinae - a Delphinidae subfamily of six species 5 , similar to the historical‘blackfish’ grouping.Unidentified small cetacean (< 6 metre)Unidentified large cetacean – toothed whale (> 6 metre)Unidentified large cetacean – baleen whale (> 6 metre)Unidentified beaked whale (Fam. Ziphiidae)Symbol••◦The species identified included toothed whales and dolphins (Suborder Odontoceti), baleenwhales (Suborder Mysticeti) as well as the rare and relatively unknown beaked whales (Fam.Ziphiidae). In total, the cetacean species sighted belong to 4 taxonomic families, 9 generaand 11 different species:1. Spinner dolphin (Stenella longirostris)2. Pantropical spotted dolphin (Stenella attenuata)3. Common bottlenose dolphin (Tursiops truncatus)4. Indo-Pacific bottlenose dolphin (Tursiops aduncus)5. Orca (Orcinus orca)6. Risso's dolphin (Grampus griseus)5 The Globicephalinae subfamily is based on a systematic revision of the Delphinidae and includes sixspecies: Feresa attenuata, Peponocephala electra, Globicephala macrorhynchus and G. melas,Pseudorca crassidens and Griseus grampus (LeDuc et al. 1999). It replaces the historical blackfishcategory that includes the majority of these species as well. Globicephalinae sightings are recordedwhen sightings of members of the subfamily can not be identified to species. This occurs infrequentlyand is mostly due to the similarities of P. electra, F. attenuata and juvenile or subadult G. griseus, inparticular during unfavourable sighting conditions.460
Oceanic Cetaceans & Associated Habitats7. Rough-toothed dolphin (Steno bredanensis)8. Short-finned pilot whale (Globicephala macrorhynchus)9. Mesoplodon beaked whale (Mesoplodon sp.)10. Rorqual baleen whale (Balaenoptera sp. – either the common Bryde’s or Sei whale;B. brydei or B. borealis respectively)11. Sperm whale (Physeter macrocephalus – acoustic identification only).An estimated total of 815 individual cetaceans were counted during the 52 separate speciessightings (Table 2). This cetacean count is a known underestimate as only minimal counts ofindividual cetaceans at the surface per sighting were used in the calculation. Because of thenew survey routes each day and significant distances covered each day, the likelihood of‘double counts’ (observing and recording the same dolphins or pods more than once) wasconsidered negligible. The limited photographic identification efforts supported this, as noindividuals were matched between encounters. Comparisons were carried out in near realtimedue to the high-quality digital cameras, equipped with powerful tele-lenses.Sightings were dominated by two species, the spinner dolphin and to a lesser extend thecommon bottlenose dolphin. The sighting frequency (Figure 6) shows that over 80% of allsightings consist of 3 species:Spinner dolphin - Stenella longirostris (55.8 %)Common bottlenose dolphin – Tursiops truncatus (17.31 %)Pan-tropical spotted dolphin - Stenella attenuata (9.62 %)Figure 7 shows that over 90% of the total individual count is due to the same 3 species, albeitin different ranking:Spinner dolphin - Stenella longirostris (68.83 %)Pan-tropical spotted dolphin - Stenella attenuata (12.27 %)Common bottlenose dolphin – Tursiops truncatus (9.20 %)These ranked species-specific sighting frequencies and total individual count results imply arelatively low species diversity and abundance in these waters during the SI Cetacean REAwhen corrected for survey effort (Table 2). In most other Asia-Pacific regions wherecomparable studies have been conducted, the species composition accounting for such a highpercentage routinely consists of at least 5-6 species (Kahn et al. 2000, Kahn 2002a, Kahn andPet 2003, Kahn 2004). It is interesting to note that several oceanic odontocetes known tooccur in the deep-water habitats of the <strong>Solomon</strong> Seas - and often assumed to be relativelycommon here - were not sighted at all during the SI Cetacean REA:Melon-headed whale – Peponocephala electraFraser’s dolphin – Lagenodelphis hoseiPygmy killer whale – Feresa attenuataFalse killer whale – Pseudorca crassidensSperm whale – Physeter macrocephalus (although present in the survey area, as identifiedthrough acoustic contacts)Pygmy and Dwarf sperm whales – Kogia sp.These oceanic odontocetes are either exclusively teuthophagous cephalopod specialists –squid, cuttlefish and octopus - or rely on cephalopods for a substantial part of their diet. Otherspecies with a similar feeding ecology that were sighted include the:Short-finned pilot whales - Globicephala macrorhynchus (n=1)Risso’s dolphin - Grampus griseus (n=1).461
<strong>Solomon</strong> <strong>Islands</strong> <strong>Marine</strong> <strong>Assessment</strong> Technical ReportThis relatively low species diversity and abundance for these oceanic odontocetes mayindicate that the deep-sea waters and habitats surveyed during the SI Cetacean REA perioddid not include pelagic cephalopod prey in high abundance.Interestingly, several cetacean species were sighted during the SI Cetacean REA which areconsidered to be relatively rare in tropical Indo-Pacific waters (as based on the limited surveyefforts in this region):Orcas - Orcinus orca (n=1)Rorqual whales Balaenoptera brydei or B. borealis sp. (n=1)Beaked whales - Mesoplodon sp. (n=1)Rough-toothed dolphins - Steno bredanensis (n=1).Bryde’s and Blue Whales in the <strong>Solomon</strong> SeasIn addition to the whale species visually or acoustically identified above, several reports fromJapanese research and scientific whaling expeditions indicate that SI waters include importanthabitats for Bryde’s (see Appendix 1) and possibly pygmy Bryde’s whales especially(Balaenoptera brydei and B. edeni resp.). Although blue whales (B. musculus) were notencountered during the SI Cetacean REA effort reported here, anecdotal evidence from localcommunities and reported sightings indicate that blue whales inhabit the <strong>Solomon</strong> Seas andits western waters may include important (seasonal) habitats for this endangered whalespecies.Interviews with Bita ’Ama community elders on Malaita Island revealed the presence of ‘verylarge whales’ in the northern section of the Indispensable Strait. Community interviewsidentical to those conducted in Fanalei (positive species identification using a process ofelimination, assisted by illustrated cetacean identification handbooks) strongly suggest thatthese sightings are blue whales (see also Section C). Secondly, FeBrina’s crew reportedlysighted a blue whale ‘mother and calf’ (15:30; 18 June 2004; 9 o 01.6S and 159 o 29.4E, R.Slater, pers. comm.) in The Slot, just west of the Russell <strong>Islands</strong>, which are mid-way betweenGuadalcanal and New Georgia province. These sightings were made outside the SI <strong>Marine</strong><strong>Assessment</strong>, during the vessel’s passage back to Papua New Guinea.It is important to note that in this case the observers had a full 6-weeks of informal cetaceanfield training at that stage and were familiar with species identification procedures at sea (i.e.the process of elimination according to species-specific features and behaviours). Theobservers also had identification experiences with both humpback whales and sperm whales –the only two other species of large whales with tropical ranges to routinely fluke-up upondiving – and these two species were ruled out from the start of their observations.The whales were sighted in windy conditions but in close proximity to the vessel (25 + knots,less than 100m from vessel’s bow) and were clearly visible. Identification features describedinclude an extremely large body size (>23m), tall straight blow, even in the rough conditionsand fluking behaviour upon diving. These and several other reported features all indicated ablue whale mother/calf pair were sighted. In addition, some hours earlier that same dayanother ‘very large whale’ was sighted in the distance and no location or species data could berecorded due to rough sea conditions. The observed travel direction for the whales in bothobservations was estimated to be due south.462
Oceanic Cetaceans & Associated HabitatsSI CETACEAN REA RESULTS CORRECTED FOR ACTIVE SURVEY EFFORT - TIME AND DISTANCE.Visual cetacean results were corrected for survey effort - time and distance actively surveyed.Both corrections produced very similar results, thus only distance (nautical miles ‘on-survey’)will be included here for most parameters. Cetacean sightings per survey day and cetaceanspecies positively identified per survey day averaged 1.44 and 1.14 respectively. Comparablesurveys of priority cetacean areas in eastern Indonesia resulted in maximum values of 8.8 and4.6 resp. (Kahn 2001b, 2002b, 2003, Kahn and Pet 2003, for corrected results from otherregions). The average cetacean sighting rate was 1 sighting per 25 nautical mile surveyed(0.04 sightings/nm). Comparable surveys of priority cetacean areas in eastern Indonesiaresulted in maximum values of 0.17 sightings/nm. Total individual count estimates were alsocorrected for survey effort. An average of 22.64 individual cetaceans were counted per surveyday, and an average of 0.66 cetaceans per nautical mile surveyed (Table 2). Comparablesurveys of priority cetacean areas in eastern Indonesia resulted in maximum values of 385.4individual cetaceans per survey day, and an average of 7.60 cetaceans per nautical milesurveyed. These regional comparisons must be viewed with caution as seasonal andenvironmental differences between survey areas and years must be taken into account. Inaddition, even when observers and methods are identical, several other factors are not (i.e.different vessels - and average vessel speed -, unexpected logistical constraints due toworking in remote areas).However, the SI Cetacean REA results strongly indicate that the waters assessed in the<strong>Solomon</strong> <strong>Islands</strong> may have a relatively low cetacean species diversity and low total individualcount when compared to REAs conducted in eastern Indonesia and northern Papua NewGuinea (i.e. an order of magnitudes less, at least during the SI Cetacean REA period; Kahn etal. 2000, Kahn 1999, 2001b, Kahn 2002b, Kahn and Pet 2003, Kahn unpubl. data for PNG).Visual Survey Results per SI Cetacean REA LegThe effort and summary results of the visual surveys were also compared by survey legs (1-5). Survey legs usually comprised of an area that was covered within a single week and havea similar visual survey effort. (Table 3, Figure 8a-f). The variability between REA legs wasrelatively low for visual survey effort, number of species identified and to a lesser extentvisual conditions (Figure 8a, b and f resp.). Substantial variability between REA legs wasrecorded for species diversity index, sightings/nm and abundance/nm (Figs 8 c, d and e resp.).The latter three parameters all have maximum values in REA leg 4, indicating this legincluded relatively important cetacean habitats for several species.ACOUSTIC CETACEAN SURVEY RESULTSA total of 49 listening stations were conducted during the survey, the majority while thevessel was making passage at night to new islands (Fig 2, 4). Acoustic contact withcetaceans was recorded during 51.02 % of all the listening stations. Sperm whales were heardon 8.16 % of all listening stations with acoustic contacts (Table 4). Acoustic detection rangewas estimated in the field at 6.0 nautical mile (nm) for sperm whales and 2.5 nm for smallodontocetes. Total acoustic coverage was calculated to be 5541.8 nm2 for sperm whales and962.1 nm2 for small cetaceans respectively (Table 4).All coordinates of acoustic contacts with cetaceans during the SI Cetacean REA weretranscribed to a GIS format and assigned symbols according to species categories (Fig 4).Acoustic contacts with cetaceans were analysed in situ for vocalization characteristics andassigned a particular ‘cetacean category’, ranging from a single species which can be clearlydistinguished in the field (such as sperm whales, orcas) to broader species assemblages (i.e.463
<strong>Solomon</strong> <strong>Islands</strong> <strong>Marine</strong> <strong>Assessment</strong> Technical Reportsmall oceanic dolphins from the Fam. Delphinidae, such as spotted, spinner and bottlenosedolphins), which have relatively similar vocalizations and may group together (see speciesassociations). Cetacean categories were assigned when vocalizations could not be confidentlyseparated to the species level in the field (or during subsequent on-board analysis ofrecordings).A total of 53 categories 6 were assigned to the 49 listening stations (4 stations included 2categories, as more than 1 species was detected; sperm whales and oceanic dolphins).Acoustic categories were dominated by ‘oceanic dolphins’ and ‘no contact’ (both 45.3%), andfollowed by ‘sperm whales’ (7.5%) and ‘blackfish’ (1.9%) categories. (Figure 9). Whenselecting only those listening stations on which cetaceans were heard, oceanic dolphins wereagain the most frequently heard (82.76% of all cetacean categories, followed by sperm whales(13.8 %) and blackfish (3.5 %) (Figure 10).The highly distinctive vocalizations or ‘clangs’ (Weilgart 1988) of sexually and sociallymature sperm whale males were not heard (so-called sperm whale bulls, which grow to 18mand are thus much larger than 10-11m females; Table 4). Sperm whale bulls are highlymigratory and prefer cold, high latitude waters, and only infrequently venture into tropicalseas in order to breed (Rice 1989). Frequent acoustic or visual contact with sperm whalebulls in low latitudes may indicate the vicinity of a tropical breeding ground, such as recentlyobserved off Komodo National Park and the Solor-Alor <strong>Islands</strong> in eastern Indonesia (i.e.Kahn 2002b, Kahn and Pet 2003, Kahn 2004).These acoustic survey results for cetaceans in general, and sperm whales in particular, arerelatively low when compared to more extensive survey efforts conducted in East Indonesiaand the Bismarck Sea, northern Papua New Guinea (Kahn et al. 2000, Kahn 1999, 2001b,Kahn 2002b, Kahn and Pet 2003, Kahn unpubl. data). Hence, the overall acoustic results arein accordance with the results of the visual surveys (due to the long dive cycles of manyoceanic species acoustic and visual survey results may differ substantially). These combinedresults strongly indicate that the cetacean diversity and abundance in the coastal and off-shorehabitats surveyed in the western provinces of the <strong>Solomon</strong> <strong>Islands</strong> are both relatively low, atleast for the limited number of survey days reported here.Acoustic Survey Results per SI Cetacean REA LegThe effort and summary results of the acoustic surveys were also analysed by separate surveylegs (1-5). Survey legs usually comprised of an area that was covered within a single week ofthe SI Cetacean REA (Table 4, Figure 11a-d). Both acoustic conditions as well as acousticcontact with all species display relatively low variance between SI Cetacean REA legs. Boththe number of listening stations as well as the acoustic contact with sperm whales displayedmore variability between SI Cetacean REA legs. In the latter case, this is to be expected asthe relatively low abundance of sperm whales, combined with the known social organizationinto clusters of this species, resulted in zero values for the majority of SI Cetacean REA legs.The high value for the PNG-SI leg (50% of all acoustic contacts) is most likely due to theextremely low sample size of that leg (n=2). The low number of listening stations during leg3 is due to a combination of extreme visual and acoustic conditions in completely open waterpassages (see also the sections below on environmental conditions). This caused operationaldifficulties for the <strong>Marine</strong> <strong>Assessment</strong> as a whole.6 Acoustic cetacean categories reflect the best possible identification outcome (ultimately a species)through a process of elimination. As such they are not mutually exclusive. Thus, while all ‘blackfish’are indeed part of the oceanic dolphin family Delphinidae, this does not hold for vice versa. Tomaximize data resolution, when specific vocalizations allowed for the identification of this subfamilyit was recorded.464
Oceanic Cetaceans & Associated HabitatsCETACEAN SPECIES ASSOCIATIONS – MULTI-SPECIES OR MIXED GROUPSThe SI Cetacean REA cetacean survey also recorded the cetacean species association rate.This rate was defined as the simultaneous observation of two or more cetacean species inmixed groups or in close proximity (3-5 were recorded for a substantial number of days (39% of survey days;Figure 13a). The seaworthy and stable vessel (even up to conditions 4) and the high positionof the sighting platform ensured that the effect of these less than ideal survey conditions ondetection rates was kept to a minimum.ACOUSTIC LISTENING CONDITIONSListening stations were ranked according a 1-5 scale, depending on ambient noise andinterference from the ship and tenders. Sighting conditions of less or equal to 4 were notconsidered a major factor influencing acoustic survey efforts. In general, acoustic conditionswere more favourable in May than in June, when the seasonal southeasterly trade windsbecame more frequent and increased in strength.Acoustic listening conditions varied widely during the SI Cetacean REA and were less thanoptimal for a significant part of the survey. Most listening stations (63.3%) were conducted on465
<strong>Solomon</strong> <strong>Islands</strong> <strong>Marine</strong> <strong>Assessment</strong> Technical Reportsurvey days with overall conditions of 2-3 (10-15 knots wind, building seas in open waters).Over 8.1 % of all stations was conducted in category 4 or 5 (20-25 knots wind, high seas inopen waters) and 2.0 % of stations were conducted in near perfect acoustic conditions (Figure13b). Several planned listening stations had to be cancelled altogether during 5 survey days(including several passages) due to extreme weather conditions (Figure 13c, condition >5).Importantly, the acoustic detection of most odontocete (toothed) cetaceans can be optimizedfor each acoustic condition, by selecting different (or no) low and high ‘pass filters’ within theamplifier for each station. Such filters can minimize wave, wind and boat noise when needbe, allowing overall volume to be increased. Appropriate adjustment of (any) filters toprevalent conditions may take 1-2 minutes and ensures that any reduction in the detectionrange remains minimal (according to our field tests with cetaceans and ships detected atknown distances and a gradient of conditions (Kahn unpubl. data). High/low pass filtersettings were recorded for each station.The Arnavon <strong>Islands</strong>: Cetacean Educational Display and Manning Strait Corridor SiteAt the Arnavon Island <strong>Marine</strong> Protected Area, a recent whale stranding was reported by thelocal Conservation Officers. The stranded whale was initially noticed on a remote beach on22 Jan 2004, and was already heavily decomposed at that stage. After 2 hours searching byspeedboat the complete skeleton of a false killer whale Pseudorca crassidens was found. Itsbones and skull were carefully collected and then transported to the Arnavon research station.Here the false killer whale skeleton was re-assembled into a 6m educational display at theentrance to the research station (see Figure 15).Furthermore, the Arnavon’s central location in the Manning Strait (one of the major marinecorridors of the <strong>Solomon</strong> <strong>Islands</strong>), in combination with on-going marine conservation projectsand trained staff which are permanently on-site, mean that conservation activities (i.e.monitoring) on whales, dolphins and other large migratory marine life could be implementedrelatively quickly and cost-effectively.Cetacean strandings reported by communities during the SI Cetacean REASeveral strandings of large cetacean were reported by local communities while the SICetacean REA was in New Georgia waters (Leg 3, Table 4), but no more details were giventhat could assist in species identification. The remote locations of strandings on exposedcoasts (Vangunu) and windy conditions during this period prevented site visits. Thus thespecies and number of animals involved in these strandings could not be determined.NON-CETACEAN SIGHTINGSNon-cetacean sightings during the survey included surface observations during active surveyeffort unless otherwise specified. Sightings include the following species or categories(number of sightings + estimated abundance; comments);• Billfish - marlin or sailfish (3+3);• Marlin - Makaira or Tetrapturus sp.(2+2)• Sailfish - Istiophorus platypterus (1+1)• Mantas - Manta sp. (1 + 12)• Sharks (no data)• <strong>Marine</strong> turtles (no data)466
Oceanic Cetaceans & Associated Habitats• Leatherback turtles - Dermochelys coriacea (1+1)• Leatherback nesting beaches (n=3) – as reported by Fanalei community and otherassessment teams; no data;o SE Malaita (Mabo beach, just to the S of Fanalei – no further data)o Central S coast of St Isabel (approx. 28 turtles/night in season, P. Ramohia,opers. comm.);Rendova – Tetepare S and coast (more information available from WWF<strong>Solomon</strong> <strong>Islands</strong>)• Large yellowfin tuna (1+1)• Dugong - Dugong dugon, as sighted on survey and reported by other assessmentteams (2 +3 [including 1 calf])• Dugong feeding grounds – as reported by Fanalei community – 1 + 20-50; SEMalaita; ‘regular afternoon sightings with high tide’ in coastal bays of NWFanalei/Walande reef lagoon).• Saltwater crocodiles - Crocodylus porosus – as sighted and reported upon by seagrass assessment team (3+3).467
<strong>Solomon</strong> <strong>Islands</strong> <strong>Marine</strong> <strong>Assessment</strong> Technical ReportTraditional Dolphin Hunters of Malaita.THE FANALEI AND BITA ’AMA COMMUNITIESThe <strong>Solomon</strong> <strong>Islands</strong> <strong>Marine</strong> <strong>Assessment</strong> route in Malaita was specifically planned toinclude visits to two traditional dolphin hunting villages:• Fanalei on SE Malaita with hunting grounds in the coastal and open waters adjoiningthe western Pacific and• Bita ’Ama on NW Malaita, with (currently inactive) hunting grounds in the coastaland open waters of the northern parts of Indispensable Strait, connecting the <strong>Solomon</strong>Seas to the western Pacific.The practices and cultural heritage of the dolphin hunters of Malaita are relatively welldocumented in the scientific literature and other more anecdotal reports. Numerousbackground papers were analysed prior to the <strong>Solomon</strong> <strong>Islands</strong> <strong>Marine</strong> <strong>Assessment</strong> and thecommunity interviews. A literature review of these papers would be valuable, yet is beyondthe scope of the <strong>Solomon</strong> <strong>Islands</strong> <strong>Marine</strong> <strong>Assessment</strong> report (see Appendix 1 for short listedreferences).Community InterviewsCommunity members of these two unique coastal communities were interviewed to recordtheir traditional knowledge in, and experience with, the traditional <strong>Solomon</strong> <strong>Islands</strong>’ dolphinhunt. In addition, an assessment of the degree of modernisation was made whenever possible.Interviews were not focused on other national and international issues and conservationconcerns associated with this fishery. Thus questions where geared towards communityknowledge, traditional values and changes in historical catch per unit effort (H-CPUE). Inaddition, extensive interview experience with another community of traditional sea hunters inLembata, east Indonesia - who target sperm whales (see Barnes 1996, Kahn 2002b, 2003) -was used to ensure a neutral demeanour was given to all questions and traditional values werehonoured.The Traditional Dolphin Drives off FanaleiIn Fanalei, elders explained that the traditional dolphin drive is practiced with strong culturalheritage and minimal modernisation in the fishery. Essentially, the fishery is based on anacoustic drive technique. Dolphins are driven from the ocean into the local reef lagoon bycreating an “acoustic net”, through strategic placement of canoes around the pod and welltimedbanging of rocks underwater. Certain species of small cetaceans can thus be controlled- primarily spotted dolphins and to a lesser extend spinner dolphins - and driven towards arelatively narrow (approximately 100m), yet deep channel between the outer islands of thereef lagoon (Figure 15 c-d).The traditional methods as practiced in Fanalei seemed completely intact. Canoes are dug-outwithout outriggers, and are fully traditional with no modern influences or modifications. Inaddition, communication at sea during the hunt has not been modernised. A traditionalsystem of flags and hand signals continues to be used at sea to signal when and wheredolphins have been sighted and to coordinate the hunt. This coordination of the dolphin driveis crucial and requires exceptional skills, leadership and teamwork of all involved, often forlong periods (6-12 hours) and under difficult conditions. While at sea, the canoes’ distance468
Oceanic Cetaceans & Associated Habitatsfrom land is measured according to landmarks that are just visible – beach, palm trees, land,open sea – and each distance category has a specific term in the local language.Outboards are not used as the noise under water alarms the dolphins and gives the boats’position away, thereby reducing the element of surprise used to startle the dolphins whenclapping the stones underwater. Outboard engines are also not used for any scouting trips.The dolphin school is driven from open ocean through a narrow reef passage and into thelagoon. Then the dolphins are further herded towards a sheltered mangrove bay, which isclosed off with a net once the dolphins have entered. The dolphins are then pulled into thecanoes one by one, killed with knives and transported by canoe to the village for furtherprocessing. The teeth especially are considered essential for wedding dowries and are also ahighly valuable commodity (teeth function as money in the village, throughout Malaita and inother selected parts of the <strong>Solomon</strong> <strong>Islands</strong>), as is the meat for local consumption. As thispractice is fairly well-documented (i.e. Takekawa 1996 a-c, see Appendix 1), the drivemethods and cultural significance of the hunt are not discussed in further detail in this report.Both villages were informed prior to arrival of the survey vessel by the community liaisonteam and outreach programs. Because of time constraints of the <strong>Solomon</strong> <strong>Islands</strong> <strong>Marine</strong><strong>Assessment</strong>, only several hours were spend in each village. Not all village elders werepresent as most people were on the Malaita mainland tending to farmlands. Six seniorpersons with extensive knowledge (often passed on for generations) and long-term experiencein traditional dolphin drives were available for the interview:• Mr. Ernest Afia – Elder of the Malaqualo tribe who were the ‘original founders of theFanalei dolphin hunt more than 100 years ago’ (The Fanalei community is made up ofsix separate tribes).• Mrs. Elisabeth Au (wife of Fanalei village leader Mr. Joseph Au).• Unnamed elders (2) and community members (2) with extensive experience in thedrive.The interview was predominantly held with Mr. Afia and Mrs. Au with frequent input andagreement from the other community members present. The interview was structured in 4components.1. Catch and effort data, which included questions on:2. Species diversity and group abundance in the hunting grounds.• Species targeted as well as others that are not easily controlled by traditional drivingmethods.• Key behaviours of target and non-target species.• Successful drives per season.• Catch composition.• Group sizes per catch (‘normal’ and ‘maximum’).• Seasonal or/and annual trends in these components.• Trends in whale and dolphin sightings and behaviours (with an emphasis onbehaviours indicative of feeding and migration).3. Dolphin hunt techniques• Equipment and manpower involved.• Activities prior, during and after the hunt.• Securing of the catch in lagoon waters.4. Use of dolphin products– teeth and meat.• Catch processing.• Market values.469
<strong>Solomon</strong> <strong>Islands</strong> <strong>Marine</strong> <strong>Assessment</strong> Technical Report• Distribution and role of teeth in community traditions.• Area of trading (village, island or/and inter-island scales).• Other sources of teeth.• Strandings.• Trade with commercial fishers.5. Indications of modernisation of traditional techniques.Key Outcomes of the Interview with Fanalei Elders and Other Community MembersAs mentioned above, the practices and cultural heritage of the dolphin hunters of Malaita arerelatively well documented in the scientific literature and other more anecdotal reports. Thusthis section focuses on outcomes of the interviews without providing much context. Detailedbackground papers can be found in Appendix 1.Traditional names of Fanalei cetaceansTraditional names for numerous cetacean species were recorded and then assigned to aparticular species by using illustrated cetacean reference and identification books (Fig 15d).The majority of traditional names mentioned during the interview were identical to thoserecorded by previous researchers (Table 1).Dolphins – KirioSpinner dolphin – RaaSpinner dolphin (offshore small body) – Raa matakwaSpinner dolphin (offshore, robust body) – Subo raaPantropical spotted dolphin – UnbuluStriped dolphin – Robo tetefaCommon dolphin (Dephinus sp.) – Rabo manoleMelonheaded dolphin - Robo au/ Robo tafungaiFraser’s dolphin – not known (Takekawa 1996b in Appendix 1 notes that the name robo aumay also apply to Fraser’s dolphin teeth but this could not be verified).Bottlenose dolphin - Olo folosiFalse killer whale – Ga ia roboRisso’s dolphin – Gwon muduBeaked whales – SaoLarge whale – Busu asiDugong – Ia tekwaHunting season and effortThe Fanalei dolphin hunting season is from January – April and coincides with seasonalperiods of calm weather. During these months the men of the village go out in their smallwooden canoes (without outriggers) every day. The season is sometimes extended into Maydepending on fair weather. During the remainder of the year no hunting is done and the mainactivity of the men and women is tending to their crops on small parcels of farmland onmainland Malaita.An average season would include 8-10 successful drives. The number of animals that can becontrolled during the acoustic drive is highly variable between days and seasons. Dolphingroups of 20-40 animals are routinely caught. Groups of 200-300 animals are caught withsome regularity and occasionally a group may consist of an estimated 700 individualdolphins. On these rare occasions that such a large group can be successfully controlled andcaught, it takes the villagers all night to kill and process the dolphins. Estimated numbers of470
Oceanic Cetaceans & Associated Habitatsdolphin catches for each Jan.-April hunting season were given by Fanalei elders as ‘mixed’species - spinner and spotted dolphins (Raa and unbulu, respectively):2004 - 6002003 - 12002002 - 7002001 - no data2000 - 8001999 - 7001965 - 2000 (mentioned as a record year for this generation)Cetacean sightings off FanaleiThe local names, occurrence and relative frequency of cetaceans sighted during the Fanaleidolphin drive season is given in Table 1. As expected – and in accordance with the SICetacean REA visual survey results - the most common sightings are of spinner, spotted andbottlenose dolphins. Various other species of oceanic odontocetes are sighted butinfrequently. Comments by elders and other community members on key species for Fanaleiincluded:• Unbulu (spotted dolphins) – easy to control, reacts predictably to the noise made duringthe hunt, often playful. Groups often include 200 animals; groups of 700 individualsoccur infrequently (1-2 sightings/season).• Raa (spinner dolphins) – much more difficult to hunt than unbulu, a large pod wouldconsist of approximately 200-300 individuals, but routinely a group would include 50animals.• Robo teta or tetefa (striped dolphins) – similar in group size to unbulu, but have beensighted much less frequent in the area for many years.• Robo au (melon-headed whales) – has not been sighted in the area (‘finished’) for manydecades. The last generation who hunted Robo au were the grandfathers of the eldersinterviewed. As the elders interviewed approached or exceeded 50 years of age, it seemsreasonable to assume the period of Robo au drives was approximately 100-125 years ago.They were considered common then and catches of 1000/drive were achieved, albeitoccasionally. It appears this species is now exceptionally rare or even extirpated fromFanalei waters (and possibly populations are significantly reduced throughout the<strong>Solomon</strong> Seas).• Gwon mudu (Risso’s dolphins) – occasionally sighted and sometimes targeted for thedrive fishery with success. However, this is rarely done. A large group would consist of14 animals but more often a group would consist of 3-5 animals.• Ga ia robo (false killer whales) – sighted occasionally, but never hunted as they do notreact to the noise and dive under the canoes to open sea.• Pilot whales are not seen (or possibly wrongly identified as false killer whales).• Orcas – infrequently sighted. Interestingly, a single large male has been seen during 3consecutive seasons and it is thought to be the same animal. This orca is said to ‘harasspeople’ and approaches the canoes and dives under them. The hunters are afraid of thisbehaviour and will scatter when the orca is sighted, even if that means heading out furtherto sea. The appearance of the orca will disrupt and halt any drive activities for as long asthe animal is in the general area.• Sao (beaked whales) - sighted sporadically, but are never hunted.• ‘Whales’ are sighted with regularity and often include periods of whale sightings ‘forseveral days at a time’, followed by periods of no whale sightings in the hunting grounds.Interestingly, the hunters do not differentiate between different baleen whale species.471
<strong>Solomon</strong> <strong>Islands</strong> <strong>Marine</strong> <strong>Assessment</strong> Technical Report• The sperm whale does not seem to be known and has not been sighted at all in the Fanaleiarea – despite the relatively deep water nearshore, and its distinctive and easilyrecognizable blow, body shape and diving behaviours.The elders explained that the Fanalei and Walande people originated from northern Malaita –where dolphin drives were practiced at the time – and later migrated to the Sa’a region ofMalaita. Here they continued the dolphin drive practice. Their skills were especially valuableas the land in the Sa’a area was already owned and occupied by other tribes, so the‘newcomers’ had to settle on the relatively barren islands without much freshwater. Theislands were also harder to approach and lessened the chance of attack by the other tribes.These islands proved an ideal base for traditional dolphin drives.The nearby Walande village has a similar cultural heritage to Fanalei and also conductsdolphin drives. Effort is similar to Fanalei, with 30-40 canoes involved during the sameseason. However, it seems that the success of these drives is minimal. This is thought to bedue to problems with coordination of the drive. As a result Fanalei produced all teeth for salethis year.Significance and value of dolphin teethThe teeth of the Raa (spinner dolphin) is used for necklaces only. It has no value for dowry ortrade. The teeth of the Unbulu are used for both dowry and trade. Unbulu teeth are essentialfor weddings, as practiced throughout Malaita. At least 1000 teeth are needed as a dowry (aspotted dolphin produces approximately 100 teeth). These teeth are also used for day-to-daytrade (i.e. 12 teeth for a large tobacco stick) as well as land purchases and leases. Again,these activities have been documented (see Appendix 1), so this report will not go into furtherdetail on what is locally considered ‘standard practice’. It is noteworthy that Unbulu toothhave become more valuable over the last 4 years. While in 2001 the price for a single toothwas S$0.30 in 2003 that increased to S$0.50 and doubled to S$1.00/tooth in 2004. During theinterviews it was explained that dolphin teeth always ‘sold out’ and that it was getting ‘a bithard to catch dolphins’. This was thought to be caused by natural variation in seasons ratherthan any effect of overexploitation. The sale of dolphin teeth is considered essential to thewell-being of the community. In particular school fees for the village children are seen as amajor financial burden that can be met, at least in part, by the sale of dolphin teeth. The ‘highprice’ did not affect demand and all teeth caught in the 2004 season (which ended in May, onemonth prior to our visit) were sold to buyers ‘from all over Malaita’.Use and value of dolphin meatThe meat is either consumed locally or fried with numerous spices and sold quickly in localmarkets for approximately S$5.00 per 1/4th of a strip (approx S$5.00/kg). Increasinglyduring the last years, dolphin meat has also been sold outside Malaita. This occurs mostly atmarkets in Honiara where prices can be doubled.Modern Influence on Traditional Dolphin Drive ActivitiesAlthough the traditional dolphin drive activities were assessed to have minimal moderninfluences overall (see above), there are some factors that were recorded during the interviewswith village elders and other community members:Increased effort – annual seasons472
Oceanic Cetaceans & Associated HabitatsAccording to Mr. Afia, the original hunting season was not practiced every single year by pastgenerations. The annual season became routine once the practice was adopted by the localchurch ‘several generations ago’, and annual blessings for the seasons were incorporated inchurch services.Expanded community involvementThe village elders decided ‘several generations ago’ that women and children would beallowed to assist with the final capture of the dolphins in the sheltered lagoon and thetransport to the village. This was originally prohibited and in some villages remains so to thisday (i.e. nearby Walande).Increased effort – population growthA more recent factor affecting hunting effort has been the population growth of Fanalei.More people participate in the drive. Fanalei elders estimated that in 2004 between 40-60canoes participated in the season. Three generations ago the estimated number of canoesinvolved in the drive was estimated to be 10-16. This equates to roughly a doubling of canoesper generation.The interviews were unable to quantify the effect this may have had on success rates andincreases in catch, but the consensus was that it made the drive more effective – but only if itwas coordinated and lead by a strong and knowledgeable frontman. Population growth wouldalso further increase the financial responsibilities of the community – especially school fees -and may thus be a major driving force for increased efforts in the future.Use of gillnet in final moments of the driveOne aspect of the actual drive modernised. During the final moments of the drive, a longnylon gillnet is used to cordon off the final escape route of the dolphin catch. This occursonce the dolphin group has been successfully driven from open ocean through the narrowlagoon passage and well into the local mangrove bay. The impact of this equipment on thetraditional methods of the drive effort seems minimal as the net is solely used at the very laststage of the capture. No other modern equipment such as ropes or radios are used during thedrive itself.The use of a gillnet does free up the men and women who otherwise may have beenpreoccupied with controlling the dolphins. However, at this stage of the hunt the dolphins arealmost without exception ‘tired and calm’. Any escapes of individual dolphins at this stagehave been very rare at best, according to the elders. So, although the introduction of a moderngillnet may have allowed more people to be involved to get the dolphins into the canoes andtransported, it seems unlikely that this would have increased the overall success or thehistorical catch per unit effort (H-CPUE) of the traditional dolphin hunt.New markets forcesIncreasingly, the meat is taken to the market in Honiara, Guadalcanal by ferry and sold forbetter prices (often double the local Malaita price/kg).Commercialisation of the drive activitiesDolphins caught with traditional drive methods for intended use in local and internationallive-display facilities and ‘swim-with-the-dolphin’ tourism projects.473
<strong>Solomon</strong> <strong>Islands</strong> <strong>Marine</strong> <strong>Assessment</strong> Technical ReportOne issue of concern is that the Fanalei community has sold live dolphins caught duringtraditional drives. According to the interviews, in 2002-2003 a local company with a dolphinfacility near Honiara requested a total of 45-55 spotted dolphins to be kept alive and pennedin the local bay. Of these, 12 animals were transported by a big vessel or barge to the displayfacility in the Florida islands, near Honiara. The spotted dolphins proved sensitive to suchrelocations and during the transport 10 animals died. Another animal died in the holding pensome time after arrival.The aftermath of the 2003 capture of spotted dolphins for a live-display facility did causesignificant disturbance amongst the village. One of the main issues was the distribution of therevenue of the sale of live dolphins (an unprecedented event in Fanalei) amongst communitymembers. Apparently this did not proceed according to traditional regulations. Hence theelders officially decided that specific captures of live dolphins for sale will not occur in the2004 season and will most likely remain prohibited for subsequent seasons. The acousticdrives and traditional use of dolphins’ teeth and meat will continue.Overall, the sale of live dolphins caused significant social tension within the Fanalei villageand its surroundings. The export/display facility involved has indicated that the survival rateof the species in transport and captivity is regrettable and that the species will not beconsidered again as a candidate for display and/or export. Its main species of commercialinterest is the Indo-Pacific bottlenose dolphin (Tursiops aduncus). Apart from significantnational and international legal aspects of displaying and/or exporting live dolphins, thismodern influence may not be easily integrated within an otherwise largely traditional Fanaleicommunity.In conclusion, although the traditional dolphin drives in Fanalei are largely non-modernized,several aspects raise serious concerns. The long-term disappearance of the valuedmelonheaded whales (robo au) in local waters, the increased effort due to population growthand new market forces clearly indicate that depletion of SI marine mammal resources can anddoes happen. Hence, additional dedicated cetacean surveys need to be conducted by the SIGovernment to determine the sustainability of the traditional dolphin drives, and ultimately, toensure the preservation of the unique cultural heritage of the SI.The Traditional Dolphin Drives off Bita ‘AmaBita ‘Ama is located on the NW side of Malaita. The interviews with the Bita ’Amacommunity were conducted at night and the information obtained was limited due to logisticalconstraints. Information was provided by an anonymous elder, who had been active as ahunter himself and was well informed. The interview was structured as described above forthe Fanalei community.Bita ‘Ama dolphin hunting traditions are older than the Fanalei community (whose familiesmigrated there from N Malaita). However, the Bita ‘Ama community has not been hunting fornumerous years. The reason(s) for this are not clear. All dolphin hunting canoes – which aredifferent in wood type and design from fishing canoes - are in a state of deterioration.Preparations are being made by elders to build new canoes. The actual trees that have alreadybeen earmarked for this use were shown. Hunting techniques and catch composition arelargely identical to Fanalei (although the time limits of the interview meant some differencescould have been missed). The species predominantly hunted is the Pantropical spotteddolphin. According to the Bita ‘Ama elder interviewed, traditional dolphin hunting willresume in the hunting grounds of the northern Indispensable Strait within 2 years.Interestingly, from April to August the Bita ‘Ama community routinely have close encounterswith ‘very large whales’ while fishing offshore in the Indispensable Strait. After detailed474
Oceanic Cetaceans & Associated Habitatsquestioning on a) ecological, morphological and behavioural aspects (e.g. group sizeestimates, blow angle and height, colour patterns, fluke-ups, other attributes), and b) anindependent species identification by the elder through illustrations of ‘very large whales’ incetacean field handbooks, it seems most likely that the whales sighted are blue whales(Balaenoptera musculus). Other anecdotal sighting information also strongly indicates thatblue whales are present in these waters. If confirmed, the Indispensable Strait region, as wellas several other narrow yet deep islands passages in the western <strong>Solomon</strong> Seas are likely tofunction as marine migratory corridors for large cetaceans.Local knowledge of cetaceans during the <strong>Solomon</strong> Island <strong>Marine</strong> <strong>Assessment</strong>Throughout the survey, local knowledge on cetaceans proved very valuable. Many coastalcommunities have shown us important spinner dolphin resting areas at their local reeflagoons. These preferred dolphin habitats are highly site-specific and seem stable forexceptional long periods. Certainly the village knowledge of the significance of certain reeflagoon areas to spinner dolphins spans over five generations.In places such as the Shortlands and Savo <strong>Islands</strong>, an inspection of dolphin habitat as pointedout by the respective communities, could be conducted. The Shortlands resident local groupconsisted of an estimated 85 animals. These dolphins were accustomed to speedboats andwould approach nearby speedboats in order to bow ride and perform spectacular leaps, oftenjumping just in front and above the observers in the bow. In Savu, the estimated 50 spinnerdolphins were again exactly where the local community had predicted. In this case, thedolphins also approached the speedboat to bow ride, but this behaviour was quickly followedby resting and socializing. An attempt was made on SCUBA to inspect an underwater cavethat was locally thought to be the main reason for the dolphin’s frequent occurrence in thisparticular area. However, no cave was found and no dolphins were sighted during this 25-min. dive, although dolphins were heard close by.It is interesting to note that spinner dolphins where often observed near lagoon entrances –both by local communities (long-term knowledge) and during our visual surveys (singlepasses through a previously unknown area). These sightings are consistent with the view thatspinner dolphins use local reef lagoons habitat as resting and socializing areas during the day.Here spinner dolphins are relatively safe from large predators such as sharks, as the clearwaters and sandy bottom (light background) would allow early visual predator detection. Forthe mostly nocturnal species, this is especially important during periods of daytime rest andacoustic inactivity (no echolocation information on surroundings). TNC – <strong>Solomon</strong> <strong>Islands</strong>Program’s on-going socio-economic survey will further solicit input from local communitiesthrough a cetacean questionnaire (W. Atu, pers. comm.).Other SI Cetacean REA ActivitiesSI CETACEAN REA VISIT TO THE GAVUTU CAPTIVE DOLPHIN FACILITYBackground and recommendations for the dolphin facility, husbandry practices, dolphinhealth and export can be found in a fact-finding paper by the IUCN’s Species SurvivalCommission – Cetacean Specialist Group (CSG) and the Veterinary Specialist Group (Ross etal. 2003). This report focuses on several related issues and concerns, as discussed on-sitewith the facility’s manager, M. Schultz, who offered the <strong>Solomon</strong> <strong>Islands</strong> <strong>Marine</strong> <strong>Assessment</strong>cetacean team a tour, organized a demonstration/training session and answered manyquestions on dolphin capture, husbandry, training and trade.475
<strong>Solomon</strong> <strong>Islands</strong> <strong>Marine</strong> <strong>Assessment</strong> Technical ReportPotential Impact on Local Fish Stocks and <strong>Marine</strong> Environment of the Florida Bay <strong>Islands</strong>A substantial proportion of the captive dolphins’ diet consists of locally captured fish (as wellas frozen fish specifically imported for this purpose). While this increased demand on localfish resources has a positive effect on the local economy, it may result in overexploitation oflocal fish stocks. The Gavutu facility offers a higher price per kilo for larger transactions(S$8/kg for > 25 kg vs. S$7/kg for
Oceanic Cetaceans & Associated HabitatsHowever, such tourism ventures are difficult to reconcile with live-dolphin captures that areoften perceived by foreign tourists as high-impact and unsustainable. Hence, it is important tonote that in early 2005, the government of the <strong>Solomon</strong> <strong>Islands</strong> announced a complete ban onfurther exports of dolphins. A joint declaration by the Minister for Fisheries and <strong>Marine</strong>Resources and the Minister for Forests, Environment and Conservation detailed that this newpolicy is effective immediately (see Appendix 5).POTENTIALLY SIGNIFICANT CETACEAN-FISHERIES INTERACTIONS: THE SI PURSE SEINE TUNA FISHERYThe western and central Pacific Ocean currently supports the largest industrial tuna fishery inthe world (Bailey et al. 1996). Within this vast region, the <strong>Solomon</strong> <strong>Islands</strong> is one of themost productive waters for skipjack and yellow-fin tuna in the tropical Pacific Ocean (Fig 14).Because of the diversity of oceanic cetaceans known or suspected to inhabit SI waters (Table1), and the intense pelagic fishing pressures, such interactions may be significant.Although no reliable data exists on any significant oceanic cetacean-tuna fisheries interactions- such as potential entanglement and (by) catch, or depredation - the region’s tuna fisheriesmanagement agency, The Secretariat of the Pacific Community (SPC), notes that‘While we remain largely ignorant about the impacts of tuna fisheries on by-catch species andpelagic ecosystems, it is obvious that these impacts have increased very significantly over thelast 50 years as tuna fisheries worldwide have expanded their catches and effort by orders ofmagnitude. However, we have little or no information on the relative abundances orbiomasses of many components of the pelagic ecosystem’ (see also Appendix 4).Many national and indeed regional stakeholders agree that a cetacean by-catch assessment isurgently needed for the western Pacific (see www.cetaceanbycatch.org for a Call to Action bythe world’s leading cetacean by-catch experts). A SPC report by (Bailey et al. 1996) includesone of the few relevant references on cetacean by-catch for the <strong>Solomon</strong> <strong>Islands</strong>’ marinefisheries. The report lists by-catch in the tropical western Pacific for each gear type (purseseine,longline, others). It notes that the number of marine mammal landings in thesefisheries is ‘minor’. Thus it seems that cetacean by-catch for pelagic tuna fisheries in thisregion does not warrant concern.However, this report was based on log sheet data as recorded by the fishermen themselves andthis may have underestimated such occurrences. It would be interesting to confirm theminimal cetacean by-catch with data from the SPC independent observer program.Unfortunately, such independent data is limited as the observer program in the <strong>Solomon</strong><strong>Islands</strong> was initiated in 1998 and there was minimal data collection during most of 2001 dueto the civil unrest (D. Brogan, SPC Secretariat, pers comm. in Sept 2004).Hence, observer data is only available until the end of 2002. The 2003 observer sheets arecurrently being processed. Observer data collected during the 1998 - 2002 period includedmandatory reporting of all marine mammal landings but there were no official guidelines torecord cetacean-fisheries interactions or sightings. This situation is currently being addressedby SCP, through implementation of several key recommendations of an expert workshop oncetacean-tuna fisheries interactions. SCP has provided additional training of observers andintroduced specific data forms to record cetacean landings, fisheries interactions andsightings. Improved data on cetaceans should be available from 2003 onwards (D. Brogan,pers. comm.). SCP has been helpful with further inquiries and noted that additional - and upto the most recent - data will be released upon request from officials of the <strong>Solomon</strong> <strong>Islands</strong>Ministry of Fisheries. Such a request is currently being completed.477
<strong>Solomon</strong> <strong>Islands</strong> <strong>Marine</strong> <strong>Assessment</strong> Technical ReportThe potential for cetacean-tuna fisheries interactions in the SI may warrant furtherinvestigation, especially as the SI Cetacean REA indicated an apparent low total individualcount or absence of many oceanic dolphin species. Thus, a comprehensive assessment ofcetacean-pelagic fisheries is needed for SI. As pelagic fisheries data is often pooled for largesections of the South Pacific, such a study may need to include adjacent fishing grounds suchas Papua New Guinea. More detailed statistics on the pelagic tuna fishery in SI waters, andother small scale, in-shore marine fisheries of the SI are provided in Appendices 3 and 4,including a summary of discard and by-catch.Potential for Cetacean Watching in the <strong>Solomon</strong> <strong>Islands</strong>The SI Cetacean REA’s activities included an initial assessment of the potential for localcetacean watch opportunities, especially for sperm whales and coastal dolphins. Whale- anddolphin watching in the wild is a fast-growing industry with world-wide revenue of over 1.5billion US$ dollars each year, and practiced in over 87 countries (Hoyt 2001). Many coastalnations have benefited from the development of well-managed whale watching operations.Interestingly, this potential can be realised fairly quickly (< 5 years) if conditions are right andthe activities are regulated properly (Hoyt 2001, see also Kahn 2002c for a review on cetaceanwatch development options in Indonesia, which faces similar challenges to SI for assessingand realizing its cetacean-watch potential).Cetacean watching may be a valuable new marine tourism industry to developing archipelagicnations such as the <strong>Solomon</strong> <strong>Islands</strong>. Consistent sightings of cetaceans in local waters mayprovide coastal communities with a valuable opportunity to establish new eco-ventures suchas responsible cetacean watching. From this socio-economic perspective, there is also a needto evaluate the ecological significance of SI's waters for cetaceans. In particular, anassessment of the role cetaceans can play in regional eco-tourism development and economicdiversification in remote regions of SI was an important aspect of the SI Cetacean REA(ecotourism is broadly defined here as: responsible nature-based tourism which causesminimal environmental impacts, as guided and/or regulated by best industry practices whichare periodically reviewed).The SI government has already expressed keen interest in developing responsible spermwhale watching in the archipelago, as part of a national marine tourism strategy. Nosubstantial work has been conducted yet to attempt to assess the feasibility (i.e. identifypossible species and promising areas) for such marine tourism ventures in SI waters. It is anoteworthy trend that increased protective measures for cetaceans have often ‘kick started’ oraccelerated the development of a whale and/or dolphin watching industry in new locales andnations. In addition, benign research and monitoring of living whales and dolphins have beenincorporated at most, if not all, highly successful and responsible cetacean watch industries.Outcomes of these programs help to evaluate the potential impacts of tourism activities oncetaceans over time and fine-tune the regulations (Hoyt 2001).The SI Cetacean REA determined that several coastal communities, such as the Shortlandsand Savo Island, have important spinner dolphin resting areas at their local reef lagoons.These preferred dolphin habitats seem stable for exceptional long periods and often have beenknown to villagers for over five generations. Responsible, well regulated, wild cetaceanwatching may be feasible in these locations. The passage between Honiara, Guadalcanal andthe Florida <strong>Islands</strong> is also locally known for its frequent dolphin sighting, as well as theoccasional whale. Indeed in this area the SI Cetacean REA sighted a large rorqual baleenwhale. It seems that this area has wild dolphin tourism potential (but see the section onInternational dolphin export trade). Presumably, similar accessible and reliable dolphin478
Oceanic Cetaceans & Associated Habitatshabitats can be found in other areas and communities not visited by the <strong>Solomon</strong> <strong>Islands</strong><strong>Marine</strong> <strong>Assessment</strong>, such as the eastern provinces.Judging from reports of frequent sightings of large whales close to shore, the St. Cruz areamay hold significant potential for (sperm) whale watching. Additional feasibility studies inall these areas are needed to evaluate the economic viability and sustainability of suchventures. Importantly, any developments in cetacean watching should be coupled withoperator-endorsed codes of conduct and appropriate regulatory frameworks, including theestablishment of <strong>Marine</strong> Protected Areas.Overall, responsible wild cetacean watching may have considerable potential in the <strong>Solomon</strong><strong>Islands</strong>. However, the development of such a tourism industry will be hard to reconcile withthe <strong>Solomon</strong> <strong>Islands</strong>’ dolphin export trade, which often generates considerable negative, highprofile,international (and occasionally misinformed) press coverage for the SI – and is likelyto influence visitation numbers and thus hamper national tourism growth.RecommendationsCAPACITY BUILDING FOR IMPROVED NATIONAL AND LOCAL CETACEAN EXPERTISESI needs to build local capacity for cetacean monitoring and research programs by additionaltraining of government and NGO personnel, as well as interested resort dive staff andcommunity groups. In particular, a national workshop is needed to build capacity forimproved local expertise on cetacean conservation and management. The workshop wouldtarget key stakeholders (government officials, NGOs, community groups) and provide anintroduction to:• The diversity and ecology of <strong>Solomon</strong> <strong>Islands</strong>’ whale and dolphin species.• Cetacean identification at sea (resident and migratory species), methods for dedicatedsurveys (i.e. line transect, photographic mark-recapture studies) and basic cetacean REAs(new areas of interest, limited funds), standardized data collection and data management.• Government and community-based sighting/stranding networks (incl. rescue and datacollection techniques from live and dead strandings; raise awareness with managementagencies and the general public).• Responsible whale watching – international guidelines.• Conservation and management issues that are particularly relevant to SI’s cetaceans.Ideally, such a workshop would be coupled with a small field component (1-2 days). Thisfield activity would focus on practicing skills learned during the workshop, while at the sametime addressing an important data gap for local waters. Overall the workshop would build onthe outcomes of the SI Cetacean REA and a) greatly improve cetacean awareness and b)promote the establishment of, and active involvement in, cetacean conservation andmanagement programs amongst SI stakeholders.In addition to these expected outcomes, the workshop is also an important tool to shareexisting information and increase high-quality data gathering on SI cetacean diversity,distribution and ranking of species-specific sighting frequencies and total individual counts.479
<strong>Solomon</strong> <strong>Islands</strong> <strong>Marine</strong> <strong>Assessment</strong> Technical ReportADDRESSING THE KNOWLEDGE GAP ON SI CETACEANS – A NATIONAL APPROACHThe waters of the <strong>Solomon</strong> <strong>Islands</strong> are expected to inhabit an exceptional cetacean diversity(at least 33 species, Table 1), yet there has been minimal survey effort and ecological researchto date. Currently, there exists a major knowledge gap on the diversity, abundance anddistribution of whales and dolphins in <strong>Solomon</strong> <strong>Islands</strong>’ territorial waters.The SI Cetacean REA has started to fill this nation-wide data-deficiency, and has providedinitial information for the ecosystem-based management of the marine (mammal) resources ofthe <strong>Solomon</strong> <strong>Islands</strong>. To build on this baseline REA, there is a need to develop a nationalcetacean program with national and site-specific components:1. Cetacean biodiversity mapping – Cetacean surveys (line-transect; photographic markrecapture)as well as visual and acoustic REAs (especially in large data-deficient areas),and dedicated surveys rapid assessments and surveys.2. Focus research on priority whale and dolphin species, including work on populationestimates and stock boundaries for commercially exploited species (such as the Indo-Pacific bottlenose dolphin, as well as the major species targeted in the traditional drives)and ecology (i.e. breeding, feeding, migration).3. Education, outreach and local capacity building.4. Policy development for marine mammal conservation and management, for both nationaland provincial governments.The multi-disciplinary approach of such a national cetacean program for SI will address theneed for:1. Additional data on whales and dolphins in national waters for improved, ecosystembasedmanagement – including responsible wild cetacean watch development.2. A framework to guide consistent national policy on cetacean management andconservation.3. Broadened environmental awareness, institutional capacity and marine resourcemanagement perspectives.The policy development aspect of the program is of importance as the <strong>Solomon</strong> Island Seasare comprised of international (EEZ), national and provincial waters which may havedifferent jurisdictions, affecting different species assemblages and habitats. Thus, SIlegislation may include different and potentially conflicting, legal frameworks of directrelevance to the management and conservation of cetaceans.Therefore, a multi-pronged cetacean program - with both provincial and national components- will provide <strong>Solomon</strong> <strong>Islands</strong> with the initial ecological know-how, educational initiativesand policy advice. It will assist with the identification of management and conservationmeasures – both species and habitat specific - that may be considered for the diverseassemblage of whales and dolphins inhabiting the waters of the <strong>Solomon</strong> <strong>Islands</strong>.This current knowledge gap for SI’s cetaceans should be addressed in the near future to assistboth government and conservation organizations in their decision making on (often shared)marine resource management decisions of national and regional importance, and to meetresponsibilities for various international conventions and treaties of which the SI is asignatory or member state.480
Oceanic Cetaceans & Associated HabitatsSHORT-TERM PROJECTS TO ADDRESS THE KNOWLEDGE GAPThere are clear and practical opportunities in the SI to maximize the amount of informationavailable for such a national management approach. Several projects can be implemented inthe short term which are both cost-effective and of high management value (Kahn 2003c) andwould improve the protective management of the SI’s residential and migratory cetaceans:a) Existing information (past and present) on SI cetacean and large migratory marine lifesightings needs to be canvassed and consolidated by seeking further input fromprovincial and national government agencies, coastal communities, local NGOs, diveshops, dive resorts and other knowledgeable stakeholders.b) A local cetacean sighting and stranding network for each province needs to beestablished, and coordinated as part of a national <strong>Solomon</strong> <strong>Islands</strong> <strong>Marine</strong> MammalNetwork (reporting of sightings and strandings - including tissue sampling of deadanimals - and rescues).c) New sightings and human-interactions (fisheries, tourism) need to be recorded nationwide on standardized data sheets, preferably identical to those used by APEXEnvironmental in other Asia-Pacific nations or other appropriate format.• Include detailed behavioural and habitat use data whenever possible (i.e.indications of feeding, diving, migrating, mating, resting, active avoidancebehaviours).d) Periodic and dedicated cetacean REAs should be conducted in areas of interest, aswell as population estimate surveys and ecological research on priority species.Fieldwork should be implemented by an expert team including local members frommarine resource management government agencies, coastal communities and NGOs.e) Innovative ways for opportunistic cetacean surveys should be explored (i.e. duringother marine monitoring projects or related field activities; ‘ships of opportunity’).f) Investigate the sustainability of the SI traditional dolphin drives (see also Section C).g) Investigate and record all other reported interactions of cetaceans with• Fisheries – by-catch and targeted catch; coastal and pelagic, artisanal, small andlarge scale fisheries.• <strong>Marine</strong> tourism – surface observations and ‘swim-with-cetacean’ encounters.• Other commercial uses of marine mammals including the captive-dolphin exporttrade.IDENTIFYING IMPORTANT CETACEAN HABITATS FOR PROTECTIVE MANAGEMENTAs mentioned above, the cetaceans of the <strong>Solomon</strong> <strong>Islands</strong> are extremely data-deficient, andthe <strong>Solomon</strong> <strong>Islands</strong> would benefit from additional cetacean work in most of its provinces.Therefore, it is not possible to prioritize areas for protection on a national level at present, ashabitats such as preferred breeding, feeding, resting areas, migratory routes and corridors arenot known for most whale and dolphin in the <strong>Solomon</strong> <strong>Islands</strong>.However, best available information suggests that the following areas may be importantcetacean habitats in the SI, and further studies are required to confirm their status. Thus, thisshortlist should be regarded as preliminary and is likely to change and become more specificonce more data becomes available.a) N Guadalcanal – Florida <strong>Islands</strong> waters and inter-island passages (consistent sightingsof small cetaceans, extremely large schools of dolphins reportedly ‘passing through’,as well as occasional ‘whale’ sightings).481
<strong>Solomon</strong> <strong>Islands</strong> <strong>Marine</strong> <strong>Assessment</strong> Technical Reportb) New Georgia Group, especially the wider Gizo – Kolombangara – Simbo Isl. area(diverse deep water habitats, reportedly frequent sightings of pilot whales,unidentified large whales).c) Malaita, especially the waters around Fanalei and Bita ‘Ama.d) Fauro <strong>Islands</strong> - Shortlands Island Group (‘resident’ spinner dolphin groups,population and ecology research – reef lagoon habitat use).e) Russell <strong>Islands</strong> - diverse deep water habitats, reportedly frequent sightings of orcas,and to a lesser extend sperm whales.f) Southern oceanic waters off New Georgia – frequent Bryde’s whale sightings, majortarget area for tuna fisheries (purse seine fleet).g) All deep, yet relatively narrow passages separating the main islands of the <strong>Solomon</strong><strong>Islands</strong> from the South Pacific Ocean or the <strong>Solomon</strong> Sea, which are known orsuspected multi-species migratory corridors.• Indispensable Strait – Bita ‘Ama – large baleen whales (possibly blue whales),• Manning Strait including the Arnavon <strong>Islands</strong>.• Iron Bottom Sound• Gizo Strait and Vella Gulf• Blanche Channel• Bougainville Strait.h) St. Cruz Province (diverse deep water habitats, reportedly frequent sightings of spermwhales and to a lesser extend orcas) – all waters of the eastern and southern provincesof SI have not been covered by the REA.CONSERVATION OPTIONS – MARINE CORRIDORS AND LOCAL DOLPHIN RESTING LAGOONS<strong>Marine</strong> Corridors<strong>Marine</strong> corridors are site-specific habitats (as opposed to the much more dynamic off-shorehabitats for these wide ranging species) which are critical to numerous species of largemigratory marine life, including oceanic cetaceans such as sperm whales, (whale) sharks andmantas, marine turtles, sunfish, as well as straddling fish stocks such as billfish and tuna. Wealso know that these passages are often located within the Indo-Pacific region's manyarchipelagic nations - such as Indonesia, Philippines, <strong>Solomon</strong> <strong>Islands</strong> and Papua NewGuinea, Maldives, Seychelles (Kahn 2003, 2002a. Here they play an important role inensuring the integrity and functionality of Large <strong>Marine</strong> Ecosystems (LMEs). Yet these verysame passage areas are increasingly vulnerable to local disturbances. Such localized impactscan have major regional ramifications for marine conservation and sustainable fisheriesinitiatives (Agardi 1997). <strong>Marine</strong> corridors are usually coastal habitats and offer an importantopportunity to improve migratory species conservation. They are relatively easy to include incoastal resource management programs (again, when compared to habitats in EEZ waters orhigh seas; Kahn 2003).Corridor conservation can be effectively achieved via habitat-based management frameworksincluding multi-use <strong>Marine</strong> Protected Areas. Key issues for corridor conservation in the<strong>Solomon</strong> <strong>Islands</strong> include fisheries interactions; especially gill and/or drift netting practices inor near corridors which may effectively cordon off a passage. Because of the seasonalmigrations of whales and other migratory marine life, even short periods of intensive fishingwith gillnets in the vicinity of corridors can result in very significant by-catch andentanglement rates. Whale entanglements in gillnets are a lose-lose situation: the whaleoften loses its life, the fishermen often lose their expensive nets.482
Oceanic Cetaceans & Associated HabitatsA destructive fishing practice (DFP) known as reef blasting is common and widespreadthroughout Indonesia and the Philippines. It is not known whether this practice is used in the<strong>Solomon</strong> <strong>Islands</strong>, but unconfirmed reports suggest it may occur in certain locations.Numerous direct lethal and sub-lethal effects, as well as indirect impacts, of the pressure waveof an underwater blast on cetaceans have been described (i.e. Ketten 1998, see Kahn et al.2000 for a summary on potential impacts of reef bombing on corridor habitat in Indonesia).Reef bombing in or near corridors may be a potentially significant threat to cetaceans asunderwater explosions may cause a) direct harm to animals close by and b) substantialacoustic habitat degradation which may lead to corridor avoidance. Long-term sources ofnoise pollution such as shipping and off-shore oil and gas activities near corridors may alsocontribute to acoustic habitat degradation; although the impact of such increased under seanoise levels on whales and dolphins may differ greatly between species and remains poorlyunderstood. Overall, management measures may vary substantially between corridor sitesand ideally are incorporated within long-term management plans (i.e. Kahn 2002a, 2003). Forexample, Komodo National Park World Heritage and Biosphere Reserve includes two majorcorridor passages for whales and other migratory marine life. Providing better protection forthese habitats was an important factor to justify and gather local support to establish acomplete ban on gillnetting in Park waters through new district-level legislation (Kahn andPet 2003).Dolphin Resting LagoonsOn several occasions during the SI <strong>Marine</strong> <strong>Assessment</strong> the local community knowledge oncetaceans included information on specific reef lagoon areas where spinner dolphins wereknown to ‘rest’. Other species such as bottlenose dolphins may have similar preferred reefhabitats but this could not be verified. Community interviews showed that pods of spinnerdolphins used the same area every day and these sites where often known for manygenerations, indicating long-term site fidelity.These reef habitats have been identified as resting areas for spinner dolphins in other regionsof the tropical Pacific (i.e. Hawaii, Tahiti) and it is likely that the several populations ofspinner dolphins use <strong>Solomon</strong> Island lagoons in a similar fashion. Reef lagoons may functionas safe daytime resting areas for this mostly nocturnal species. Its clear, sheltered waters andsandy bottoms provide an effective environment for early predator detection and avoidance(such as sharks).From a management perspective two issues may be of importance:1. The opportunity to work with local communities to ensure these reef habitats are notdegraded. Indeed it seems that the coastal communities we encountered regard theseareas as special and provide them de facto protection by excluding some fishingactivities for example and2. The dolphin watch tourism potential in local waters - such as dolphin resting lagoons(see Section D).In these locations community-based marine management approaches, in collaboration withprovincial and national government agencies, may be an effective management framework toensure these important dolphin habitats are conserved, and where feasible, regulate anyeconomic opportunities such as local dolphin watching activities.483
<strong>Solomon</strong> <strong>Islands</strong> <strong>Marine</strong> <strong>Assessment</strong> Technical ReportTRADITIONAL DOLPHIN DRIVES - FANALEIDedicated Cetacean Surveys to Assess Relative Abundance for Species of Special InterestAlthough the traditional dolphin drives in Fanalei are largely non-modernized, several aspectsraise serious concerns. The long-term disappearance of the valued melonheaded whales (roboau) in local waters; increased effort due to population growth; and new market forces allclearly indicate that depletion of SI marine mammal resources can and does happen.These aspects of the dolphin drives clearly indicate that depletion of SI marine mammalresources can and does happen. Clearly more work is needed to determine the sustainability ofthe traditional dolphin drives, and ultimately, to ensure the preservation of the unique culturalheritage of the SI. The SI Government may consider the following activities in particular:Dedicated cetacean surveys in Fanalei waters to determine bio-diversity in local waters,estimate relative abundances of target species, habitat use as well as more socio-economicfactors of the drives (incl. cultural heritage and aspirations of this community).Such surveys would also be required to address the sustainability of the live-dolphin captureand international export trade.Genetic analysis of samples from teeth included in Fanalei wedding dowries and othercultural artefacts (designed to incorporate a time-series, spanning >100 years) may be a costeffectiveand realistic option to obtain information on the long-term population trends oftarget cetacean species in Fanalei.Finally, it must be noted that just because the traditional dolphin drives are a highly visibleimpact on local spotted dolphin populations, this activity may not be the only or even thegreatest impact on the population status of this and other target species (i.e. other factorsacting throughout the populations’ home range may include habitat degradation, potentialeffects of pelagic and coastal fisheries).Canvassing of Community Knowledge on Local Cetacean Species and HabitatsTNC– <strong>Solomon</strong> <strong>Islands</strong> Program’s on-going socio-economic survey will further solicit inputfrom local communities through a cetacean questionnaire (W. Atu, pers. comm.).Gavutu Captive Dolphin FacilityIn addition to the recommendations of the IUCN Species Survival Commission report, theeffect of the increased pressure on local fish stocks due to the captive dolphin foodrequirements should be further evaluated.Potentially Significant Cetacean-Fisheries Interactions: the SI Purse Seine Tuna FisheryThe potential for cetacean-tuna fisheries interactions in the SI may warrant furtherinvestigation, especially as the SI Cetacean REA indicated an apparent low total individualcount or absence of many oceanic dolphin species. Thus, a comprehensive assessment ofcetacean-pelagic fisheries is needed for SI.484
Oceanic Cetaceans & Associated HabitatsAs pelagic fisheries data is often pooled for large sections of the South Pacific, such a studymay need to include adjacent fishing grounds such as Papua New Guinea. More detailedstatistics on the pelagic tuna fishery in SI waters, and other small scale, in-shore marinefisheries of the SI are provided in Appendices 3 and 4, including a summary of discard andby-catch.THE CASE FOR SI TO BECOME A SIGNATORY STATE OF CITES 7 .CITES, the Convention of International Trade of Endangered Species, (see Appendix 2 forconvention details) is an internationally recognized mechanism to sustainably manage wildlifetrade in endangered species, including cetaceans. In order to strengthen the management andconservation of the relatively high level of endemic species and endangered species (bothterrestrial and marine), the SI government should seriously consider to become a member ofCITES.CITES is widely recognized and respected as an effective conservation agreement with broadmembership – 167 parties to date. It regulates trade in species between contracting parties,and to a lesser extent between Parties and non-Parties, but countries who stay outside theconvention reduce the effectiveness of the regulations: CITES is only as effective as itscoverage.By joining CITES the <strong>Solomon</strong> <strong>Islands</strong> would improve CITES coverage and effectiveness andin doing so would be welcomed by the wider international community. In addition, <strong>Solomon</strong><strong>Islands</strong> export a considerable quantity of fauna. While most SI species as reported by CITESmay sustain such a trade, these are several cases where CITES has recommended a ban onimports of several species from the <strong>Solomon</strong> <strong>Islands</strong>. By not being a CITES member, the<strong>Solomon</strong> <strong>Islands</strong> has no mechanism to defend this commercial trade or officially oppose anytrade restrictions.The process of joining CITES is relatively straightforward and assistance can be providedthrough its Secretariat. Key obligations as a Party include:1. The annual payment of a minimal fee based on GNP (i.e. less than $50- in the case ofPalau),2. Designating a Management Authority and a Scientific Authority to manage the tradeof endangered species.3. Adopt the provisions of CITES into its national legislation so that it can fullyimplement and enforce the provisions of the treaty.4. Maintain records of all trade in CITES listed species,5. Submit annual reports on trade to the World Conservation Monitoring Unit, adepartment of the United Nations Environment Programme (UNEP) and biennialreports on all measures taken to enforce the CITES provisions.CITES may provide financial assistance to these National Authorities. Some of the otherobligations do include a significant workload (i.e. points 4 and 5). However, developingnations routinely recover administration costs through the issuance of CITES permits.The CITES treaty requires a country that wishes to join, to formally affirm its intent to bebound by the treaty. To join CITES, the <strong>Solomon</strong> <strong>Islands</strong> would have to deposit anappropriate legal instrument with the Swiss Government (the Depository Government). What7 Including technical advice on CITES obligations as kindly provided by Sue Miller, Whale andDolphin Conservation Society (WDCS), UK.485
<strong>Solomon</strong> <strong>Islands</strong> <strong>Marine</strong> <strong>Assessment</strong> Technical Reportconstitutes an appropriate legal instrument for the <strong>Solomon</strong> <strong>Islands</strong> will be defined by itsnational law (e.g. ratification of the treaty by the Head of State or otherwise).486
Oceanic Cetaceans & Associated HabitatsAcknowledgementsFirstly, I would like to thank all members of the Conservation Council of the <strong>Solomon</strong> <strong>Islands</strong>(CCOSI) for their support and the whole <strong>Solomon</strong> <strong>Islands</strong> <strong>Marine</strong> <strong>Assessment</strong> Team. Inparticular, many thanks to Alison Green and Paul Lokani, Willie Atu, Ferral Lasi and RudiSusurua and the community liaison team from the TNC Pacific Island Programme, PeterRamohia (Department of Fisheries) and John Pita (Department of Environment andConservation), Alec Hughes and Tingo Leve from WWF <strong>Solomon</strong> <strong>Islands</strong>, Michael Ginigele(Tiola <strong>Marine</strong> Protected Area Project, Roviana Lagoon) (your assistance with localcommunities was invaluable), Lisette Wilson (WWF South Pacific Programme) and as wellas Gerry Allen, Emre Turak, Charlie Veron, David Wachenfeld and Louise Goggin.A special thanks to: the villages and coastal communities of the <strong>Solomon</strong> <strong>Islands</strong> whoseassistance is very much appreciated, and especially the elders of Fanalei and Bita ‘Ama; thewonderful crew of M.V. FeBrina - and especially Capt. Russell Slater (who was alwayswilling to assist with visual sightings during the daytime and then accommodate for listeningstops during the nighttime passages – often in challenging conditions); the many diveoperators and local NGOs who provided cetacean sighting and stranding information; RandallReeves for the numerous papers on the <strong>Solomon</strong> <strong>Islands</strong> he made available; The IUCN SSC –Cetacean Specialist Group, especially Nick Gales, Bill Perrin and Randall Reeves for theirconstructive comments on earlier versions of this report; Yvonne James-Kahn for SICetacean REA program support, data transcription, comments and editing. Mike Schultz forallowing us to inspect the Gavutu dolphin facility; Peter Ramohia and Deidre Brogan (FisheryMonitoring Supervisor, Secretariat of the Pacific Community) for the discussions on <strong>Solomon</strong><strong>Islands</strong>’ pelagic fisheries; and Max Benjamin (Walindi Resort, PNG) for making the FeBrinaavailable for cetacean surveys during the PNG-SI relocation passage.487
<strong>Solomon</strong> <strong>Islands</strong> <strong>Marine</strong> <strong>Assessment</strong> Technical ReportReferencesAgardy, T.S. 1997. <strong>Marine</strong> protected areas and ocean conservation. Academic Press Limited,London UK. 244pp.Bailey K., P. Williams and D.G. Itano (1996). By-catch and discards in central and westernPacific tuna fisheries: A review of SPC data holdings and literature. OFP TechnicalReport No. 34 :Tuna and Billfish <strong>Assessment</strong> Programme (TBAP). South PacificCommission (SPC). Noumea. NewCaledonia.http://www.spc.int/OceanFish/Html/TEB/Bill&Bycatch/Bycatch/index.htm(especially Section 3: 3.3.4 and table 3.14 also Section 4: 4.3.2.3 and table 4.13)Barnes, R.H. 1996. Sea Hunters of Indonesia, Fishers and Weavers of Lamalera. ClarenfordPress. Oxford. England. 362pp.Department of Fisheries and <strong>Marine</strong> Resources. 2003. Dolphin assessment and monitoringproject. <strong>Solomon</strong> <strong>Islands</strong> Government. 10 pp.Fair, P.A. and P.R. Becker. 2000. Review of stress in marine mammals. Journal of AquaticEcosystem Stress and Recovery 7: 335-354.Fortes, M., Djohani, R. and B. Kahn (eds). 2003. Introducing the Regional Action Plan(RAP) to Strengthen a Resilient Network of Effective <strong>Marine</strong> Protected Areas inSoutheast Asia 2002-2012: Technical Background and RAP Description. FinalReport to the IUCN World Commission for Protected Areas (WCPA), Gland,Switzerland. 128pp.Gordon, J. and A. Moscrop. 1998. Underwater noise pollution and its significance for whalesand dolphins. In: The conservation of whales and dolphins: Science and practice. ByM. Simmonds and J. Hutchington (eds). Wiley and Sons. England. pp 281-320.Hampton J., Lawson T. and P. Williams. 1995. Status of Interactions of Pacific TunaFisheries in 1995. In: Richard S. Shomura, R.S., Majkowski J. and R. F. Harman(eds): Proceeding of the Second FAO Expert Consultation on Interactions of PacificTuna Fisheries Shimizu, Japan 23 to 31 January 1995.Hofman. R.J. 1995. The changing focus of marine mammal conservation. Trends. Ecol. &Evol. Vol. 10. No. 11: 462-465.Hoyt, E. 2004. <strong>Marine</strong> Protected Areas for Whales, Dolphins and Porpoises: A WorldHandbook for Cetacean Habitat Conservation. Whale and Dolphin ConservationSociety and Earthscan Publishers. London, UK. 512 pp.Hoyt, E. 2001. Whale Watching 2001: Worldwide Tourism Numbers, Expenditures, andExpanding Socioeconomic Benefits. The International Fund for Animal Welfare(IFAW). 175pp. Available at www.ifaw.org.Hyrenbach, K.D., K. A. Forney and P. K. Dayton A. 2000. Viewpoint: <strong>Marine</strong> protectedareas and ocean basin management. Aquat. Conserv.: Mar. Freshwat. Ecosyst. 10,437–458.IUCN. 2003. The 2003 IUCN Red List of Threatened Species. Available at www.redlist.org.Kahn, B. 2004. Indonesia Oceanic Cetacean Program Activity Report October-December2003: Solor-Alor Visual and Acoustic Cetacean Survey and Applied EcologicalResearch; Indonesia <strong>Marine</strong> Mammal Management Area (IM3A) and Solor-Alor<strong>Marine</strong> Protected Area Development. APEX Environmental/TNC Indonesia ProgramTechnical Report. 29pp.Kahn, B. 2003. The Indo-Pacific <strong>Marine</strong> Corridors of Eastern Indonesia: EcologicalSignificance for Oceanic Cetaceans and other Large Migratory <strong>Marine</strong>Life and Implications for MPA networks in Southeast Asia. Paper presented at theVth World Parks Congress (WPC). WPC <strong>Marine</strong> Stream workshop 'Scaling Up toBuild MPA Networks: Benefits for Fisheries and Endangered Species’. Durban,South Africa, 8-17 September 2003.488
Oceanic Cetaceans & Associated HabitatsKahn, B. 2002a. Indonesia's migratory corridors for large marine life: Scientific andmanagement perspectives. In: Proceedings of the 1st Regional Session of the GlobalBiodiversity Forum for the Pacific (GBF): ‘Global Forces and their Impacts on thePacific’s Biodiversity: Towards Local and Regional Response Strategies. Rarotonga,Cook <strong>Islands</strong> July 5-8, July 2002.Kahn, B. 2002b. The Solor - Alor Rapid Ecological <strong>Assessment</strong> – Visual and acousticcetacean surveys and evaluation of traditional whaling practices, fisheries interactionsand nature-based tourism potential: October 2001 and May 2002 Survey Periods.Solor - Alor Rapid Ecological <strong>Assessment</strong> (REA). Technical Report for WWF -Wallacea and TNC Coastal and <strong>Marine</strong> Program/Indonesia. 36pp.Kahn, B. 2002c. Discussion paper on the establishment of a Protected <strong>Marine</strong> MammalFisheries Area in Indonesia’s national and EEZ waters. APEX Environmental/TNCIndonesia Program Technical Report prepared for the Government of the Republic ofIndonesia - the Ministry of <strong>Marine</strong> Affairs and Fisheries. 55pp.Kahn, B. 2001a. Important criteria for selecting/establishing protected habitat regions forcetaceans in Papua New Guinea. In: Transcripts of the New Guinea <strong>Marine</strong> MammalForum. July 16-17 2001, Port Moresby Papua New Guinea. 6-8p.Kahn, B. 2001b. Rapid ecological assessment in the Sangihe-Talaud Archipelago, NorthSulawesi, Indonesia: Visual and acoustic cetacean survey component. TechnicalReport - APEX Environmental/TNC Coastal and <strong>Marine</strong> Program/Indonesia. 16pp.Kahn, B. 1999. Oceanic cetacean surveys and sperm whale (Physeter macrocephalus)research of Northern Sulawesi, Indonesia. In: Proceedings of the 13th BiennialConference on the Biology of <strong>Marine</strong> Mammals, Hawaii Nov.28 - Dec. 3 1999.226pp.Kahn, B. and J. Pet. 2003. Long-term visual and acoustic cetacean surveys in KomodoNational Park, Indonesia 1999-2001: Management implications for large migratorymarine life. In: Proceedings and publications of the World Congress on AquaticProtected Areas 2002. Australian Society for Fish Biology. 625-637p.Kahn, B., James-Kahn, Y. and J. Pet. 2000. Komodo National Park cetacean surveys - A rapidecological assessment of cetacean diversity, distribution and abundance. IndonesianJournal of Coastal and <strong>Marine</strong> Resources 3(2). 41-59.Kahn B., Wawandono N. B. and Subijanto, J. 2001. Protecting the cetaceans of KomodoNational Park, Indonesia: Positive identification of the rare Pygmy Bryde's whale(Balaenoptera edeni) with the assistance of genetic profiling. Final Report to theIndonesian Institute of Sciences (LIPI). 11pp.Kahn, B. Whitehead, H. and M. Dillon. 1993. Indications of density-dependent effects fromcomparisons of sperm whale populations. <strong>Marine</strong> Ecology Progress Series 93, 1-7.Ketten, D. 1998. <strong>Marine</strong> mammal auditory systems: a summary of audiometric andanatomical data and its implications for underwater acoustic impacts. NOAA-TM-NMFS-SWFSC-256. 74p.Kile, N and A. Watah. 2003. The dolphin fishery of the <strong>Solomon</strong> <strong>Islands</strong>. Statement by theMinister of the Department of Fisheries and <strong>Marine</strong> Resources, <strong>Solomon</strong> <strong>Islands</strong>Government. 9pp.LeDuc, R.G., Perrin, W.F. and Dizon, A.E. 1999. Phylogenetic relationships among thedelphinid cetaceans based on full cytochrome b sequences. <strong>Marine</strong> Mammal Science15, 619-48.Lehodey, P. 2001. The pelagic ecosystem in the tropical Pacific Ocean: dynamic spatialmodelling and biological consequences of ENSO. Progress in Oceanography 49: 439-468.Malakoff, D. 2004. New tools reveal treasures at ocean hot spots. Science 304: 1104-1105.Mann, J. Connor, R.C., Tyack, P.L. and H. Whitehead. 2000. Cetacean societies - Fieldstudies of dolphin and whales. 433pp.Marsh, H., C. Eros, H. Penrose and J. Hugues. 2001. The dugong (Dugong dugon) statusreports and action plans for countries and territories in its range. IUCN, GlandSwitzerland. 160pp.489
<strong>Solomon</strong> <strong>Islands</strong> <strong>Marine</strong> <strong>Assessment</strong> Technical ReportPerrin, W.F., R.R. Reeves, M.L.L. Dolar, T.A. Jefferson, H. Marsh, J.Y. Wang, and J.Estacion (eds.). In press. Report of the Second Workshop on the Biology andConservation of Small Cetaceans and Dugongs of Southeast Asia, SillimanUniversity, Dumaguete City, Philippines, 24-26 July 2002. Technical Report Series,Convention on Migratory Species, Bonn, Germany.Reeves, R.R., S. Leatherwood, G.S. Stone, and L.G. Eldredge. 1999. <strong>Marine</strong> Mammals in theArea Served by the South Pacific Regional Environment Programme (SPREP). SouthPacific Regional Environment Programme, Apia, Western Samoa. 48 pp.Rice, D. 1989. Sperm whale Physeter macrocephalus Lineaus 1758. In handbook of marinemammals, vol. 4, River dolphins and the larger toothed whales. Ed. S.H. Ridgewayand R Harrison. London, Academic Press.Ross, G. Gulland, F, Gales, N. Brownell, R and R. Reeves. 2003. A report of a fact-findingvisit to the <strong>Solomon</strong> <strong>Islands</strong>. Report by the IUCN Species Survival Commission –Cetacean Specialist Group. 9 pp).Rudolph, P., C. Smeenk and S. Leatherwood. 1997. Preliminary checklist of cetacea in theIndonesian Archipelago and adjacent waters. Zoologische Verhandelingen 312: 1-48.Wada, S., Oishi, M. and T. K. Yamada. 2003. A newly discovered species of living baleenwhale. Nature Vol. 426: 287-81.Weilgart, L. 1988. Distinctive vocalizations from mature sperm whales (Physetermacrocephalus). Can . J. Zool. 66: 1931-37.Whitehead, H. and B. Kahn. 1992. Temporal and geographical variation in the socialstructure of female sperm whale. Can. J. Zool. 70: 2145-49.Whitehead , H and L. Weilgart. 1990. Click rates from sperm whales. J. Acoust. Soc. Am.87:1798-1806.WWF. 2003. Bismarck <strong>Solomon</strong> Seas Ecoregion – A Cradle of <strong>Marine</strong> Biodivesity.Ecoregional vision workshop report published by WWF South Pacific Programme.25pp.490
Oceanic Cetaceans & Associated HabitatsTablesTable 1. Preliminary marine mammal species list for <strong>Solomon</strong> <strong>Islands</strong> waters, with positive identifications during SI Cetacean REA and Fanalei names andrelative catch frequency.Generic identification(ID)Scientific ID(Order Cetacea)SIREAOtherFanalei ID 2 Targetedreports 1 catch 3 Relativefrequency ofCommentscatch 4Dolphins Fam. Delphinidae • All kirio YesHighly diverse coastal and oceanic species (incl.the largest dolphin, the orca or killer whale), noriverine species known.Beaked whales Fam. Ziphiidae • Sao No At least 3 genera likely to inhabit SI waters.Large whalesDugongSperm whaleFam. Balaenopteridae;PhysetermacrocephalusDugong dugon (OrderSirenia)Physetermacrocephalus• 14 Busu asi No Rorqual baleen whales, sperm whale.• 5, 14 Ia tekwa No• 8, 7, 12 NoDwarf sperm whale Kogia simus No(acoustic IDonly)Locally common but not extensively hunted.Highly data-deficient and thought to be at riskof extirpation throughout much of its range(Marsh et al. 2001).Pygmy sperm whale Kogia breviceps 9 NoShort-finned pilot whaleGlobicephalamacrorhynchus• 7,9 NoOrca Orcinus orca • 8, 9 NoAvoided when sighted, same individual maleseen in separate years491
<strong>Solomon</strong> <strong>Islands</strong> <strong>Marine</strong> <strong>Assessment</strong> Technical ReportSpecies identification(ID)Scientific IDSIREAOtherFanalei ID 2 Targetedreports 1 catch 3 Relativefrequency ofCommentscatch 4False killer whale5 Pseudorca crassidens •8, 9, 7,11, 14Ga ia roboNo Sometimes sightedPygmy killer whale Feresa attenuata 7 No Sometimes sightedMelon-headed whale Peponocephala electraSpinner dolphin Stenella longirostris •Spinner dolphin(offshore small body)Spinner dolphin(offshore, robust body)Pan-tropical spotteddolphinStenella attenuata •8, 9, 11,16, 14(teeth, norecentsightings)8, 6, 7, 9,11, 14,168, 7, 9, 6,11, 14,16Robo au/RobotafungaiYesRaa YesRaamatakwaYesSubo raa YesUnbulu YesStriped dolphin Stenella coeruleoalba 8, 7, 9, 14 Robo tetefa NoAlmostevery yearAlmostevery yearAlmostevery yearEvery year,main targetspeciesTeeth are considered the most valuable, yet thisspecies has not been caught (or seen) for manydecades, and indeed, many generations (>100years).Rough-toothed dolphin Steno bredanensis • 8, 7, 9, 6 NoRisso's dolphin Grampus griseus • 7, 9, 6, 14 Gwon mudu NoBottlenose dolphin Tursiops truncatus • 8, 9, 14Olo folosiNo Do not react to noise of clapping stones492
Oceanic Cetaceans & Associated HabitatsSpecies identification(ID)Scientific IDSIREAOtherFanalei ID 2 Targetedreports 1 catch 3 Relativefrequency ofCommentscatch 4Indo-Pacific BottlenosedolphinShort-beaked commondolphinLong-beaked commondolphinTursiops aduncus • No Do not react to noise of clapping stonesDelphinus delphis 5, 14Delphinus capensisRabomanoleRabomanoleNoNoFraser's dolphin Lagenodelphis hosei 14 Not known6 Yes Every yearIndo-Pacific HumpbackdolphinSousa chinensis No Likely but no record foundIrrawaddy dolphin Orcaella brevirostris 9 NoBeaked whales Mesoplodon sp. NoBlainville’s beaked whaleGingko-toothed beakedwhaleIndo-Pacific beakedwhaleMesoplodon7densirostrisMesoplodonLikely but no record foundginkgodensIndopacetus pacificus Likely but no record foundCuvier's beaked whale Ziphius cavirostris 8 Yes SometimesBottlenose whales Hyperoodon sp. NoCommon minke whaleAntarctic minke whaleBalaenopteraacutorostrata12 NoBalaenopterabonaerensisLikely but no record found493
<strong>Solomon</strong> <strong>Islands</strong> <strong>Marine</strong> <strong>Assessment</strong> Technical ReportSpecies identification(ID)Scientific IDSIREAOtherFanalei ID 2 Targetedreports 1 catch 3 Relativefrequency ofCommentscatch 4Bryde's whale Balaenoptera brydei 8, 12 NoPygmy Bryde's whale Balaenoptera edeni NoHighly likely but no record found (see Kahn etal. 2001)Omurai’s whale Balaenoptera omuraiReported recently as new baleen whale speciesfrom SI waters (Wada et al. 2001), butuncertainty remains on similarities with B.edeni, and the overall taxonomic status of thesei-bryde’s whale complexSei whale Balaenoptera borealis No Highly likely but no record foundFin whale Balaenoptera physalus No Likely but no record foundBlue whale Balaenoptera musculus NoHumpback whaleMegapteranovaeangliaeNoHighly likely but no record found , see Bita’Ama community interviews, sightings reportedfrom experienced dive industry operators (to beverified)Highly likely but no record found, sightingsreported from experienced dive industryoperators (to be verified)1 - As listed in Appendix 1.2- Fanalei ID as reported during SI Cetacean REA interviews and literature (Takekawa 1996a,b in Appendix 1).3- Targeted catch was assessed through SI Cetacean REA interviews.4- Relative catch frequencies were assessed through SI Cetacean REA interviews.5 -Identified species from the Arnavon Isl. Stranding and interviews with Conservation Officers.6 -Takekawa notes that the name robo au may also apply to the Fraser’s dolphin (Lagenodephis hosei) . This could not be verified during the SI CetaceanREA.494
Oceanic Cetaceans & Associated HabitatsTable 2. Visual survey summary for the SI Cetacean REA May-June 2004.<strong>Solomon</strong> <strong>Islands</strong> Cetacean REA May 10 – June 16 2004Survey effortTotal days surveyed 36Estimated survey distance (nm) 1228.1Active visual survey effort (hr) 8 160.0Oceanic habitat zone (hr) 60.0Coastal habitat zone (hr) 67.5Straits and corridors habitat zone (hr) 32.5Survey resultsCetacean sightings 52Cetacean total individual count 9 815Cetacean species diversity(total includes one acoustic species identification – the11sperm whale)Survey results corrected for effort(average)Species identified/survey day 1.14Sightings/survey day 1.44Total individual count/survey day22.64Sightings/survey distance (nm) 0.04Total individual count/survey distance (nm)0.668 Active visual survey effort = Total hours - hours spend off effort (due to sea time spend on species identificationand/or tracking and ecological research on priority species, logistical constraints).9 Cetacean total individual count = Direct count of cetaceans surveyed (total of minimal abundance estimates ofcetaceans at the surface/sighting). See methods for more details.495
<strong>Solomon</strong> <strong>Islands</strong> <strong>Marine</strong> <strong>Assessment</strong> Technical ReportTable 3. The SI Cetacean REA legs, including key parameters.REA LegNo.Area Description Days Distance(nm)1 Guadalcanal - Florida Isl. - St. Isabel 7 204.302 Arnavon Isl. - Choiseul – Shortland Isl. - Mono Isl. 8 261.603 New Georgia Group – Russell Isl. - Guadalcanal 7 232.404 Guadalcanal - Makira - Florida Isl. - Savo 6 159.605 3 Sisters - Malaita - N Indispensable Strait 6 210.20All - SI All <strong>Solomon</strong> <strong>Islands</strong> Legs 34 1068.10PNG-SI SE Bougainville – Guadalcanal, Honiara 2 160.00TOTAL All <strong>Solomon</strong> Island Cetacean REA Legs 36 1228.10Table 4. Acoustic survey summary for the SI Cetacean REA May-June 2004.<strong>Solomon</strong> <strong>Islands</strong> Cetacean REA May 10 – June 16 2004Listening stations 49Acoustic encounter rate (% ofcontacts/stations) – all cetacean species.51.0Acoustic encounter rate (%) – sperm whales 8.2Estimated acoustic coverage (nm 2 ) -spermwhales (6.0 nm detection radius/station) 5541.8Estimated acoustic coverage (nm 2 ) -oceanicdolphins (2.5 nm detection radius/station)962.11496
Oceanic Cetaceans & Associated HabitatsFiguresFigure 1. <strong>Solomon</strong> <strong>Islands</strong>’ provinces and main islands (including eastern provinces not included in this <strong>Marine</strong> <strong>Assessment</strong>) and geographic location ofthe <strong>Solomon</strong> <strong>Islands</strong> in the Pacific (insert).497
<strong>Solomon</strong> <strong>Islands</strong> <strong>Marine</strong> <strong>Assessment</strong> Technical ReportFigure 2. Approximate track of vessel FeBrina during the SI Cetacean REA (as digitized from the passage charts), not including the passages to/fromPapua New Guinea.498
Oceanic Cetaceans & Associated HabitatsFigure 3. Cetacean species diversity and distribution in the SI Cetacean REA: May – June 2004 (n=52).499
<strong>Solomon</strong> <strong>Islands</strong> <strong>Marine</strong> <strong>Assessment</strong> Technical ReportFigure 4. Distribution and diversity of acoustic contacts recorded on listening stations conducted during the SI Cetacean REA: May – June 2004. (n=49).Note: track does not include PNG-SI passage during which 3 listening stations were made on the Mono Isl. – Guadalcanal leg – in The Slot to the N of NewGeorgia.500
Oceanic Cetaceans & Associated HabitatsFigure 5a-d. Summary of visual survey effort for the SSI Cetacean REA: May – June 2004Figure 5a. Active visual survey time per habitatzone (n = 160.0 survey hours)Figure 5b. Visual survey distance ranges (n =1228.1 nautical mile) for each survey day ( n=36days).Active survey hours(%)50403020100Oceanic Coastal StraitHabitat zoneSurvey days (%)60402000-20 21-40 41-60 61-100Nautical miles surveyed/dayFigure 5c. Number of cetacean sightings persurvey day (total survey days n=36).Figure 5d. Number of species identified persurvey day (total survey days n=36).Survey days (%)302520151050Survey days(%)4030201000 1 2 3 4Cetacean sightings/day (n)0 1 2 3Species identified/day (n)501
<strong>Solomon</strong> <strong>Islands</strong> <strong>Marine</strong> <strong>Assessment</strong> Technical ReportFigure 6. Species-specific sighting frequencies for the SI Cetacean REA: May – June 2004 (% oftotal sightings, n=52).60%Sighting frequency (%)50%40%30%20%10%0%Bottlenose dolphinIndo-Pacific bottlenose dolphinOrcaPan-tropicalspotted dolphinRisso's dolphinRorqual whaleRough-toothed dolphinShort-finned pilot whaleSmall cetaceanSpinner dolphinMesoplodon beaked whaleFigure 7. Species-specific frequency of total individual count (n=815) for the SI Cetacean REA:May – June 2004.80%Total individual count (%)70%60%50%40%30%20%10%0%Bottlenose dolphinIndo-Pacific bottlenose dolphinOrcaPan-tropicalspotted dolphinRisso's dolphinRorqual whaleRough-toothed dolphinShort-finned pilot whaleSmall cetaceanSpinner dolphinMesoplodon beaked whale502
Oceanic Cetaceans & Associated HabitatsFigure 8a-f. Summary of visual survey effort and results for each SI Cetacean REA leg.Figure 8a. Visual survey effort per SI CetaceanREA legVisual surveyeffort (nm - log)100001000100101123SI REA Leg45All - SIPNG-SIFigure 8b. Number of cetacean speciespositively identified per SI Cetacean REA leg.Species - visual(n)10.0008.0006.0004.0002.0000.000123SI REA Leg45All - SIPNG-SIFigure 8c. Species diversity index (speciesidentified/nm) per SI Cetacean REA leg.Species diversityindex0.0300.0250.0200.0150.0100.0050.000123SI REA Leg45All - SIPNG-SIFigure 8d. Sightings index (sightings/nm) per SICetacean REA leg.Sightings/nm0.080.060.040.020.00123SI REA Leg45All - SIPNG-SIFigure 8e. Total individual count index(count/nm) per SI Cetacean REA leg.Total individualcount/nm2.001.501.000.500.00123SI REA Leg45All - SIPNG-SIFigure 8f. Average visual conditions per SICetacean REA leg.Visual conditions4.03.02.01.00.0123SI REA Leg45All - SIPNG-SI503
<strong>Solomon</strong> <strong>Islands</strong> <strong>Marine</strong> <strong>Assessment</strong> Technical ReportFigure 9. Acoustic survey categories for all listening stations conducted during the SI Cetacean REA:May – June 2004.Frequency ofall acosutic contacts (%)5040302010Oceanic dolphins (Delphinidae)0'Blackfish' (Globicephalinae)Sperm whales (Physeteridae)No contactFigure 10. Acoustic survey categories for positive cetacean contacts only.Frequency of\cetacean acoustic categories (%)9080706050403020100Oceanic dolphins (Delphinidae)'Blackfish' (Globicephalinae)Spermwhales (Physeteridae)504
Oceanic Cetaceans & Associated HabitatsFigure 11a-d. Summary of acoustic survey effort and results for the SI Cetacean REA legs, includingthe PNG-SI passage.Figure 11a. Hydrophone listening stations(passive bio-acoustic monitoring) conducted foreach leg.Figure 11b. Percentage of acoustic contact withcetaceans during the hydrophone listeningstations conducted each leg.Listening stations(n)50403020100123SI REA Leg45All - SIPNG-SIAcoustic contact -all species (%)1007550250123SI REA Leg45All - SIPNG-SIFigure 11c. Ratio of acoustic contact withsperm whales over all acoustic contacts for eachleg.Figure 11d. Average acoustic conditions duringeach leg.Acoustic contact -sperm whales (%)60402001234SI REA Leg5All - SIPNG-SIAcousticconditions4.03.02.01.00.0123SI REA Leg45All - SIPNG-SIFigure 12. Frequencies of cetacean species associations (% of total sightings) recorded during the SICetacean REA: May – June 2004.Species association rate(% of total sightings)86420Bottlenose dolphinPan-tropical spotted dolphinShort-finned pilot whaleSpinner dolphin505
<strong>Solomon</strong> <strong>Islands</strong> <strong>Marine</strong> <strong>Assessment</strong> Technical ReportFigure 13a-b. Environmental conditions – visual and acoustic – during the SI Cetacean REA.Figure 13a. Frequency of sighting conditionsduring the SI Cetacean REA.Survey days (%)25201510501.5 2.0 2.5 3.0 3.5 4.0 5.0Sighting conditionsFigure 13b. Frequency of acousticconditions/listening station during the SICetacean REA.Listening stations(%)353025201510501233.544.5Acoustic conditions5Figure 13c. Frequency of acoustic conditions/survey day during the SI Cetacean REA.Survey days (%)201612840Please refer to relevant sections for more details.2.02.53.03.54.04.55.0>5.0Acoustic conditions506
Oceanic Cetaceans & Associated HabitatsFigure 14. Distribution of skipjack (top) and yellowfin (bottom) average catch in the western PacificOcean, 1988-1992.The maximum circle size represents annual catches of 39,200 mt for skipjack and 26,000 mt foryellowfin. The rectangle indicates the Gilbert <strong>Islands</strong> area (from Hampton and Sibert 1995, asreproduced and quoted in Hampton et al. 1995).507
<strong>Solomon</strong> <strong>Islands</strong> <strong>Marine</strong> <strong>Assessment</strong> Technical ReportFigure 15: Photos of several cetacean species and activities during the <strong>Solomon</strong> <strong>Islands</strong> <strong>Marine</strong><strong>Assessment</strong>.abcdefgh508
Oceanic Cetaceans & Associated Habitatsijkla) A sperm whale (Physeter macrocephalus) commences a deep a foraging dive, Sulawesi Sea,Indonesia (acoustic identification only during the <strong>Solomon</strong> <strong>Islands</strong> <strong>Marine</strong> Assesment).b) Fauro Island residents (Shortland <strong>Islands</strong>) ‘call’ spinner dolphins (Stenella longirostris) tobow ride with their speedboat, by banging a paddle against the inside of the hull.c) The narrow reef lagoon entrance of Fanalei village, part of the most difficult phase of thetraditional dolphin hunt.d) Interviews canvassing information on local cetaceans and traditional dolphin hunting withFanalei elders and community members (photo by D. Wachenfeld).e) Indo-Pacific bottlenose dolphins (Tursiops aduncus), Gavutu live-capture and dolphin displayfacility, Florida <strong>Islands</strong>.f) Members of a Makira village paddle out to greet the survey vessel. Such encounters wereroutine in most anchorages and an opportunity to ask for local knowledge on cetaceans.g) Short-finned pilot whales (Globicephala macrorhynchus) log (rest) and spy hop (head risingvertically above the surface) near a reef lagoon entrance.h) Spinner dolphins (Stenella longirostris) approach the survey vessel to bow ride.i) Pantropical spotted dolphins (Stenella attenuata) travelling at high speed.j) Traditional <strong>Solomon</strong> <strong>Islands</strong> bamboo band and dances.k) Orcas (Orcinus orca) traveling along coral reef drop-off (photo by W.Atu).l) Stranded false killer whale (Pseudorca crassidens) skeleton reassembled as an educationaldisplay – Arnavon Island research station.Photos © APEX Environmental 2004 except where noted.509
<strong>Solomon</strong> <strong>Islands</strong> <strong>Marine</strong> <strong>Assessment</strong> Technical ReportAppendicesAppendix 1. Shortlisted references and historical records relating to <strong>Solomon</strong> <strong>Islands</strong> cetaceans andtraditional dolphin drives of Malaita 10 .1. Akimichi. 1992. The surviving whale-tooth: Cultural significances of whale products inOceania. Bull. National Mus. Ethnol. 17:121-142.2. Akin, D. 1981. Porpoise teeth in East Kwaio Artwork Journal of the traditional moneyassociation Vol. 2(1).Akin, D. (1993). Negotiating culture in East Kwaio, Malaita Appendix 2: Kwaio shellmoney making and use of porpoise teeth. PhD dissertation. Dept. of Anthropology, Univ.of Hawaii, USA.3. Boyd, D (date uncertain). Introduction to porpoise hunting on Fanifi, <strong>Solomon</strong> <strong>Islands</strong>.Columbia University (typescript manuscript, 40pp).4. British <strong>Solomon</strong> <strong>Islands</strong> Protectorate – Special Duties Fisheries). 1973. Dried porpoise meat.Government Memorandum No. 443/4/10 (currently the Fisheries Department of the<strong>Solomon</strong> <strong>Islands</strong>).5. British <strong>Solomon</strong> <strong>Islands</strong> Protectorate – Office of the District Commissioner. 1965. Backgroundpaper: Malaita porpoise hunting. Government Memorandum No. M/22/7/1 from Pepys-Cockerell J.L., former District Officer Of North Malaita.6. Dawbin, W.H. (1966). Porpoise and porpoise hunting in Malaita. Australian Natural History15(7): 207-211.7. Dawbin, W.H. 1974 Cetacea of the south western Pacific Ocean. Background paper toFAO/ACMRR, La Jolla, USA.8. Goto, M. Nagatome, I. and Shimada, H. Cruise report of the cetacean sighting survey in watersoff the <strong>Solomon</strong> <strong>Islands</strong> in 1994. Paper presented to the International WhalingCommission - IWC SC/47/SH12 (survey conducted between September 17 th and October5 th , 1994).9. Hill, L 1989. Traditional Porpoise Harvest in the <strong>Solomon</strong> <strong>Islands</strong>. A preliminary report fromthe University of Papua New Guinea, Port Moresby, PNG.10. Ivens Rev. W.G. 1902. Porpoise hunting. The Southern Cross Log July 1: 21-22. (letter andnotes on Malaita dolphin hunting).11. Leatherwood. S. (date uncertain) Introduction to porpoise hunting of Fanifi, <strong>Solomon</strong> <strong>Islands</strong>.Colombia University. Report F/10/13 and Appendix 6 from unpublished M.Sc. thesis.12. Miyashita, T. Kato, H and T. Kasuya, eds. 1995. Worldwide map of cetacean distribution basedon Japanese sighting ata (Volume 1). National Research Institute of Far Seas Fisheries,Shizuoka, Japan. 140pp.13. Miyazaki, N. and Wada, S. (1978). Observations of cetacea during whale marking cruise in thewestern tropical Pacific, 1976. Scientific Reports of the Whales Research Institute, Tokyo30: 179-195.14. Takekawa, D. (1996a). Ecological knowledge of Fanalei villagers about dolphins: dolphinhunting in <strong>Solomon</strong> <strong>Islands</strong> 1. Senri Ethnological Studies No. 42. Osaka: NationalMuseum of Ethnology, 5565. Japan.15. Takekawa, D. (1996b). The method of dolphin hunting and the distribution of teeth and meat:dolphin hunting in <strong>Solomon</strong> <strong>Islands</strong> 2. Senri Ethnological Studies No. 42. Osaka: NationalMuseum of Ethnology, 6780. Japan.16. Takekawa, D. (1996c). Hunting method and the ecological knowledge of dolphins among theFanalei villagers of Malaita, <strong>Solomon</strong> <strong>Islands</strong>. South Pacific Commission (SPC)Traditional <strong>Marine</strong> Resource Management and Knowledge Information Bulletin #12.10 These papers were kindly made available by R. Reeves, Chair IUCN SSC – Cetacean Specialist Group.510
Oceanic Cetaceans & Associated HabitatsAppendix 2. Brief summary of CITES (Convention on International Trade in Endangered Species ofWild Fauna and Flora).The Convention on International Trade in Endangered Species of Wild Fauna and Flora (CITES) is aninternational agreement between Governments. Its aim is to ensure that international trade inspecimens of wild animals and plants does not threaten their survival. States (countries) adherevoluntarily to CITES. States that have agreed to be bound by the Convention ('joined' CITES) areknown as Parties. Although CITES is legally binding on the Parties - in other words they have toimplement the Convention - it does not take the place of national laws. Rather it provides a frameworkto be respected by each Party, which has to adopt its own domestic legislation to make sure thatCITES is implemented at the national level.CITES works by subjecting international trade in specimens of selected species to certain controls.These require that all import, export, re-export and introduction from the sea of species covered by theConvention has to be authorized through a licensing system. ('Re-export' means export of a specimenthat was imported.) The species covered by CITES are listed in three Appendices, according to thedegree of protection they need. Appendix I includes species threatened with extinction (most whalespecies and some dolphin species are listed).Trade in specimens of these species is permitted only in exceptional circumstances. Appendix IIincludes species not necessarily threatened with extinction (all cetacean species not listed underAppendix I are listed here), but in which trade must be controlled in order to avoid utilizationincompatible with their survival. An export permit may be issued only if the specimen was legallyobtained; the trade will not be detrimental to the survival of the species; and in case of an Appendix I-listed species, an import permit has already been issued. Appendix III contains species that areprotected in at least one country, which has asked other CITES Parties for assistance in controlling thetrade (Further information on www.cites.org).511
<strong>Solomon</strong> <strong>Islands</strong> <strong>Marine</strong> <strong>Assessment</strong> Technical ReportAppendix 3. Summary of marine fisheries in the <strong>Solomon</strong> <strong>Islands</strong>.The tuna purse seine fleet of the <strong>Solomon</strong> <strong>Islands</strong> is currently made up of three domestic vessels andup to 80 vessels in the licensed foreign fleet (P. Ramohia – Senior Fisheries Officer, SI FisheriesDepartment, pers. comm. in June 2004). The latter includes vessels from the USA (the largest foreignflag fleet operating in the SI with up to 40 vessels licensed), Japan, Korea, Taiwan and other nations.Tuna purse seiners catch tuna all over the Pacific, and are not restricted to SI waters. Typically, theUSA vessels have bilateral agreements with up to 30 Pacific nations (P. Ramohia, pers. comm.). Mostships are licensed for 500 tonnes.The vessel’s captain decides in which nation/port the catch is landed and processed.There are two landing and refueling ports in SI: Honiara (Guadalcanal) and Noro (Gizo area, NewGeorgia). Honiara is the main longline port as sashimi is landed and flown overseas 2-3 times a week.Noro is the preferred port for processing tuna through its cannery. The civil unrest (2000-2002) hashad a major impact on this component of the industry especially. There are 40 trained <strong>Solomon</strong><strong>Islands</strong> observers on the fleet, as part of the Pacific observer program. Total Allowable Catch (TAC)is monitored via this observer program (P. Ramohia, pers. comm.).The fisheries situation of the <strong>Solomon</strong> <strong>Islands</strong> is characterized by (from FAO and SCP sources -http://www.fao.org/fi/fcp/en/SLB/profile.htm):A. The large importance of both subsistence fisheries and the offshore industrial fisheries fortuna;‘<strong>Solomon</strong> <strong>Islands</strong> coastal and offshore waters are rich tuna grounds and have traditionally beenexploited by distant-water fishing fleets. Japanese long liners have fished in the zone since at least1962 and annual catches have ranged up to 9,500 t (1978), but have been around 3,000 - 4,000 t in thelate 1990s. Catches are dominated by yellowfin tuna (typically 60%) with albacore and bigeye makingup the balance. Effort is directed to more northern and western areas. Domestically-based fishingoperations commenced in 1971. The domestic pole-and-line fleet has also operated since 1971 withcatches approaching 40,000 t in 1986, a peak year. Effort is concentrated around the Main GroupArchipelago where baitfish supplies are most readily available. The fishery shows strong cyclicalvariation, with peaks every three or four years, a feature which seems to be linked to El Niño events(Lehodey 2001). Initially the domestic tuna fishery was primarily a pole-and-line fishery, but groupseining was commenced in 1984 and later single-seining was undertaken using two governmentownedvessels as well as vessels chartered from Australia, Taiwan and Japan. In the late 1990s thepurse seine fishery was basically comprised of three domestic vessels which caught around 11,000 tper year. Operations are concentrated around the Main Group Archipelago. Other vessels have beenlicensed in recent years, but little information on their activities is available. US purse seine vesselsalso have access to a small part of the zone under the Multi-lateral Treaty, but in recent years the USfleet has fished to the east of the <strong>Solomon</strong> <strong>Islands</strong> zone. Since 1995 several joint-venture tuna longlining enterprises have operated from shore-bases in the <strong>Solomon</strong> <strong>Islands</strong>. The total catch of tunas inthe <strong>Solomon</strong> <strong>Islands</strong> EEZ in 1999 was 73,493 t. The local industrial tuna fleet in that year consisted of20 long liners, 5 purse seiners, and 30 pole/line boats. The catches by country in the <strong>Solomon</strong> zone in1999 were:Fishing Fiji FSM Japan Kiribati Korea PNG <strong>Solomon</strong> Taiwan USA TOTALNationMetrictonne1 49 4 85 909 18 69,092 2,228 1,107 73,493(Units: metric tonnes, Source: SPC Catch and Effort Log sheet Database with adjustments)Since 1999 the tuna fishing situation has deteriorated due to the social unrest. Catches in 2000 havebeen estimated to be less than half of the 1999 level.512
Oceanic Cetaceans & Associated HabitatsB. Lesser important small-scale commercial fisheries near the urban centres:About 90% of the <strong>Solomon</strong> <strong>Islands</strong>’ population is living in rural areas, so subsistence and artisanalfishing activities are widespread and of great importance. These fisheries are concentrated on coastaland nearshore reefs and lagoons. The target resources are reef associated finfish, beche de mer,trochus, giant clam, lobster, and turbo. About 180 species of reef finfish, from 30 families, are caughtby the small-scale rural fisheries. The catch is comprised, mostly, of Lutjanids (snappers), Serranids(groupers and rock cods), Lethrinids (emperors), Scombrids (mackerels) and Carangids (trevallies).The small-scale commercial fisheries are mainly located near the main urban area of Honiara, and to amuch lesser extent, around the towns of Auki on Malaita Island and Gizo in the west. These fisheriesare oriented to providing primarily finfish to wage-earning residents. The other common form ofsmall-scale commercial fishing is that for non-perishable fishery products for export. The mostimportant of these items are trochus shells, beche-de-mer, and shark fins. These commodities are animportant source of cash for <strong>Solomon</strong> Islanders, especially in the isolated villages since the demise ofthe copra industry. With an average production of about 400 t per year of trochus, the <strong>Solomon</strong><strong>Islands</strong> is the largest producer in the Pacific <strong>Islands</strong> region.’513
<strong>Solomon</strong> <strong>Islands</strong> <strong>Marine</strong> <strong>Assessment</strong> Technical ReportAppendix 4. By-catch and discard in western Pacific tuna fisheries.(Source: The Secretariat of the Pacific Community (SPC) – Oceanic Fisheries Programme reports -http://www.spc.int/oceanfish/Html/TEB/Bill&Bycatch/index.htm).’The Western and Central Pacific Ocean (WCPO) currently supports the largest industrial tuna fisheryin the world, with an estimated catch in 1992 of 1,089,607 mt in the SPC statistical area alone.Skipjack is the most important of the four major tuna species in the fishery, accounting for 67 per centof the catch by weight in 1992, followed by yellowfin (24.5%), bigeye (5%) and albacore (3%). Purseseine gear was responsible for 80 per cent of the total catch, with pole-and-line gear accounting for 7per cent, longline gear 12 per cent and troll gear 1 per cent. All of these fisheries invariably havesome level of catch of non-target species (termed ‘by-catch’). A portion of this by-catch is discardedbecause it has little or no economic value, and, if retained, would take up storage capacity best usedfor the more valuable tuna species. A portion of the target catch is also often discarded for economicreasons, or because it is damaged, physically too small for efficient processing, or lost because of gearfailures during fishing operations.Billfish and by-catch growth studies.While we remain largely ignorant about the impacts of tuna fisheries on by-catch species and pelagicecosystems, it is obvious that these impacts have increased very significantly over the last 50 years astuna fisheries worldwide have expanded their catches and efforts by orders of magnitude. However,we have little or no information on the relative abundances or biomasses of many components of thepelagic ecosystem.Observer programs, conducted by regional and national organizations, have developed over the lasttwo to three decades. In general, these observer programs were created to monitor activities such ascompliance with licensing agreements and restrictions on incidental catches. In addition to providinginformation required for meeting those objectives, observer programs provide essentially the onlyreliable, detailed information on catches discarded at sea. Based on such observer programs in theWCPO the main by-catch species of tuna fisheries are billfish, sharks, escolar, wahoo, mahi-mahi,rainbow runner, and opah.’514
Oceanic Cetaceans & Associated HabitatsAppendix 5. Media Statement from <strong>Solomon</strong> Island Government Communications Unit on newpolicy banning dolphin export tradeGOVERNMENT COMMUNICATIONS UNITDepartment of the Prime Minister and CabinetP O Box G1HONIARA,SOLOMON ISLANDS TEL: + (677) 25 369DIRECTOR: + (677) 28153 FAX: + (677) 28 154Mobile Tel: + (677) 95235E-mail Address: alomae@solomon.com.sbMEDIA STATEMENTSOLOMON ISLANDS GOVERNMENT SLAPS BAN ON DOLPHIN EXPORTThe Government of <strong>Solomon</strong> <strong>Islands</strong> today announced a ban on dolphin export, saying its action is toensure <strong>Solomon</strong> <strong>Islands</strong> maintains its good standing in the international community. The Minister forFisheries and <strong>Marine</strong> Resources, Hon Paul Maenu and the Minister for Forests, Environment andConservation, Hon David Holosivi jointly announced in Honiara today that the ban is immediate.Hon Maenu and Hon Holosivi said the measure was taken to address concerns raised by members ofthe international community following export of dolphins from <strong>Solomon</strong> <strong>Islands</strong> last year. “As aresponsible member of the international community, <strong>Solomon</strong> <strong>Islands</strong> has a duty to ensure concernsregarding its conduct are given due consideration. In this regard, we are pleased to announce that the<strong>Solomon</strong> <strong>Islands</strong> Government, through Cabinet has approved a new policy on further exports ofdolphins from <strong>Solomon</strong> <strong>Islands</strong>,” the Ministers said.“Under this new policy which Cabinet approved yesterday, no dolphins would be exported from<strong>Solomon</strong> <strong>Islands</strong>”.Appropriate regulations to bring this policy into effect are being developed and would be implementedjointly by the Department of Fisheries and <strong>Marine</strong> Resources and the Department of Forestry,Environment and Conservation. The Ministers said the new policy initiative does not and will notaffect the domestic use of dolphins inherent in <strong>Solomon</strong> <strong>Islands</strong> traditional practices.-END-Alfred MaesuliaDirectorGovernment Communications UnitPlease attribute all press releases to Government Communications Unit,Department of the Prime Minister and Cabinet.For further information please contact telephones: (677) 25369, 28153 Mobile: 95235515
Appendix IAPPENDIX I. GPS Coordinates for Coral Reef SurveysThe two coral reef teams surveyed adjacent sites in the same general vicinity (see<strong>Solomon</strong> <strong>Islands</strong> <strong>Marine</strong> <strong>Assessment</strong> this report). The following is a summary of GPScoordinates for the Coral Reef Biodiversity and Reef Health team (Table A) and theCoral Reef Resources team (Table B).Table A. Site names and GPS Coordinates (Decimal Degree format) for sitessurveyed by the Coral Reef Biodiversity and Reef Health team (see Coral Diversity,Coral Communities and Reef Health, and Coral Reef Fish Diversity Chapters, thisreport).ISLAND/ ISLANDGROUPSITE NUMBER SITE NAME LATITUDE LONGITUDEFlorida <strong>Islands</strong> 1 Sandfly FL -9.03563 160.10538Florida <strong>Islands</strong> 2 Kombuana -8.84300 160.03378Isabel 3 Buala -8.14553 159.63475Isabel 4 Tatamba -8.41667 159.78333Isabel 5 Tanabafe -8.35168 159.44102Isabel 6 Popongori -8.20510 159.23058Isabel 7 Sarao -8.00617 158.91263Isabel 8 Palunuhukura -7.84648 158.72198Isabel 9 Isabel -7.56270 158.31747Isabel 10 Kia -7.55668 158.42577Isabel 11 Barora Fa -7.49885 158.39593Isabel 12 Ghaghe -7.41797 158.21097Isabel 13 Pt Praslin -7.39557 158.24097Isabel 14 Malaghara -7.39378 158.13192Isabel 15 Malakobi -7.35482 158.05443Arnavon <strong>Islands</strong> 16 Kerehikapa 1 -7.46093 158.04323Arnavon <strong>Islands</strong> 17 Kerehikapa 2 -7.47467 158.04790Choiseul 18 Raverave -7.54053 157.78977Choiseul 19 Vealaviru -7.42580 157.53825Choiseul 20 Ndolola -7.41437 157.41735Choiseul 21 Poro -7.35647 157.27855Choiseul 22 Emerald -6.69260 156.39090Choiseul 23 Taro -6.69473 156.40087Choiseul 24 Chirovanga -6.61540 156.56642Choiseul 25 Vurango -6.63830 156.57695Shortland <strong>Islands</strong> 26 Haliuna -6.92110 156.10438Shortland <strong>Islands</strong> 27 Rohae -7.00947 156.06863Shortland <strong>Islands</strong> 28 Tua -7.07117 155.89607Shortland <strong>Islands</strong> 29 Stirling 1 -7.40790 155.54375Shortland <strong>Islands</strong> 30 Stirling 2 -7.41133 155.54738New Georgia 31 Vella Lavella -7.73845 156.51415New Georgia 32 Njari -8.01360 156.75697New Georgia 33 Nusazango -8.31488 157.22275New Georgia 34 Roviana -8.39502 157.33248New Georgia 35 Penguin -8.64518 157.80345New Georgia 36 Uepi -8.42595 157.95213New Georgia 37 Vangunu -8.53748 158.02502New Georgia 38 Minjanga -8.70433 158.21452New Georgia 39 Mbili -8.66158 158.20388Russell <strong>Islands</strong> 40 Mbaisen -8.99313 159.09675Russell <strong>Islands</strong> 41 Kovilok -8.97085 159.12422517
<strong>Solomon</strong> <strong>Islands</strong> <strong>Marine</strong> <strong>Assessment</strong> Technical ReportISLAND/ ISLANDGROUPSITE NUMBER SITE NAME LATITUDE LONGITUDERussell <strong>Islands</strong> 42 Sunlight -9.12080 159.15682Russell <strong>Islands</strong> 43 Taina -9.13338 159.13647Guadalcanal 44 Cormorant -9.83770 160.90382Guadalcanal 45 Marapa -9.81472 160.86343Makira 46 Anuta -10.35182 161.35832Makira 47 Makira -10.47495 161.51008Makira 48 Star 1 -10.78293 162.27208Makira 49 Star 2 -10.81508 162.27698Three Sisters <strong>Islands</strong> 50 Malaupaina 1 -10.24743 161.95470Three Sisters <strong>Islands</strong> 51 Malaupaina 2 -10.27158 161.97045Makira 52 Bio -10.18663 161.67692Makira 53 Ugi -10.28982 161.71963Malaita 54 Komusupa -9.40617 161.18963Malaita 55 Umu -9.48707 161.25217Malaita 56 Pt Adams -9.56397 161.55210Malaita 57 Leili1 -8.75833 160.99167Malaita 58 Leili 2 -8.77833 161.02500Malaita 59 Toi -8.32220 160.65962Malaita 60 Suafa -8.31333 160.67833Indispensible Strait 61 Alite 1 -8.87910 160.61017Indispensible Strait 62 Alite 2 -8.87333 160.61000Nughu Island 63 Nughu -9.28848 160.33718Florida <strong>Islands</strong> 64 Tulaghi -9.09773 160.19223Savo Island 65 Savo -9.11790 159.78538Guadalcanal 66 Tambea -9.25150 159.67660Table B. Site names and GPS Coordinates (Decimal Degree format) for sitessurveyed by the Coral Reef Resources team (see Benthic Communities, FisheriesResources: Food and Aquarium Fishes, and Fisheries Resources: CommerciallyImportant Macroinvertebrates Chapters, this report).ISLAND/ ISLANDGROUPSITENUMBERSITE NAME EXPOSURE LATITUDE LONGITUDEFlorida <strong>Islands</strong> 1 Tulaghi Switzer Sheltered 160.09846 -9.03581Florida <strong>Islands</strong> 2 Kombuana Exposed 160.03690 -8.84390Isabel 3 Buala Exposed 159.63600 -8.14680Isabel 4 Tirahi Sheltered 159.79450 -8.41150Isabel 5 Tanabafe Exposed 159.31162 -8.30549Isabel 6 Babao Sheltered 159.23120 -8.20660Isabel 7 Sarao Exposed 158.90890 -8.00170Isabel 8 Palunuhukura Sheltered 158.72190 -7.84620Isabel 9 Matavaghi Sheltered 158.31220 -7.55940Isabel 10 Rapita Sheltered 158.39990 -7.48190Isabel 11 Kale Exposed 158.31770 -7.43120Isabel 12 Vakao Sheltered 158.30240 -7.43580Isabel 13 Sibau Exposed 158.08740 -7.38780Isabel 14 Malakobi Sheltered 158.15110 -7.38520Arnavon <strong>Islands</strong> 15 Tuma Exposed 158.04310 -7.47300Arnavon <strong>Islands</strong> 16 Kerehikapa Sheltered 158.04180 -7.46040Choiseul 17 Raverave Exposed 157.78600 -7.54680Choiseul 18 Ondolou Sheltered 157.72790 -7.51940518
Appendix IISLAND/ ISLANDGROUPSITENUMBERSITE NAME EXPOSURE LATITUDE LONGITUDEChoiseul 19 Boe Boe Sheltered 157.39740 -7.41200Choiseul 20 Poro Exposed 157.09210 -7.35910Choiseul 21 Taro Exposed 156.39210 -6.72260Choiseul 22 Putuputurau Sheltered 156.40440 -6.70180Choiseul 23 Sirovanga Exposed 156.56510 -6.61460Choiseul 24 Vurango Sheltered 156.57670 -6.60140Shortland <strong>Islands</strong> 25 Rohae 1 Exposed 156.07350 -7.00030Shortland <strong>Islands</strong> 26 Rohae 2 Sheltered 156.05440 -7.00030Shortland <strong>Islands</strong> 27 Onua Exposed 155.89960 -7.08630Shortland <strong>Islands</strong> 28 Faisa Sheltered 155.87070 -7.06240Vella Lavella 29 Vella Lavella Exposed 156.51030 -7.72660Gizo 30 Njari Exposed 156.76020 -8.01420New Georgia 31 Munda Sheltered 157.22900 -8.33780New Georgia 32 Haipe Exposed 157.26990 -8.43620Marovo 33 Veru Exposed 157.79790 -8.64134Marovo 34 Landoro Exposed 157.92935 -8.42073Marovo 35 Lumalihe Sheltered 158.06020 -8.47210Marovo 36 Toatelave Exposed 158.19750 -8.65020Marovo 37 Mbili Sheltered 158.19230 -8.67300Russell <strong>Islands</strong> 38 Lisamata Exposed 159.14690 -8.96590Russell <strong>Islands</strong> 39 Mbutata Sheltered 159.11760 -8.99480Russell <strong>Islands</strong> 40 Alokan Exposed 159.10320 -9.14240Russell <strong>Islands</strong> 41 Mbanika Sheltered 159.15480 -9.12290Guadalcanal 42 Honoa Exposed 160.88940 -9.81720Guadalcanal 43 Wainipareo Sheltered 160.86100 -9.81090Makira 44 Haurmanu Exposed 161.38000 -10.34800Makira 45 Marautewa Sheltered 161.50840 -10.47600Makira 46 Naone Exposed 162.28360 -10.80600Makira 47 Na Mugha Sheltered 162.28030 -10.81600Three Sisters <strong>Islands</strong> 48 Malaupaina 1 Exposed 161.95210 -10.23200Three Sisters <strong>Islands</strong> 49 Malaupaina 2 Sheltered 161.97070 -10.27000Uki Ni Masi Island 50 Pio Exposed 161.67720 -10.18900Uki Ni Masi Island 51 Pawa Sheltered 161.71523 -10.26279Malaita 52 Airasi Sheltered 161.18970 -9.39650Malaita 53 Maroria Exposed 161.22758 -9.45748Malaita 54 Arai Sheltered 161.33330 -9.33650Malaita 55 Anuta Exposed 161.30150 -9.32360Malaita 56 Leli 1 Exposed 161.01730 -8.77320Malaita 57 Leli 2 Sheltered 161.02050 -8.75630Malaita 58 Suafa 1 Exposed 160.66650 -8.31740Malaita 59 Suafa 2 Sheltered 160.69500 -8.33610Malaita 60 Falaubulu 1 Exposed 160.72660 -8.84080Malaita 61 Falaubulu 2 Sheltered 160.73060 -8.84030Florida <strong>Islands</strong> 62 Nughi Exposed 160.34630 -9.28280Florida <strong>Islands</strong> 63 Ghavutu Sheltered 160.18890 -9.10820Savo Island 64 Savo Exposed 159.78300 -9.13290Guadalcanal 65 Tambea Exposed 159.65650 -9.26300Guadalcanal 66 Bonegi Exposed 159.88070 -9.39370519