Article

Comparative Mitogenome Analyses Uncover Mitogenome Features and Phylogenetic Implications of the Parrotfishes (Perciformes: Scaridae)

1
Key Laboratory of South China Sea Fishery Resources Exploitation and Utilization, Ministry of Agriculture and Rural Affairs, South China Sea Fisheries Research Institute, Chinese Academy of Fishery Sciences, Guangzhou 510300, China
2
Scientific Observation and Research Station of Xisha Island Reef Fishery Ecosystem of Hainan Province, Key Laboratory of Efficient Utilization and Processing of Marine Fishery Resources of Hainan Province, Sanya Tropical Fisheries Research Institute, Sanya 572018, China
3
Guangdong Provincial Key Laboratory of Fishery Ecology Environment, Guangzhou 510300, China
4
Observation and Research Station of Pearl River Estuary Ecosystem, Guangzhou 510300, China
5
Key Laboratory of Aquatic Biodiversity and Conservation, Institute of Hydrobiology, Chinese Academy of Sciences, Wuhan 430072, China
*
Authors to whom correspondence should be addressed.
Biology 2023, 12(3), 410; https://doi.org/10.3390/biology12030410
Submission received: 31 January 2023 / Revised: 28 February 2023 / Accepted: 2 March 2023 / Published: 7 March 2023
(This article belongs to the Special Issue Integrating Science into Aquatic Conservation)

Abstract

:

Simple Summary

Parrotfishes are among the most colorful and diverse inhabitants of the coral reefs and sea grass beds and are ecologically important in these habitats. Here, we presented the complete mitogenome sequences from twelve parrotfish species and conducted comparative analysis of mitogenome features among the seven published species for the first time. The comparative analysis revealed both the conserved and unique characteristics of parrotfish mitogenomes. The mitogenome structure, organization, gene overlaps, putative secondary structures of transfer RNAs, and codon usage were relatively conserved among all the analyzed species. However, the base composition and the intergenic spacers varied largely among species. All of the protein-coding genes were under purifying selection. Phylogenetic analysis revealed that the parrotfishes could be divided into two clades with distinct ecological adaptations. Early divergence of these two clades was probably related to the expansion of sea grass habitat, and later diversifications were likely associated with the geomorphology alternation since the closing of the Tethys Ocean. This work offered fundamental materials for further studies on the evolution and conservation of parrotfishes.

Abstract

In order to investigate the molecular evolution of mitogenomes among the family Scaridae, the complete mitogenome sequences of twelve parrotfish species were determined and compared with those of seven other parrotfish species. The comparative analysis revealed that the general features and organization of the mitogenome were similar among the 19 parrotfish species. The base composition was similar among the parrotfishes, with the exception of the genus Calotomus, which exhibited an unusual negative AT skew in the whole mitogenome. The PCGs showed similar codon usage, and all of them underwent a strong purifying selection. The gene rearrangement typical of the parrotfishes was detected, with the tRNAMet inserted between the tRNAIle and tRNAGln, and the tRNAGln was followed by a putative tRNAMet pseudogene. The parrotfish mitogenomes displayed conserved gene overlaps and secondary structure in most tRNA genes, while the non-coding intergenic spacers varied among species. Phylogenetic analysis based on the thirteen PCGs and two rRNAs strongly supported the hypothesis that the parrotfishes could be subdivided into two clades with distinct ecological adaptations. The early divergence of the sea grass and coral reef clades occurred in the late Oligocene, probably related to the expansion of sea grass habitat. Later diversification within the coral reef clade could be dated back to the Miocene, likely associated with the geomorphology alternation since the closing of the Tethys Ocean. This work provided fundamental molecular data that will be useful for species identification, conservation, and further studies on the evolution of parrotfishes.

1. Introduction

The mitochondrial genome (mitogenome) of a vertebrate is a small (16–17 kb), compact, and circular double-stranded molecule, typically encoding 13 protein-coding genes (PCGs), 22 transfer RNA genes (tRNAs), two ribosomal RNA genes (rRNAs), and two non-coding regions (the origin of L-strand replication, OL, and control region, CR) [1]. The mitochondrial DNA sequences have been extensively employed in a variety of study areas, from phylogeography, which elucidates the spatial arrangement of genetic variation among populations or closely related species [2,3,4], to phylogenetic studies, which decipher the evolutionary relationships across a wide range of taxa at higher taxonomic levels [5,6,7]. Compared to single or a few mitochondrial gene-based markers, the complete mitogenome sequences generally provide much finer phylogenetic resolution [8]. Moreover, genome-level characteristics, including nucleotide composition, genome structural arrangement, overlap, and non-coding intergenic spacers between genes, vary largely among different species and might possess evolutionary significance [9,10,11].
Parrotfishes (Scaridae) are among the most colorful and diverse inhabitants of coral reefs and sea grass beds [12]. Currently, a total of 100 species belonging to 10 genera are recognized, with Scarus being the most specious genus (52 species) [13]. These fish are mainly herbivorous, foraging mostly by excavating or scraping surfaces of rocks and carbonate substrate that are encrusted with algae, bacterial mats, and detritus [14]. As such, it is widely recognized that parrotfishes play an important role in marine bioerosion [15,16] and serve as determinants of benthic community structure [17]. For example, parrotfish can exert a top-down control on algal communities to provide more space and resources for coals and promote the attachment and recruitment of coral larvae [18,19,20]. Therefore, it can help to mitigate the competition between coral reefs and macroalgae and increase the resilience of coral reef ecosystems subjected to anthropogenic or natural disturbances [21,22]. In addition, the excavating and scraping species can break the reef framework into sand-sized sediments and facilitate the cycling of calcium carbonate on reefs, which are also dispensable agents in reef erosion and sediment production and transport [23,24].
Deciphering mitogenome structures and sequences can provide insights into evolutionary processes and contribute to species delimitation and conservation efforts [25,26]. Despite the fact that parrotfishes play an irreplaceable role in coral reef and sea grass bed habitats due to their unique behavioral and ecological characteristics, only a few studies have addressed their mitogenome characteristics [27,28,29], and comparative analysis is scarce. Although a handful of works have tried to elaborate on the phylogenetic relationships among the parrotfishes [30,31,32], none of them have addressed this question from a mitogenomic perspective. The deficiency of mitogenome data and comparative works hindered us from understanding the evolution of the parrotfish and establishing proper management and conservation decisions. In the present study, we reported twelve parrotfish mitogenomes for the first time and conducted comparative analysis with the published sequences from other seven species to elaborate the detailed features of the parrotfish mitogenomes. Additionally, we also investigated the phylogenetic relationships among these parrotfishes and estimated divergence times using mitogenome data. We hope that our newly generated data and results will provide some insights into the evolution of the parrotfishes as well as contributions towards the identification and conservation of these fishes.

2. Materials and Methods

2.1. Sampling, DNA Extraction, PCR Amplification, and Sequencing

In the present study, we de novo sequenced twelve parrotfish species (with one specimen each): Calotomus carolinus, Cetoscarus bicolor, Hipposcarus longiceps, Scarus globiceps, Scarus chameleon, Scarus rivulatus, Scarus dimidiatus, Scarus oviceps, Scarus frenatus, Scarus niger, Scarus prasiognathos, and Scarus quoyi. The specimens of parrotfish were obtained from the Xisha Islands (15°46′~17°08′ N, 111°11′~112°54′ E), China, and deposited in the South China Sea Fisheries Research Institute, Chinese Academy of Fishery Sciences. Thirteen published mitogenome sequences from seven parrotfish species (Bolbometopon muricatum, KY235362/NC033901; Calotomus japonicus, AP017568/NC035427; Chlorurus sordidus, AP006567; Scarus forsteni, FJ619271/NC011928; Scarus ghobban, FJ449707/NC011599; Scarus rubroviolaceus, FJ227899/NC011343; Scarus schlegeli, FJ595020/NC011936) were also included in the analysis.
Genomic DNA was extracted from either a small piece of flesh or a pelvic fin clip taken from the right side of the specimen using the E.Z.N.A.® Tissue DNA Kit (OMEGA, Beijing, China) and following the manufacturer’s instructions. High-quality DNA samples were randomly broken into fragments with a length of 300~500 bp. Then complete genomic libraries were established using the Illumina TruSeqTM Nano DNA Sample Prep Kit (Illumina, San Diego, CA, USA) following the manufacturer’s recommendation. The 150-bp paired-end sequencing was performed on the Illumina HiSeq2500 platform. Library construction and sequencing were performed by the Biozeron Corporation (Shanghai, China).

2.2. Sequence Assembly, Annotation, and Analyses

Prior to assembly, raw reads were filtered by Trimmomatic v0.39 [33] in order to remove the reads with adaptors, the reads showing a quality score below 20 (Q < 20), the reads containing a percentage of uncalled bases (“N” characters) equal to or greater than 10%, and the duplicated sequences. GetOrganelle 1.7.5 was used to assemble the mitogenomes [34]. The newly generated mitogenome sequences were deposited in Genbank under the accession numbers OQ349180-OQ349191. Annotation of the mitogenomes (PCGs, tRNAs, rRNAs, and CR) was performed using MITOS [35] and Mitoannotator v3.83 [36]. Transfer RNA (tRNA) genes and their secondary structures were determined by the MITOS webserver [35]. The base composition and codon distributions were analyzed in MEGA 7.0 [37], and the nucleotide composition skewness was calculated using the formulas (A − T)/(A + T) for AT skew and (G − C)/(G + C) for GC skew. Relative synonymous codon usage (RSCU) was calculated using DAMBE 7 [38]. The conserved sequence block domains (CSBs) were determined by comparing them with those of other species [1].

2.3. Phylogenetic Analyses

Prior to the phylogenetic analysis, the method of Xia et al. [39] was used to access substitution saturation of the sequences by comparing the information entropy-based index (ISS) with critical values (ISS.c) in DAMBE 7 [38]. If ISS is significantly lower than ISS.c, then sequences have not experienced substitution saturation. The sequence of the control region showed significant substitution saturation (ISS = 1.1897 > ISS.c = 0.7851, p < 0.001) and was thus excluded from further analysis. The phylogenetic relationships were reconstructed using the 13 PCGs and 2 rRNAs of the 19 parrotfish mitogenomes. Three Cheilinus species (C. fasciatus, NC037707; C. oxycephalus, NC061045; C. undulatus, NC013842) were used as outgroup taxa. Multiple sequence alignment was performed using MAFFT [40] implemented in PhyloSuite [41] under default parameters and subsequently checked by eye in SeaView [42]. Our dataset was partitioned by gene and codon position, and then the best-fit nucleotide substitution model for each partition was determined using Modelfinder [43]. Phylogenetic relationships were reconstructed using Bayesian inference (BI) and maximum likelihood (ML) approaches. BI was carried out in Mr. Bayes 3.2.7 [44]. Two independent Markov chains were run with 1 × 10⁶ iterations, and 10,000 trees were retained, with the first 25% of the samples discarded as burn-in. ML analysis was conducted in IQTREE [45] under 10,000 ultrafast bootstrap replicates. DNAsp 6 [46] was used to calculate non-synonymous substitution rates (dN), synonymous substitution rates (dS), and the ratio of dN/dS (ω).
MCMCTree, implemented in the PAML4.9i software package [47], was used to estimate the divergence time among the parrotfishes. The tree topology generated from BI was calibrated with fossil dates. The information of branch lengths, gradients, and hessian were first estimated with a maximum likelihood method in BsaeML of the PAML package. Then the MCMC approximation was performed with a burn-in period of 50,000 cycles, and a total of 10,000 samples were generated every 50 iterations. Two independent runs were performed. Tracer 1.7 [48] was used to check for effective sample sizes (ESS) of parameters. The ESS larger than 200 were considered to reach convergence.
Two fossil calibration points were used in the divergence time estimation. Calotomus preisli was known from the middle Miocene (~14 Ma) in Austria [49]. We calibrated the minimum age of the split between the sea grass clade and the coral reef clade using this fossil. The fossil elements belonging to the genus Bolbometopon were known from the late Miocene (~5.3 Ma) [49]. These fossils were used to set the minimum age of the separation between Bolbometopon and Cetoscarus. The root age of our phylogeny was set to be lower than 50 Ma, for the oldest known labrid fossil was dated back to 50 Ma from the Monte Bolca in Italy [50].

3. Results

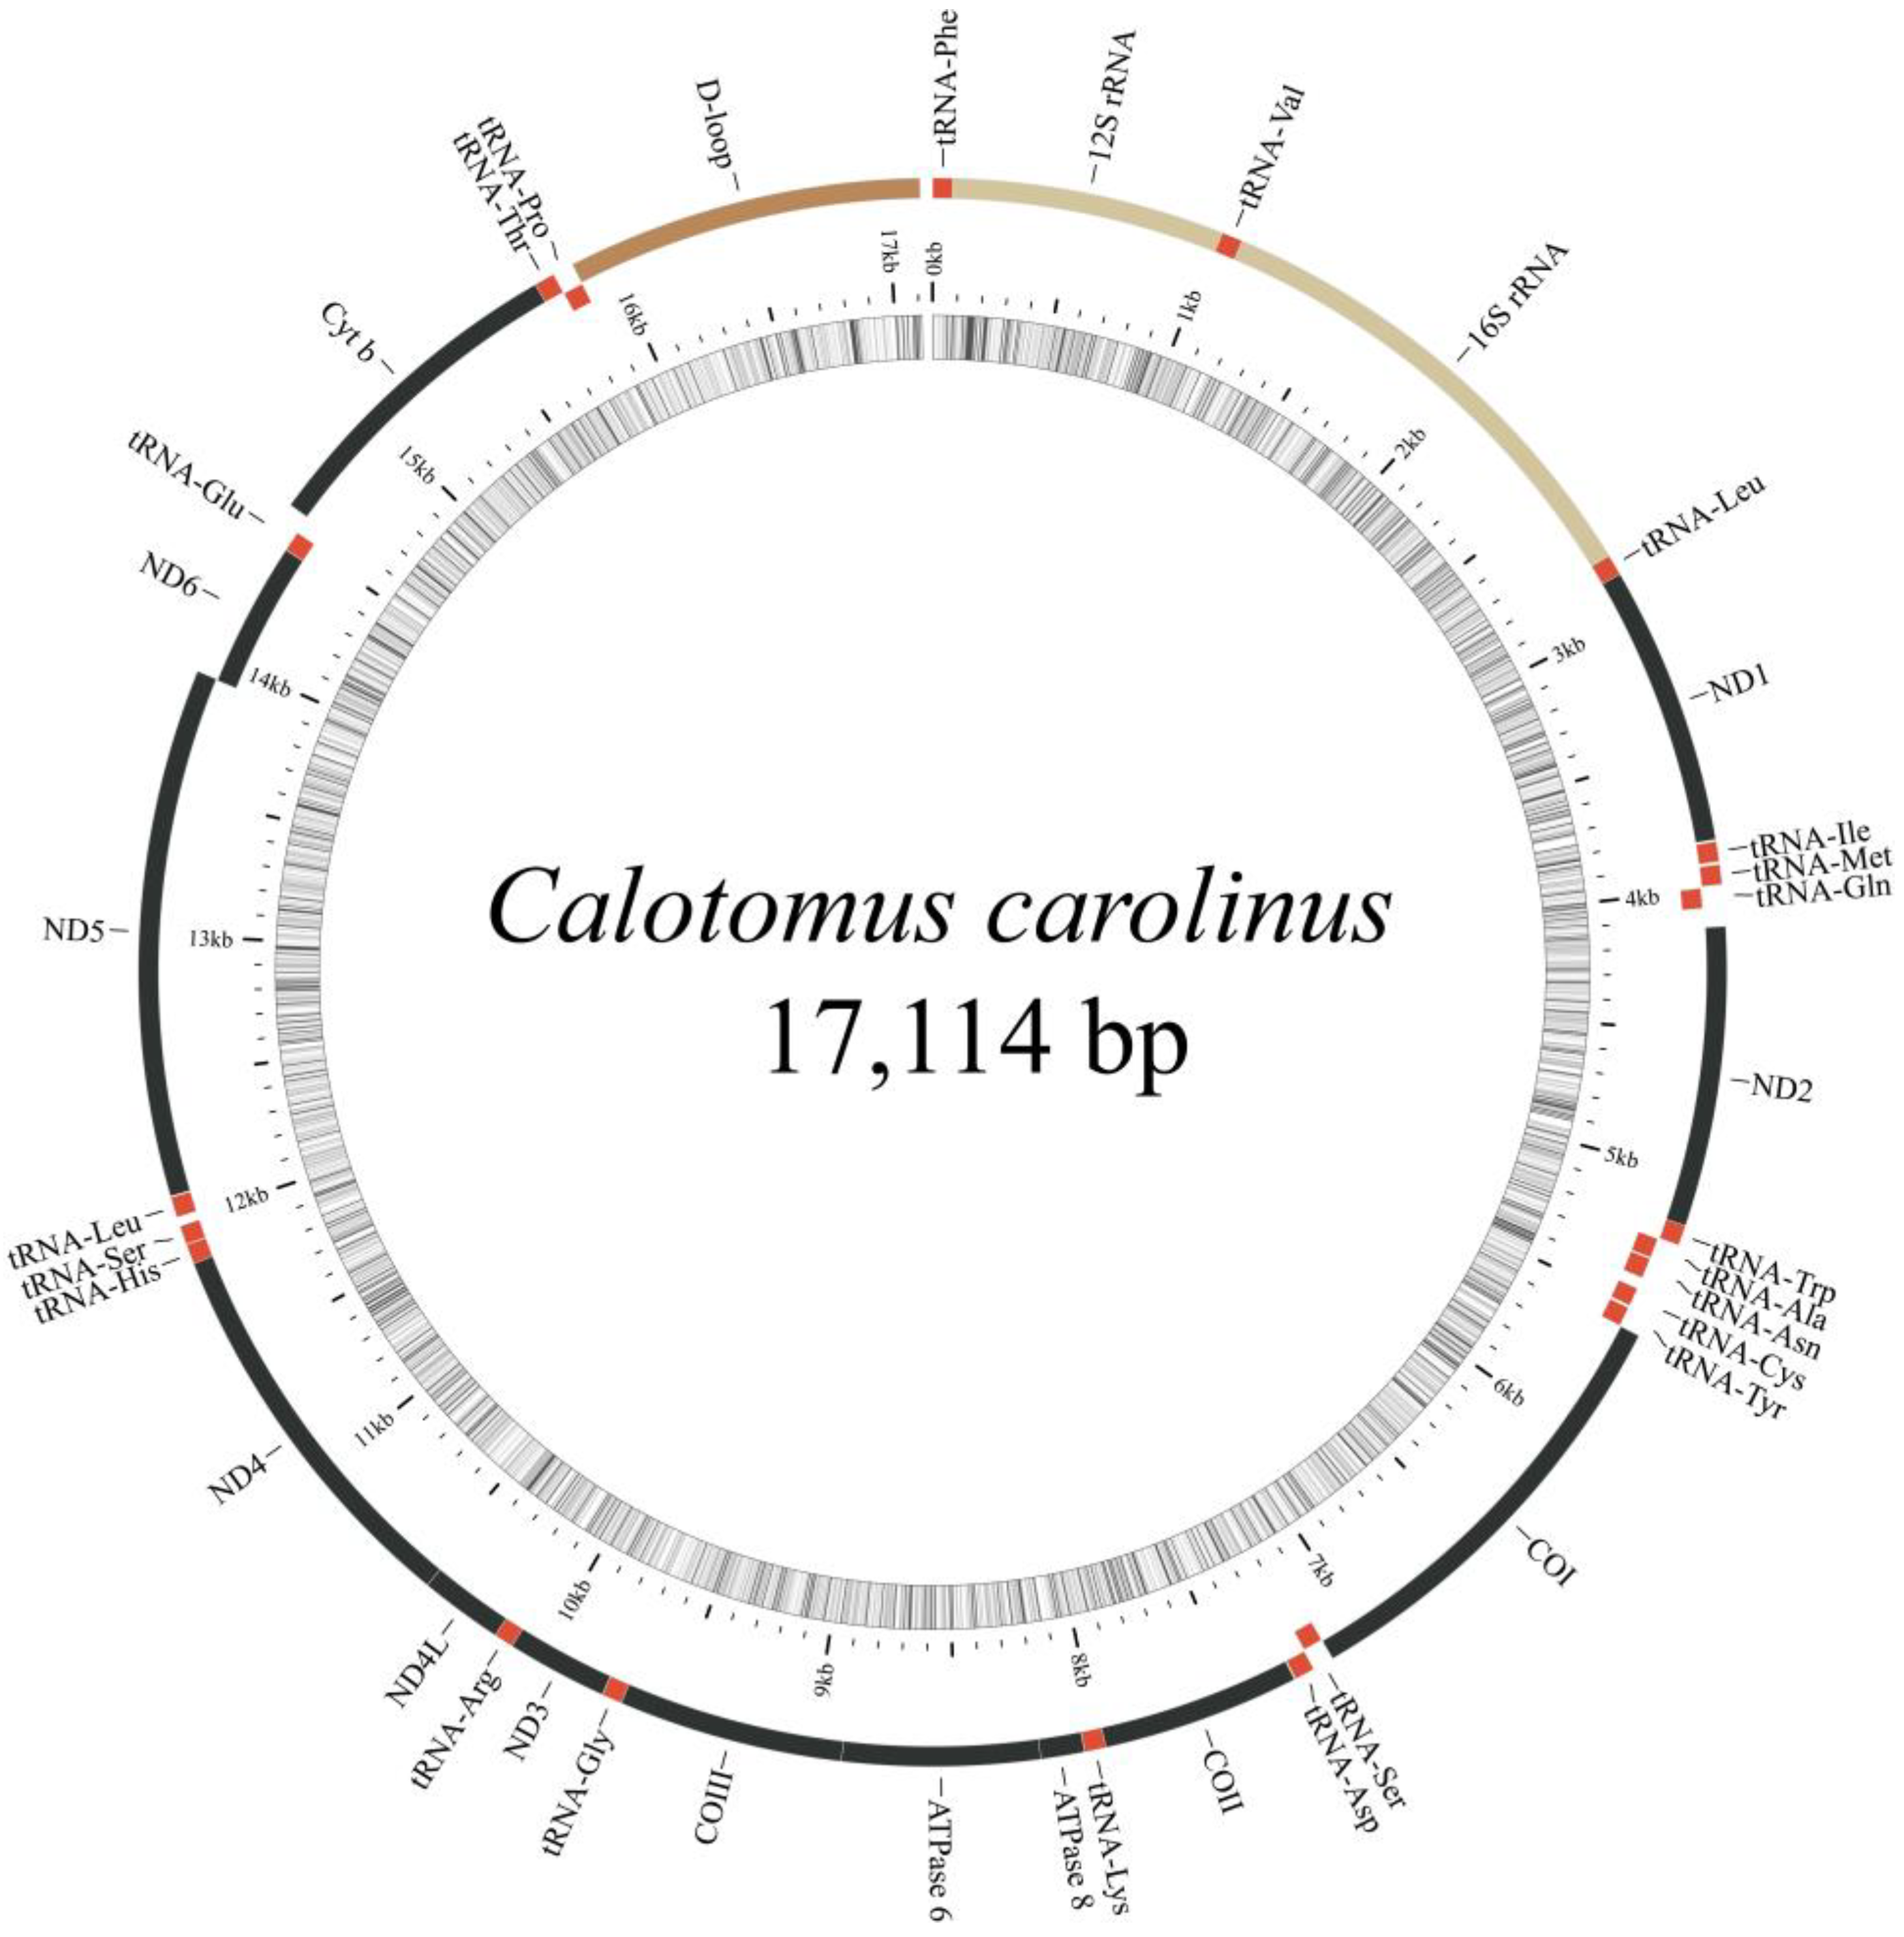
3.1. General Features of Mitochondrial Genomes

The total length of the 12 newly sequenced complete mitogenomes ranged from 16,657 bp in Scarus niger to 16,816 bp in Scarus globiceps. The typical set of 37 genes, including 13 PCGs, two rRNAs, and 22 tRNAs, and a control region, were detected in all the mitogenomes (Table 1, Figure 1, Supplementary File S1: Table S1). All PCGs were encoded on the Heavy (H) strand except for NADH dehydrogenase subunit 6 (ND6), which was located on the Light (L) strand. Eight tRNAs (tRNAGln, tRNAAla, tRNAAsn, tRNACys, tRNATyr, tRNASer (UGA), tRNAGlu and tRNAPro) were located on the L-strand, and the remaining 14 tRNAs were on the H-strand (Figure 1, Table 1). This coding pattern on the H and L-strand was identical among the 19 parrotfish species (Additional File 1: Table S1) and was consistent with most vertebrates [51].

3.2. Nucleotide Composition of the Parrotfish Mitogenomes and Unusual AT Skew of Calotomus Species

The nucleotide composition was similar among all of the parrotfish species, with the overall A + T content ranging from 53.0% in Scarus globiceps to 56.4% in Bolbometopon muricatum, and the A + T content was the lowest in ND4L (51.7 ± 3.6%) and the highest in the control region (62.6 ± 4.1%) (Figure 2a, Additional File 1: Table S2). All of the parrotfish mitogenomes exhibited AT bias, with the largest and most positive value observed in the rRNAs and the smallest and most negative value found in ND6 (Figure 2b, Additional File 1: Table S3). Compared with other parrotfishes, species of the genus Calotomus exhibited an unusual AT skew for the whole mitogenomes with a slightly negative value (−0.04 to −0.02), while other species all displayed a positive value (Figure 2b, Additional File 1: Table S3). These results indicated that species of the genus Calotomus displayed an excess of T over A in the whole mitogenome.

3.3. Protein-Coding Genes

The total length of PCGs ranged from 11,391 bp to 11,415 bp, with ATP8 being the shortest (168 bp) and ND5 being the longest (1839 bp to 1848 bp). Most genes exhibited the typical start codon ATN. However, COI initiated with GTG in all species, and ATP6 started with GTG in Calotomus japonicus and Scarus oviceps or CTG in Calotomus carolinus (Additional File 1: Table S1). Four types of stop codons were detected, including two canonical (TAA and TAG) and two truncated codons (T-- and TA-) (Additional File 1: Table S1). The incomplete stop codons were commonly observed in fish mitogenomes [1] and might be completed by post-transcriptional polyadenylation [52].
For all the parrotfish mitogenomes, Leu(CUN), Ala, and Thr were the three most frequently translated amnio acids, while Cys was the least used amnio acid (Figure 3a). Moreover, the most frequently used codon was CGA for arginine in all the parrotfish mitogenomes (Figure 3b). The RSCU revealed that degenerate codons were biased to use more A and T than G and C in the third codon position, which resulted in higher A + T content than G + C content in the third codon position of parrotfish mitogenomes (Figure 2a and Figure 3b, Supplementary File S2: Figure S1).

3.4. Gene Rearrangement and Secondary Structure of tRNAs

All 22 tRNAs typical of the mitogenomes of vertebrates were found in the parrotfish mitogenomes (Figure 4a). Most tRNAs could be folded into the canonical clover-leaf secondary structure. The secondary structure of tRNAs generally consisted of four domains and a short variable loop: the amino acid acceptor (AA) stem, the dihydrouridine (D) arm (D stem and loop), the anticodon (AC) arm (AC stem and loop), the thymidine (T) arm (T stem and loop), and the variable (V) loop (Figure 4a). However, tRNASer(AGN) in Bolbometopon muricatum and Calotomus japonicus possessed only small loop(s) in their D arms (Figure 4b), thus not forming the typical clover-leaf structure. A gene rearrangement of the tRNA gene cluster between ND1 and ND2 was detected, with the tRNAMet inserted between the tRNAIle and tRNAGln, and the tRNAGln was followed by a putative tRNAMet pseudogene.

3.5. Overlaps and Non-Coding Intergenic Spacers

A total of four gene overlaps were detected in the mitogenome of Calotomus carolinus and five were observed in the mitogenomes of other parrotfishes (Table 1, Additional File 1: Table S1). The longest overlap was found between ATP8 and ATP6, with highly conserved 10-bp motifs of “ATGGCACTAA” or “ATGACACTAA” detected in most parrotfish mitogenomes except for that of the genus Calotomus. The latter genus showed 16-bp overlaps of “CTGACCTTGGCACTAG” or “GTGGCCCTGGCACTAG”. Apart from that, a 7-bp overlap was observed between ND4L and ND4 in all parrotfish mitogenomes with highly conserved sequences of “ATGCTAA” or “ATGTTAA”.
Two long intergenic spacers (IGS; tRNAGln-ND2 and OL) were found in all the parrotfish mitogenomes. Moreover, another long IGS between tRNAGlu and Cyt b was also found in the mitogenomes of the genus Calotomus. As mentioned above, the IGS between tRNAGln and ND2 was assumed to be a pseudogene of tRNAMet. OL is located within the five tRNA gene cluster (WANCY), and its secondary structure showed a stable stem-loop hairpin, which is strengthened by 9 to 10 G-C base pairs (Figure 5). The G-C base pairs on the stem were highly conserved, while the loop varied in its base composition, with T being scarce.
The control region, located between tRNAPro and tRNAPhe, was the most variable region and constituted the majority of the length variation of the parrotfish mitogenomes (Additional File 1: Table S1). Only three conserved sequence blocks (CSB-D, CSB-I, and CSB-II) were detected (Figure 6), with CSB-III completely missing in all the parrotfish mitogenomes. The base composition was extremely unique to each CSB, with CSB-D being T rich, CSB-I being AT rich, and CSB-II being C rich (Table 2).

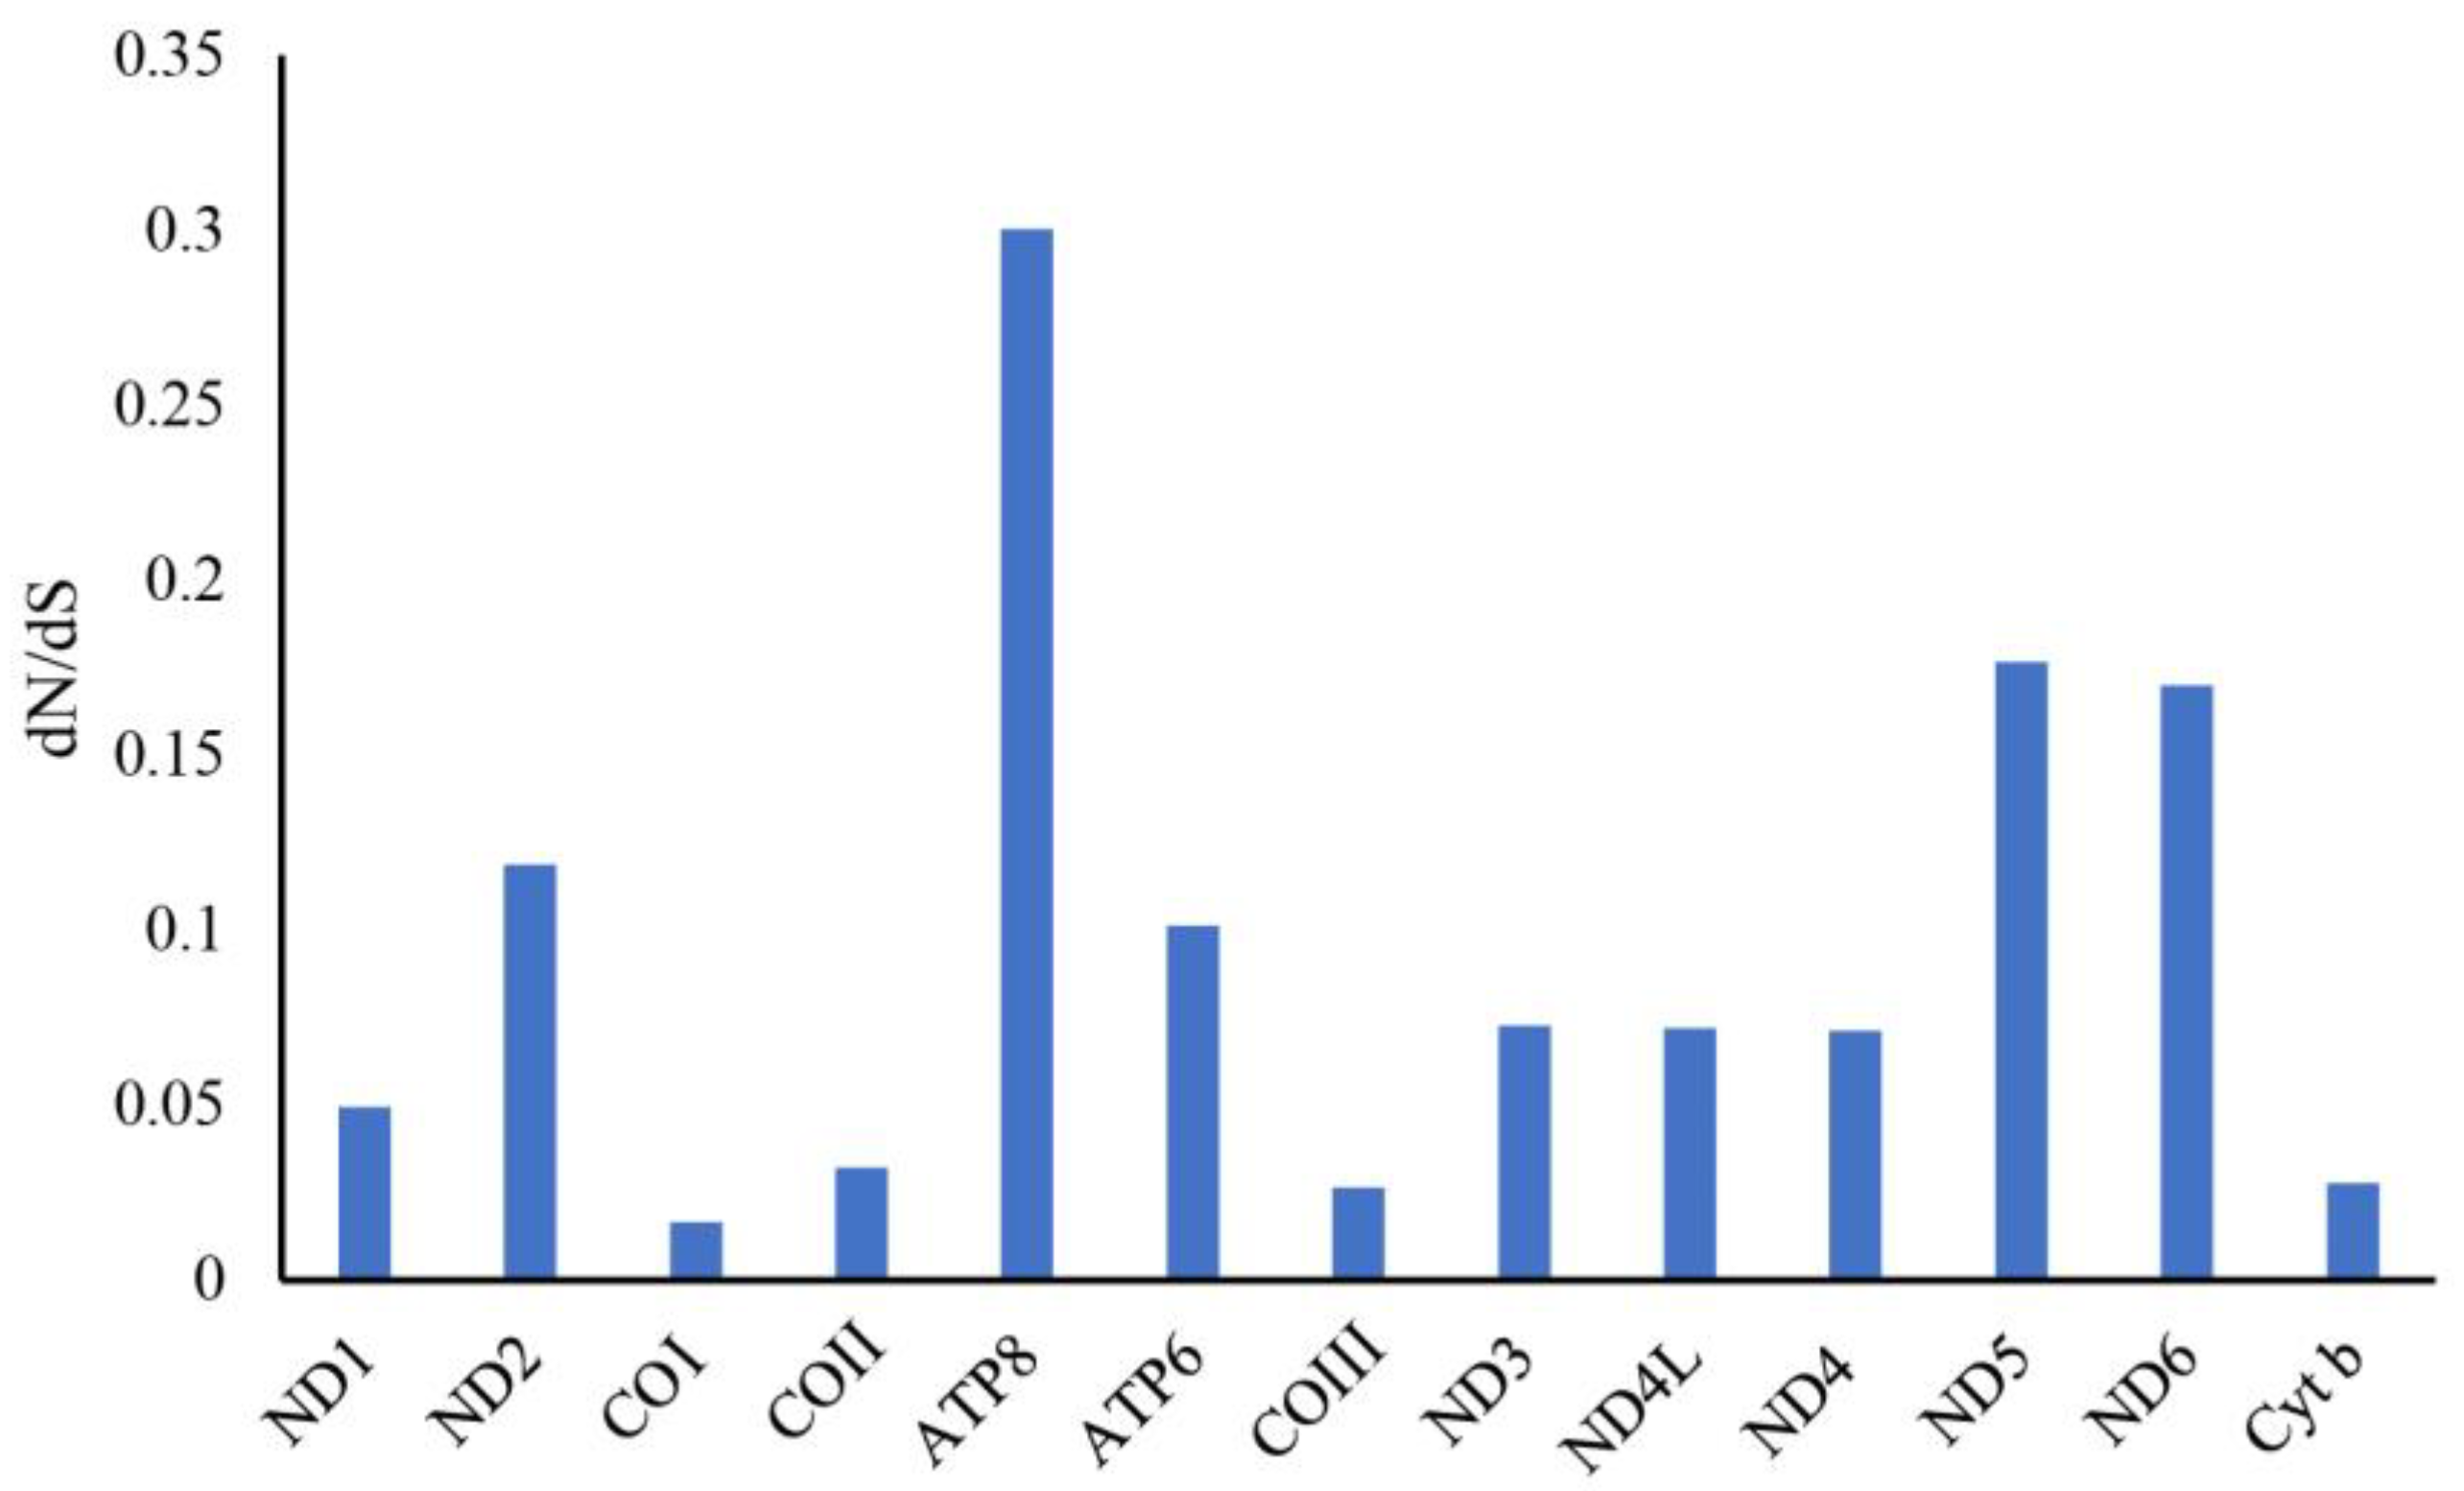
3.6. Non-Synonymous and Synonymous Substitutions

To better understand the role of selective pressure and the evolutionary patterns of the protein coding genes, the dN/dS value (ω) of each PCG was calculated (Figure 7). All of the PCGs were subject to purifying selection, with a dN/dS value lower than 1 (ω < 1). Among which, ATP8 and COI presented the highest and lowest ω values (ω = 0.300 and 0.016), respectively.

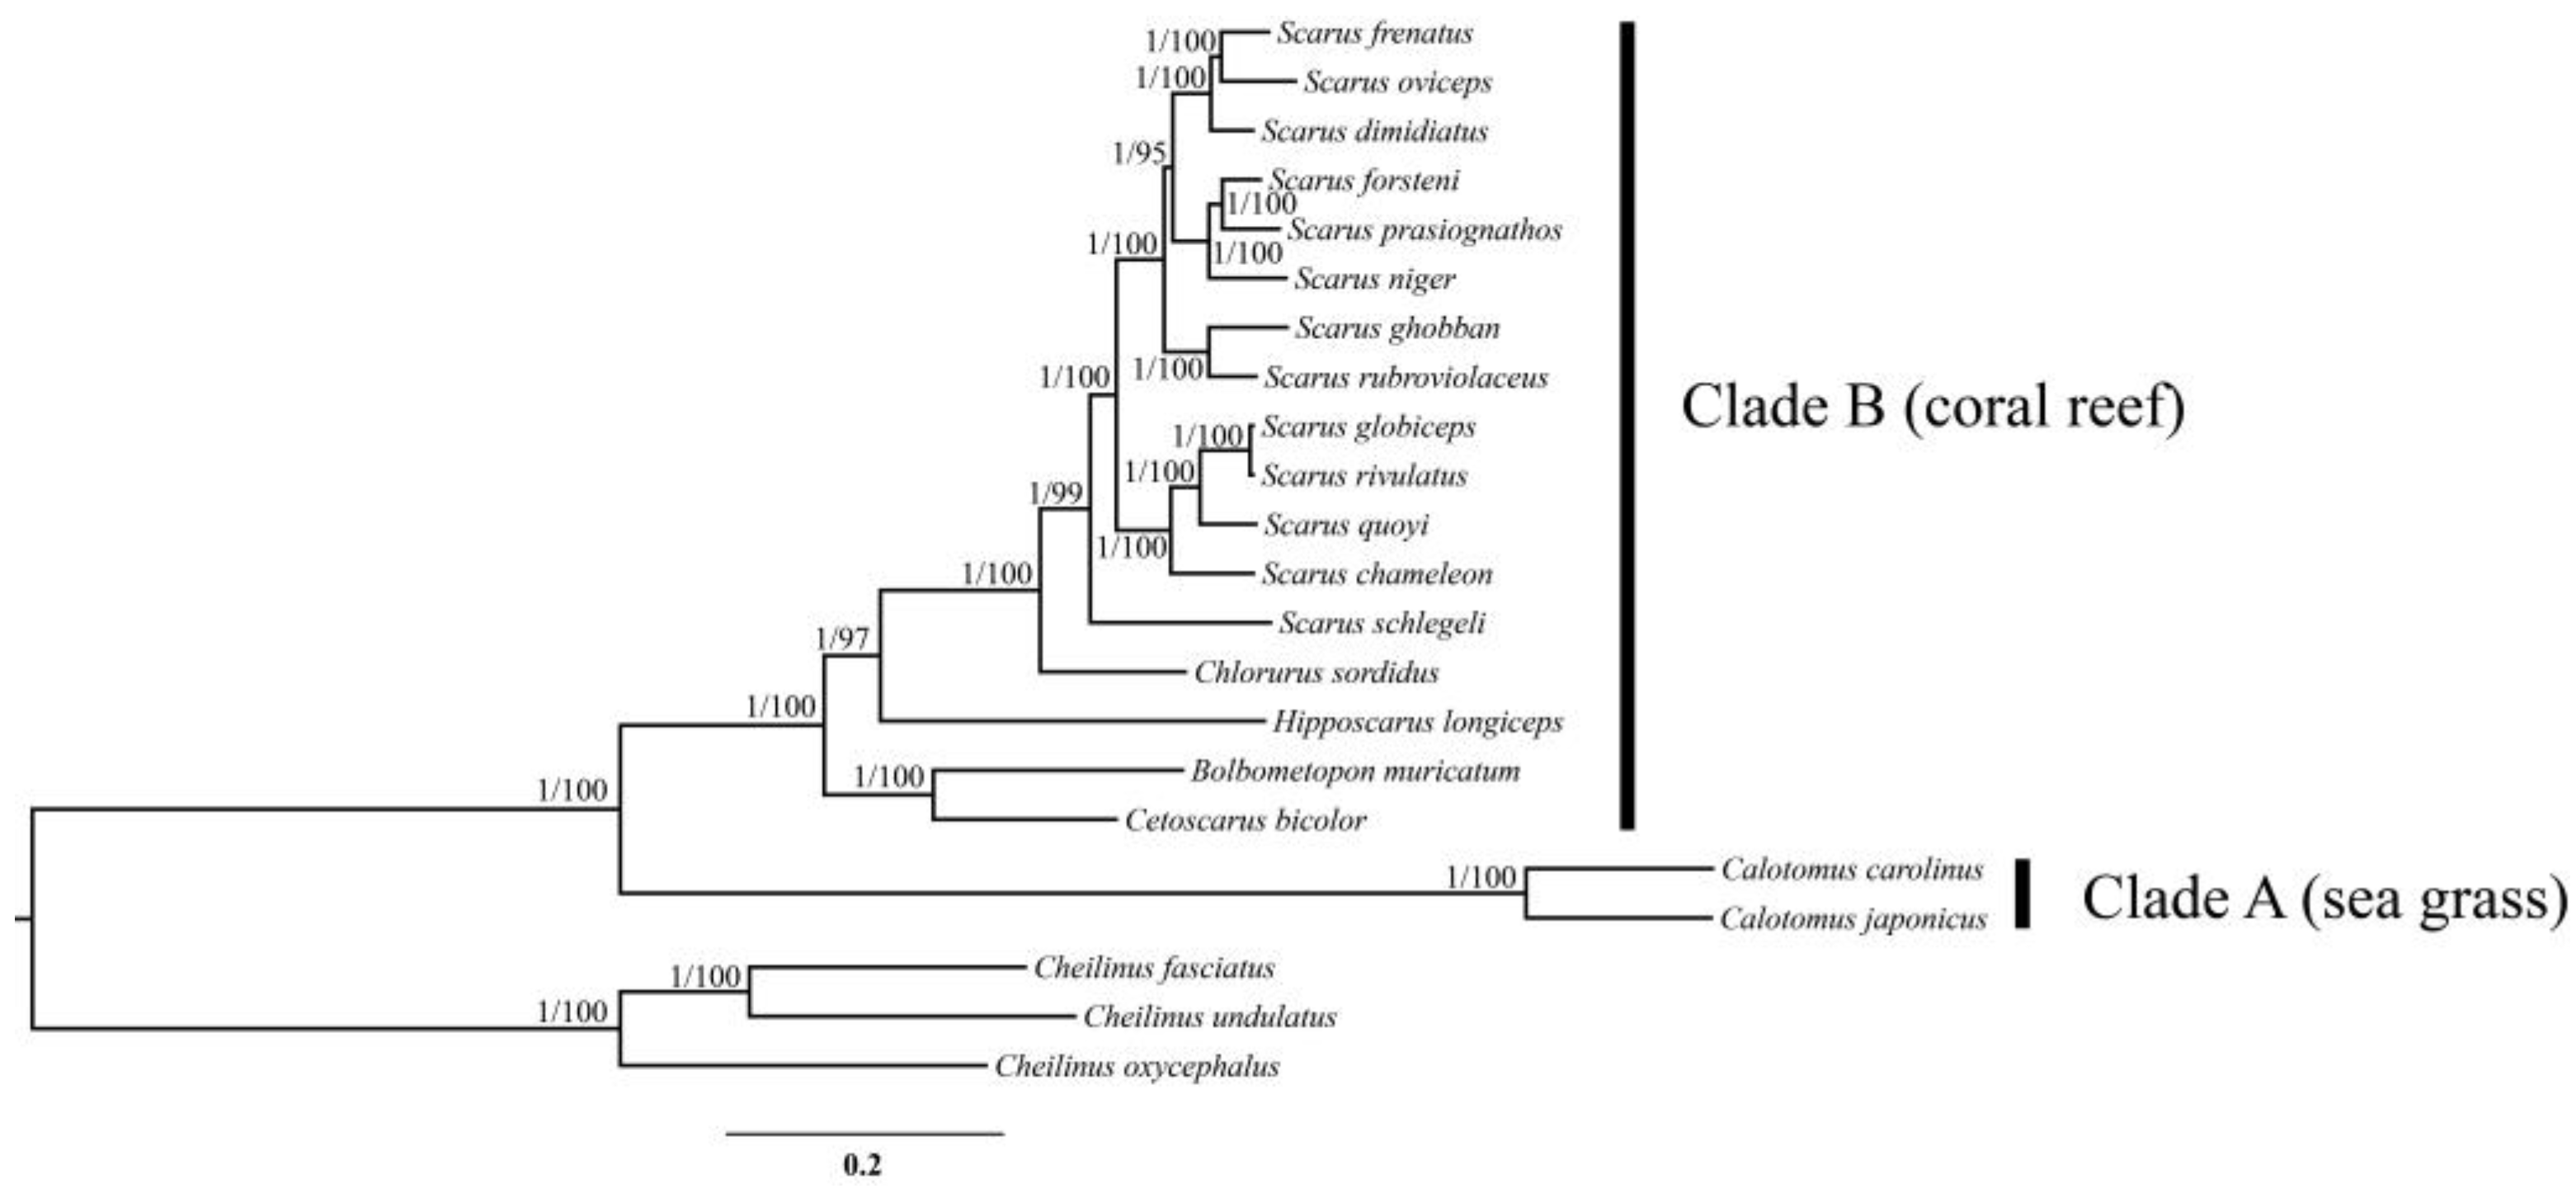
3.7. Phylogenetic Relationships of the Parrotfishes

The ML and BI trees based on the thirteen PCGs and two rRNAs yielded identical gene tree topologies (Figure 8), which congruently revealed two main clades. The first clade (clade A), located at the basal part of the tree, includes species of the genus Calotomus. The second clade (clade B) was comprised of the genera Cetoscarus, Bolbometopon, Hipposcarus, Chlorurus, and Scarus. The genus Cetoscarus was sister to Bolbometopon, positioned at the basal part of this clade. Scarus formed the sister genus to Chlorurus, then clustered with Hipposcarus. The monophyly of Scarus and Chlorurus was confirmed with strong support. Among the sampled Scarus species, S. globiceps showed a close relationship with S. rivulatus and exhibited little genetic difference (0.009 between the whole mitogenome). The nodes with high ML bootstrap support values and Bayesian posterior probabilities (BS > 70 and PP > 0.95) were shown.

3.8. Divergence Time Estimation

The estimated divergence time and 95% credible intervals (CIs) are shown in Figure 9. The split between clade A and clade B occurred at 26.9 Ma (95% CI 16.0~36.0 Ma) during the late Oligocene. The Bolbometopon-Cetoscarus clade differentiated at 15.9 Ma (95% CI 9.3~21.2 Ma) during the middle Miocene. Hipposcarus diverged at 14.3 Ma (95% CI 8.3~18.8 Ma). The split between Chlorurus and Scarus was dated back to 8.6 Ma (95% CI 5.2~11.6 Ma). The Scarus species diverged relatively recently, ranging from 0.2 Ma to 7.0 Ma.

4. Discussion

The comparative analysis revealed that the mitogenome structure, organization, codon usage, and putative secondary structures of tRNAs were highly similar among all the analyzed parrotfish species. The gene rearrangement of the tRNA gene cluster between ND1 and ND2 was detected, which is typical of parrotfish [27,28,29]. In parrotfish mitogenomes, the tRNAMet was located between the tRNAIle and tRNAGln, then a putative tRNAMet pseudogene was located after the tRNAGln. The gene rearrangements had been proposed to occur with tandem duplication of gene regions as a consequence of slipped-strand mispairing, followed by deletions of redundant genes [53]. The tRNAMet pseudogene was believed to function as punctuation marks for mitochondrial ND2 mRNA processing [27].
Previous studies on insects suggested that the intergenic spacers were important for transcription and might be associated with gene rearrangement [54,55,56]. Our results showed significant variance in IGS among the parrotfish mitogenomes, especially for the longest IGS, the control region. Despite the great length variations found in the CR of the parrotfish mitogenomes, three conserved sequence blocks could still be detected. Compared with most fish species [1], the CSB-III cannot be observed in the CR of the parrotfish mitogenomes. The lack of CSB-III was also reported in other vertebrates [57]. Up until now, the functions of the CSBs were still not clear, however, the common existence of CSB-D and CSB-I in vertebrate mitogenomes suggested that they were vital in the replication and transcription of the genome [1].
CR was commonly used as genetic markers in phylogenetic and population genetic analysis due to its high variability among populations and closely related species [58,59]. However, our analysis suggested that the CR of parrotfishes experienced significant substitution saturation. Substitution saturation reduces the amount of phylogenetic signals to the point that sequence similarities could probably be the consequence of chance alone rather than homology. Therefore, phylogenetic signals are lost, and the sequences are no longer informative about the underlaying evolutionary processes that generate them if substitution saturation is reached [60]. For example, the mitochondrial markers COI and ND3 that are commonly used in phylogenetic studies and DNA barcoding were proven to be subjected to significant substitution saturation in Caryophyllidean cestodes. Therefore, arbitrary application of these markers to the phylogenetic inference of this group of cestodes would jeopardize the well-supported phylogenetic estimates and evolutionary relationships [61]. In our case, the CR sequences have never been employed to infer the phylogenetic relationships among parrotfishes so far [30,31,32]. Future studies should avoid using the CR sequences when it comes to phylogenetic relationship inference or identification via DNA barcoding of the parrotfishes.
The RSCU revealed that degenerate codons were prone to use more A and T than G and C in the third codon position, therefore higher A + T content than G + C content was observed in the third codon position of parrotfish mitogenomes (Figure 2a and Figure 3b, Additional File 2: Figure S1). This phenomenon was frequently observed in other teleosts [1] and might be related to genome bias, optimal selection of tRNA, or DNA repair efficiency [62].
Compared with other parrotfish species, the Calotomus species displayed an unusual AT skew for the whole mitogenome with a slightly negative skewness, while other species all showed positive values. Nucleotide skewness might be related to the balance between mutational and selective pressures during replication [63,64,65]. Some previous studies had indicated that the preference for certain nucleotides might be associated with selection rather than mutation [66]. For example, Sinorhodeus microlepis, a bitterling species with highly specialized ecological and behavioral preferences [67], also exhibited an unusual AT skew in its mitogenome [68] and this unique AT skewness was believed to be associated with unique selective forces [68]. Compared with other parrotfish species, the Calotomus species possessed some unique ecological aspects, such as the browsing feeding behavior and the lack of breeding territories [30]. It is suspected that distinct selective pressures or processes might lead to the preference of T in their mitogenomes. However, what and how the selective processes account for the unusual AT skew in the Calotomus species needs further investigation.
All of the PCGs were evolved under the purifying selection (ω < 1). The lower ω value on the whole suggested a prevalent signature of strong functional restrictions across the mitogenome, which was largely in agreement with the functional importance of mitochondria as a respiration chain necessary for OXPHOS and electron transport [69]. Furthermore, the lower ω value indicated fewer variations in the amino acids; therefore, COI and Cyt b could serve as potential barcoding markers for the identification of parrotfish.
The phylogenetic relationships among the parrotfish genus based on thirteen PCGs and two rRNAs of the mitogenome indicated two distinct clades (A and B), which were identical with previous studies based on concatenated data of both mitochondrial and nuclear markers [30,31,32]. These two clades recovered by the phylogenetic analysis correspond to two distinct groups with different aspects of ecological adaptation, which had been defined as the sea grass clade and the coral reef clade [30]. The sea grass clade, as represented by Calotomus in this study, exhibited some less modified morphological characteristics (e.g., discrete teeth without cementation) [70] and showed some distinct ecological and behavioral aspects (e.g., browsing, no breeding territories, and no harem) [30]. These features differed greatly from the coral reef clades. In addition to the phylogenetic analysis, our results also revealed some unique features of the mitogenome composition and organization in the Calotomus mitogenomes (e.g., unusual AT skewness in the mitogenome and additional IGSs), indicating the evolutionary distinctiveness of the sea grass clade.
The first split of the parrotfish was estimated to have occurred in the late Oligocene (26.9 Ma, 95% CI 16.0~36.0 Ma), separating the sea grass clade from the coral reef clade. Geological evidence suggests that tectonic movements in the Indo-West Pacific region during the late Oligocene and early Miocene resulted in the formation of vast areas of shallow-water habitat between Australia and Indonesia [71], facilitating the expansion of sea grass habitat [72]. Our divergence time estimation was largely in congruence with the timing of the large-scale development of the sea grass habitat. This result probably indicated that the ecological differences between these two habitats acted as the major driving force in the early diversification of the parrotfishes. The differentiation within the coral reef clade had been initiated since the middle Miocene (about 15.9 Ma), which is well consistent with the closure of the Tethys Ocean [73]. Alterations in geomorphologies such as sea levels, sea surface temperatures, and ocean circulations exerted a great impact on coral reefs [74,75,76], likely functioning as the driving forces behind the rapid radiation of coral reef species. Previous studies indicated that the extensive diversification of coral reef taxa occurred during this period and was likely associated with the geomorphological reconfiguration of the marine realm [77]. In addition, natural and sexual selections might have also contributed to the diversification of parrotfishes. Some studies suggested that the protogynous mating system of parrotfishes might function as a possible driving force of speciation [30]. Though some research has suggested that ecological and selection may operate in tandem in the speciation processes [31], the function mechanisms and their relative roles still require further investigation.

5. Conclusions

In the present study, comparative analysis revealed both the conserved and unique characteristics of parrotfish mitogenomes. The mitogenome structure, organization, gene overlaps, putative secondary structures of tRNAs, and codon usage were relatively conserved among all the analyzed species. However, the base composition and the intergenic spacers varied largely among species. All of the PCGs were under purifying selection. Phylogenetic analysis revealed that the parrotfishes could be divided into two clades with distinct ecological adaptations. Early divergence of the sea grass and coral reef clades occurred in the late Oligocene, probably related to the expansion of sea grass habitat. Later diversification within the coral reef clade could be dated back to the Miocene, likely associated with the geomorphology alternation since the closing of the Tethys Ocean. This study offered fundamental molecular materials for further studies on the evolution and diversification of the parrotfishes and would contribute to their identification and conservation.

Supplementary Materials

The following supporting information can be downloaded at: https://www.mdpi.com/article/10.3390/biology12030410/s1, Table S1: General features of the parrotfish mitogenomes; Table S2: AT content of the parrotfish mitogenomes; Table S3: AT skew of the parrotfish mitogenomes; Figure S1: Relative synonymous codon usage (RSCU) of the 12 newly determined parrotfish species.

Author Contributions

Funding acquisition, T.W. and Y.L.; Methodology, J.G.; Resources, C.L., T.W., L.L., Y.X., P.W. and Y.L.; Software, J.G., C.L. and D.Y.; Supervision, T.W. and Y.L.; Visualization, J.G., D.Y., L.L., Y.X. and P.W.; Writing—original draft, J.G., C.L. and D.Y.; Writing—review and editing, T.W. and Y.L. All authors have read and agreed to the published version of the manuscript.

Funding

The study was funded by the Fundamental and Applied Fundamental Research Major Program of Guangdong Province (2019B030302004-05); Hainan Provincial Natural Science Foundation (322CXTD530); Hainan Provincial Natural Science Foundation (322MS153); Science and Technology Planning Project of Guangdong Province (2019B121201001); Central Public-interest Scientific Institution Basal Research Fund, CAFS (2020TD16); Financial Fund of the Ministry of Agriculture and Rural Affairs, P. R. of China (NFZX2021).

Institutional Review Board Statement

The animal study protocol was approved by the Institutional Animal Care and Use Committee of the Institute of Hydrobiology, Chinese Academic of Sciences (protocol code: 2022/LL/036; date of approval: 25 September 2022).

Informed Consent Statement

Not applicable.

Data Availability Statement

The data presented in this study are available in NCBI GenBank (Accession number: OQ349180-OQ349191).

Conflicts of Interest

The authors declare no conflict of interest.

References

  1. Satoh, T.P.; Miya, M.; Mabuchi, K.; Nishida, M. Structure and variation of the mitochondrial genome of fishes. BMC Genom. 2016, 17, 719. [Google Scholar] [CrossRef] [PubMed] [Green Version]
  2. Avise, J.C.; Arnold, J.; Ball, R.M.; Bermingham, E.; Lamb, T.; Neigel, J.E.; Reeb, C.A.; Saunders, N.C. Intraspecific Phylogeography: The Mitochondrial DNA Bridge between Population Genetics and Systematics. Annu. Rev. Ecol. Syst. 1987, 18, 489–522. [Google Scholar] [CrossRef]
  3. Avise, J.C. Phylogeography: The History and Formation of Species; Harvard University Press: Harvard, MA, USA, 2000. [Google Scholar]
  4. Avise, J.C. Phylogeography: Retrospect and prospect. J. Biogeogr. 2009, 36, 3–15. [Google Scholar] [CrossRef] [Green Version]
  5. Miya, M.; Takeshima, H.; Endo, H.; Ishiguro, N.B.; Inoue, J.G.; Mukai, T.; Satoh, T.P.; Yamaguchi, M.; Kawaguchi, A.; Mabuchi, K.; et al. Major patterns of higher teleostean phylogenies: A new perspective based on 100 complete mitochondrial DNA sequences. Mol. Phylogenetics Evol. 2003, 26, 121–138. [Google Scholar] [CrossRef] [PubMed]
  6. Inoue, J.G.; Miya, M.; Lam, K.; Tay, B.-H.; Danks, J.A.; Bell, J.; I Walker, T.I.; Venkatesh, B. Evolutionary Origin and Phylogeny of the Modern Holocephalans (Chondrichthyes: Chimaeriformes): A Mitogenomic Perspective. Mol. Biol. Evol. 2010, 27, 2576–2586. [Google Scholar] [CrossRef] [Green Version]
  7. Cole, T.L.; Ksepka, D.T.; Mitchell, K.J.; Tennyson, A.J.D.; Thomas, D.B.; Pan, H.; Zhang, G.; Rawlence, N.J.; Wood, J.R.; Bover, P.; et al. Mitogenomes Uncover Extinct Penguin Taxa and Reveal Island Formation as a Key Driver of Speciation. Mol. Biol. Evol. 2019, 36, 784–797. [Google Scholar] [CrossRef] [Green Version]
  8. Nie, R.-E.; Breeschoten, T.; Timmermans, M.J.T.N.; Nadein, K.; Xue, H.-J.; Bai, M.; Huang, Y.; Yang, X.-K.; Vogler, A.P. The phylogeny of Galerucinae (Coleoptera: Chrysomelidae) and the performance of mitochondrial genomes in phylogenetic inference compared to nuclear rRNA genes. Cladistics 2018, 34, 113–130. [Google Scholar] [CrossRef] [Green Version]
  9. Telford, M.J.; Herniou, E.A.; Russell, R.B.; Littlewood, D.T.J. Changes in mitochondrial genetic codes as phylogenetic characters: Two examples from the flatworms. Proc. Natl. Acad. Sci. USA 2000, 97, 11359–11364. [Google Scholar] [CrossRef] [Green Version]
  10. Shi, W.; Dong, X.-L.; Wang, Z.-M.; Miao, X.-G.; Wang, S.-Y.; Kong, X.-Y. Complete mitogenome sequences of four flatfishes (Pleuronectiformes) reveal a novel gene arrangement of L-strand coding genes. BMC Evol. Biol. 2013, 13, 173. [Google Scholar] [CrossRef] [Green Version]
  11. Zhang, D.; Zou, H.; Hua, C.-J.; Li, W.-X.; Mahboob, S.; Al-Ghanim, K.A.; Al-Misned, F.; Jakovlić, I.; Wang, G.-T. Mitochondrial Architecture Rearrangements Produce Asymmetrical Nonadaptive Mutational Pressures That Subvert the Phylogenetic Reconstruction in Isopoda. Genome Biol. Evol. 2019, 11, 1797–1812. [Google Scholar] [CrossRef] [Green Version]
  12. Sale, P.F. The Ecology of Fishes on Coral Reefs; Academic Press: San Diego, CA, USA, 1991. [Google Scholar]
  13. Parenti, P.; Randall, J.E. Checklist of the species of the families Labridae and Scaridae: An update. Smithiana Bull. 2011, 13, 29–44. [Google Scholar]
  14. Gobalet, K.W. Cranial Specializations of Parrotfishes, Genus Scarus (Scarinae, Labridae) for Scraping Reef Surfaces. In Biology of Parrotfishes; CRC Press: Boca Raton, FL, USA, 2018; pp. 1–25. [Google Scholar]
  15. Bellwood, D.R.; Choat, J.H. A functional analysis of grazing in parrotfishes (family Scaridae): The ecological im-plications. Environ. Biol. Fishes 1989, 28, 189–214. [Google Scholar] [CrossRef]
  16. Bellwood, D.R. Direct estimate of bioerosion by two parrotfish species, Chlorurus gibbus and C. sordidus, on the Great Barrier Reef, Australia. Mar. Biol. 1995, 121, 419–429. [Google Scholar] [CrossRef]
  17. Lewis, S.M.; Wainwright, P.C. Herbivore abundance and grazing intensity on a Caribbean coral reef. J. Exp. Mar. Biol. Ecol. 1985, 87, 215–228. [Google Scholar] [CrossRef]
  18. Bellwood, D.R.; Hoey, A.S.; Hughes, T.P. Human activity selectively impacts the ecosystem roles of parrotfishes on coral reefs. Proc. R. Soc. B Boil. Sci. 2012, 279, 1621–1629. [Google Scholar] [CrossRef] [Green Version]
  19. Thurber, R.V.; Burkepile, D.E.; Correa, A.M.S.; Thurber, A.R.; Shantz, A.A.; Welsh, R.; Pritchard, C.; Rosales, S. Macroalgae Decrease Growth and Alter Microbial Community Structure of the Reef-Building Coral, Porites astreoides. PLoS ONE 2012, 7, e44246. [Google Scholar] [CrossRef] [Green Version]
  20. Roos, N.C.; Pennino, M.G.; Lopes, P.F.D.M.; Carvalho, A.R. Multiple management strategies to control selectivity on parrotfishes harvesting. Ocean Coast. Manag. 2016, 134, 20–29. [Google Scholar] [CrossRef]
  21. Adam, T.; Burkepile, D.; Ruttenberg, B.; Paddack, M. Herbivory and the resilience of Caribbean coral reefs: Knowledge gaps and implications for management. Mar. Ecol. Prog. Ser. 2015, 520, 1–20. [Google Scholar] [CrossRef] [Green Version]
  22. Quan, Q.; Liu, Y.; Wang, T.; Li, C. Geographic Variation in the Species Composition of Parrotfish (Labridae: Scarini) in the South China Sea. Sustainability 2022, 14, 11524. [Google Scholar] [CrossRef]
  23. Morgan, K.M.; Kench, P.S. Parrotfish erosion underpins reef growth, sand talus development and island building in the Maldives. Sediment. Geol. 2016, 341, 50–57. [Google Scholar] [CrossRef]
  24. Eggertsen, L.; Goodell, W.; Cordeiro, C.A.M.M.; Mendes, T.C.; Longo, G.O.; Ferreira, C.E.L.; Berkström, C. Seascape Configuration Leads to Spatially Uneven Delivery of Parrotfish Herbivory across a Western Indian Ocean Seascape. Diversity 2020, 12, 434. [Google Scholar] [CrossRef]
  25. Knaus, B.J.; Cronn, R.; Liston, A.; Pilgrim, K.; Schwartz, M.K. Mitochondrial genome sequences illuminate maternal lineages of conservation concern in a rare carnivore. BMC Ecol. 2011, 11, 10. [Google Scholar] [CrossRef] [PubMed] [Green Version]
  26. Johri, S.; Fellows, S.R.; Solanki, J.; Busch, A.; Livingston, I.; Mora, M.F.; Tiwari, A.; Cantu, V.A.; Goodman, A.; Morris, M.; et al. Mitochondrial genome to aid species delimitation and effective conservation of the Sharpnose Guitarfish (Glaucostegus granulatus). Meta Gene 2020, 24, 100648. [Google Scholar] [CrossRef]
  27. Mabuchi, K.; Miya, M.; Satoh, T.P.; Westneat, M.W.; Nishida, M. Gene Rearrangements and Evolution of tRNA Pseudogenes in the Mitochondrial Genome of the Parrotfish (Teleostei: Perciformes: Scaridae). J. Mol. Evol. 2004, 59, 287–297. [Google Scholar] [CrossRef]
  28. Mabuchi, K. Complete mitochondrial genome of the parrotfish Calotomus japonicus (Osteichthyes: Scaridae) with implications based on the phylogenetic position. Mitochondrial DNA Part B 2016, 1, 643–645. [Google Scholar] [CrossRef] [Green Version]
  29. Chiang, W.-C.; Chang, C.-H.; Hsu, H.-H.; Jang-Liaw, N.-H. Complete mitochondrial genome sequence for the green humphead parrotfish Bolbometopon muricatum. Conserv. Genet. Resour. 2017, 9, 393–396. [Google Scholar] [CrossRef]
  30. Streelman, J.T.; Alfaro, M.; Westneat, M.W.; Bellwood, D.R.; Karl, S.A. Evolutionary History of the Parrotfishes: Biogeography, Ecomorphology, and Comparative Diversity. Evolution 2002, 56, 961–971. [Google Scholar] [CrossRef]
  31. Smith, L.L.; Fessler, J.L.; Alfaro, M.E.; Streelman, J.T.; Westneat, M.W. Phylogenetic relationships and the evolution of regulatory gene sequences in the parrotfishes. Mol. Phylogenetics Evol. 2008, 49, 136–152. [Google Scholar] [CrossRef] [Green Version]
  32. Choat, J.H.; Klanten, O.S.; Van Herwerden, L.; Robertson, D.R.; Clements, K.D. Patterns and processes in the evolutionary history of parrotfishes (Family Labridae). Biol. J. Linn. Soc. 2012, 107, 529–557. [Google Scholar] [CrossRef] [Green Version]
  33. Bolger, A.M.; Lohse, M.; Usadel, B. Trimmomatic: A flexible trimmer for Illumina sequence data. Bioinformatics 2014, 30, 2114–2120. [Google Scholar] [CrossRef] [Green Version]
  34. Jin, J.-J.; Yu, W.-B.; Yang, J.-B.; Song, Y.; Depamphilis, C.W.; Yi, T.-S.; Li, D.-Z. GetOrganelle: A fast and versatile toolkit for accurate de novo assembly of organelle genomes. Genome Biol. 2020, 21, 241. [Google Scholar] [CrossRef]
  35. Bernt, M.; Donath, A.; Jühling, F.; Externbrink, F.; Florentz, C.; Fritzsch, G.; Pütz, J.; Middendorf, M.; Stadler, P.F. MITOS: Improved de novo metazoan mitochondrial genome annotation. Mol. Phylogenetics Evol. 2013, 69, 313–319. [Google Scholar] [CrossRef]
  36. Iwasaki, W.; Fukunaga, T.; Isagozawa, R.; Yamada, K.; Maeda, Y.; Satoh, T.P.; Sado, T.; Mabuchi, K.; Takeshima, H.; Miya, M.; et al. MitoFish and MitoAnnotator: A Mitochondrial Genome Database of Fish with an Accurate and Automatic Annotation Pipeline. Mol. Biol. Evol. 2013, 30, 2531–2540. [Google Scholar] [CrossRef] [Green Version]
  37. Kumar, S.; Stecher, G.; Tamura, K. MEGA7: Molecular Evolutionary Genetics Analysis Version 7.0 for Bigger Datasets. Mol. Biol. Evol. 2016, 33, 1870–1874. [Google Scholar] [CrossRef] [Green Version]
  38. Xia, X. DAMBE7: New and Improved Tools for Data Analysis in Molecular Biology and Evolution. Mol. Biol. Evol. 2018, 35, 1550–1552. [Google Scholar] [CrossRef] [Green Version]
  39. Xia, X.; Xie, Z.; Salemi, M.; Chen, L.; Wang, Y. An index of substitution saturation and its application. Mol. Phylogenetics Evol. 2003, 26, 1–7. [Google Scholar] [CrossRef]
  40. Katoh, K.; Standley, D.M. MAFFT Multiple Sequence Alignment Software Version 7: Improvements in Performance and Usability. Mol. Biol. Evol. 2013, 30, 772–780. [Google Scholar] [CrossRef] [Green Version]
  41. Zhang, D.; Gao, F.; Jakovlić, I.; Zhou, H.; Zhang, J.; Li, W.X.; Wang, G.T. PhyloSuite: An integrated and scalable desktop platform for streamlined molecular sequence data management and evolutionary phylogenetics studies. Mol. Ecol. Resour. 2020, 20, 348–355. [Google Scholar] [CrossRef]
  42. Gouy, M.; Guindon, S.; Gascuel, O. SeaView Version 4: A Multiplatform Graphical User Interface for Sequence Alignment and Phylogenetic Tree Building. Mol. Biol. Evol. 2010, 27, 221–224. [Google Scholar] [CrossRef] [Green Version]
  43. Kalyaanamoorthy, S.; Minh, B.Q.; Wong, T.K.F.; Von Haeseler, A.; Jermiin, L.S. ModelFinder: Fast model selection for accurate phylogenetic estimates. Nat. Methods 2017, 14, 587–589. [Google Scholar] [CrossRef] [Green Version]
  44. Ronquist, F.; Teslenko, M.; van der Mark, P.; Ayres, D.L.; Darling, A.; Höhna, S.; Larget, B.; Liu, L.; Suchard, M.A.; Huelsenbeck, J.P. MrBayes 3.2: Efficient Bayesian Phylogenetic Inference and Model Choice across a Large Model Space. Syst. Biol. 2012, 61, 539–542. [Google Scholar] [CrossRef] [PubMed] [Green Version]
  45. Nguyen, L.-T.; Schmidt, H.A.; Von Haeseler, A.; Minh, B.Q. IQ-TREE: A Fast and Effective Stochastic Algorithm for Estimating Maximum-Likelihood Phylogenies. Mol. Biol. Evol. 2015, 32, 268–274. [Google Scholar] [CrossRef] [PubMed]
  46. Rozas, J.; Ferrer-Mata, A.; Sánchez-DelBarrio, J.C.; Guirao-Rico, S.; Librado, P.; Ramos-Onsins, S.E.; Sánchez-Gracia, A. DnaSP 6: DNA Sequence Polymorphism Analysis of Large Data Sets. Mol. Biol. Evol. 2017, 34, 3299–3302. [Google Scholar] [CrossRef] [PubMed]
  47. Yang, Z. PAML 4: Phylogenetic Analysis by Maximum Likelihood. Mol. Biol. Evol. 2007, 24, 1586–1591. [Google Scholar] [CrossRef] [Green Version]
  48. Rambaut, A.; Suchard, M.A.; Xie, D.; Drummond, A.J. Tracer v1.7. 2014. Available online: http://beast.bio.ed.ac.uk/Tracer (accessed on 30 October 2022).
  49. Bellwood, D.R.; Schultz, O. A Review of the Fossil Record of the Parrotfishes (Labroidei: Scaridae) with a Description of a New Calotomus Species from the Middle Miocene (Badenian) of Austria. Ann. Nat. Mus. Wien 1990, 92, 55–71. [Google Scholar]
  50. Bellwood, D.R. A new fossil fish Phyllopharyngodon longipinnis gen. et sp. nov. (family labridae) from the Eocene, Monte Bolca, Italy. Studi Ric. Sui Giacimenti Terziari Bolca 1990, 6, 149–160. [Google Scholar]
  51. Boore, J.L. Animal mitochondrial genomes. Nucleic Acids Res. 1999, 27, 1767–1780. [Google Scholar] [CrossRef] [Green Version]
  52. Ojala, D.; Montoya, J.; Attardi, G. tRNA punctuation model of RNA processing in human mitochondria. Nature 1981, 290, 470–474. [Google Scholar] [CrossRef]
  53. Levinson, G.; Gutman, G.A. Slipped-strand mispairing: A major mechanism for DNA sequence evolution. Mol. Biol. Evol. 1987, 4, 203–221. [Google Scholar] [CrossRef] [Green Version]
  54. Taanman, J.-W. The mitochondrial genome: Structure, transcription, translation and replication. Biochim. Et Biophys. Acta BBA-Bioenergies 1999, 1410, 103–123. [Google Scholar] [CrossRef] [Green Version]
  55. Mao, M.; Valerio, A.; Austin, A.D.; Dowton, M.; Johnson, N.F. The first mitochondrial genome for the wasp superfamily Platygastroidea: The egg parasitoid Trissolcus basalis. Genome 2012, 55, 194–204. [Google Scholar] [CrossRef] [Green Version]
  56. Rodovalho, C.D.M.; Lyra, M.L.; Ferro, M.; Bacci, M., Jr. The Mitochondrial Genome of the Leaf-Cutter Ant Atta laevigata: A Mitogenome with a Large Number of Intergenic Spacers. PLoS ONE 2014, 9, e97117. [Google Scholar] [CrossRef] [Green Version]
  57. Sbisà, E.; Tanzariello, F.; Reyes, A.; Pesole, G.; Saccone, C. Mammalian mitochondrial D-loop region structural analysis: Identification of new conserved sequences and their functional and evolutionary implications. Gene 1997, 205, 125–140. [Google Scholar] [CrossRef]
  58. Chen, I.-S.; Wu, J.-H.; Huang, S.-P. The taxonomy and phylogeny of the cyprinid genus Opsariichthys Bleeker (Teleostei: Cyprinidae) from Taiwan, with description of a new species. Environ. Biol. Fishes 2009, 86, 165–183. [Google Scholar] [CrossRef]
  59. Kang, B.; Hsu, K.; Wu, J.; Chiu, Y.; Lin, H.; Ju, Y. Population genetic diversity and structure of Rhinogobius candidianus (Gobiidae) in Taiwan: Translocation and release. Ecol. Evol. 2022, 12, e9154. [Google Scholar] [CrossRef]
  60. Salemi, M. Nucleotide substitution models. Practice: The Phylip and Tree-Puzzle software packages. In The Phylogenetic Handbook a Practical Approach to Phylogenetic Analysis and Hypothesis Testing; Salemi, M., Vandamme, A.-M., Eds.; Cambridge University Press: Cambridge, UK, 2003; pp. 88–97. [Google Scholar]
  61. Brabec, J.; Scholz, T.; Králová-Hromadová, I.; Bazsalovicsová, E.; Olson, P.D. Substitution saturation and nuclear paralogs of commonly employed phylogenetic markers in the Caryophyllidea, an unusual group of non-segmented tapeworms (Platyhelminthes). Int. J. Parasitol. 2012, 42, 259–267. [Google Scholar] [CrossRef]
  62. Lv, W.; Jiang, H.; Bo, J.; Wang, C.; Yang, L.; He, S. Comparative mitochondrial genome analysis of Neodontobutis hainanensis and Perccottus glenii reveals conserved genome organization and phylogeny. Genomics 2020, 112, 3862–3870. [Google Scholar] [CrossRef]
  63. Francino, M.P.; Ochman, H. Strand asymmetries in DNA evolution. Trends Genet. 1997, 13, 240–245. [Google Scholar] [CrossRef]
  64. Frank, A.; Lobry, J. Asymmetric substitution patterns: A review of possible underlying mutational or selective mechanisms. Gene 1999, 238, 65–77. [Google Scholar] [CrossRef]
  65. Nikolaou, C. A study on the correlation of nucleotide skews and the positioning of the origin of replication: Different modes of replication in bacterial species. Nucleic Acids Res. 2005, 33, 6816–6822. [Google Scholar] [CrossRef] [Green Version]
  66. Charneski, C.A.; Honti, F.; Bryant, J.M.; Hurst, L.D.; Feil, E.J. Atypical AT Skew in Firmicute Genomes Results from Selection and Not from Mutation. PLOS Genet. 2011, 7, e1002283. [Google Scholar] [CrossRef] [PubMed] [Green Version]
  67. Li, F.; Liao, T.-Y.; Arai, R.; Zhao, L. Sinorhodeus microlepis, a new genus and species of bitterling from China (Teleostei: Cyprinidae: Acheilognathinae). Zootaxa 2017, 4353, 69. [Google Scholar] [CrossRef] [PubMed] [Green Version]
  68. Yu, P.; Zhou, L.; Zhou, X.-Y.; Yang, W.-T.; Zhang, J.; Zhang, X.-J.; Wang, Y.; Gui, J.-F. Unusual AT-skew of Sinorhodeus microlepis mitogenome provides new insights into mitogenome features and phylogenetic implications of bitterling fishes. Int. J. Biol. Macromol. 2019, 129, 339–350. [Google Scholar] [CrossRef] [PubMed]
  69. Meiklejohn, C.D.; Montooth, K.L.; Rand, D.M. Positive and negative selection on the mitochondrial genome. Trends Genet. 2007, 23, 259–263. [Google Scholar] [CrossRef] [PubMed]
  70. Bellwood, D.R. A phylogenetic study of the parrotfish family Scaridae (Pisces: Labroidea), with a revision of genera. Rec. Aust. Museum, Suppl. 1994, 20, 1–86. [Google Scholar] [CrossRef]
  71. Wilson, M.E.J.; Rosen, B.R. Implications of paucity of corals in the Paleogene of SE Asia: Plate tectonics or Centre of Origin? In Biogeography and Geological Evolution of SE Asia; Backhuys Publishers: Laiden, The Netherlands, 1998; pp. 165–195. [Google Scholar]
  72. Braisier, M.D. An outline of sea grass communities. Paleontology 1975, 18, 681–702. [Google Scholar]
  73. Sun, J.; Sheykh, M.; Ahmadi, N.; Cao, M.; Zhang, Z.; Tian, S.; Sha, J.; Jian, Z.; Windley, B.F.; Talebian, M. Permanent closure of the Tethyan Seaway in the northwestern Iranian Plateau driven by cyclic sea-level fluctuations in the late Middle Miocene. Palaeogeogr. Palaeoclim. Palaeoecol. 2021, 564, 110172. [Google Scholar] [CrossRef]
  74. Pomar, L.; Hallock, P. Changes in coral-reef structure through the Miocene in the Mediterranean province: Adaptive versus environmental influence. Geology 2007, 35, 899. [Google Scholar] [CrossRef]
  75. Coletti, G.; Balmer, E.M.; Bialik, O.M.; Cannings, T.; Kroon, D.; Robertson, A.H.; Basso, D. Microfacies evidence for the evolution of Miocene coral-reef environments in Cyprus. Palaeogeogr. Palaeoclim. Palaeoecol. 2021, 584, 110670. [Google Scholar] [CrossRef]
  76. Riera, R.; Bourget, J.; Håkansson, E.; Paumard, V.; Wilson, M.E. Middle Miocene tropical oligotrophic lagoon deposit sheds light on the origin of the Western Australian coral reef province. Palaeogeogr. Palaeoclim. Palaeoecol. 2021, 576, 110501. [Google Scholar] [CrossRef]
  77. Bellwood, D.R.; Goatley, C.H.R.; Bellwood, O. The evolution of fishes and corals on reefs: Form, function and interdependence. Biol. Rev. 2017, 92, 878–901. [Google Scholar] [CrossRef]
Figure 1. Organization of the parrotfish mitogenome. Calotomus carolinus was taken as an example. The inner ring indicated GC content.
Biology 12 00410 g001
Figure 2. Base composition of various datasets among parrotfish mitogenomes, with hierarchical clustering of parrotfish species (y-axis) based on (a) AT content and (b) AT skew.
Biology 12 00410 g002
Figure 3. (a) Amino acid frequency in the parrotfish mitogenomes. (b) Heatmap based on the relative synonymous codon usage (RSCU) in the parrotfish mitogenomes.
Biology 12 00410 g003
Figure 4. (a) Putative secondary structure of tRNAs in parrotfish mitogenomes. (b) Putative secondary structure of tRNASer(AGN) in Bolbometopon muricatum and Calotomus japonicus.
Biology 12 00410 g004
Figure 5. Putative secondary structure of the origin of L strand replication (OL) in five parrotfish species.
Biology 12 00410 g005
Figure 6. Conserved sequence blocks (CSBs) of the control region in the parrotfish mitogenomes.
Biology 12 00410 g006
Figure 7. Non-synonymous/synonymous substitution ratios (ω) of the 13 PCGs in the parrotfish mitogenomes.
Biology 12 00410 g007
Figure 8. Phylogenetic relationships of the parrotfishes based on 13 PCGs and 2 rRNAs using Bayesian inference (BI) and maximum likelihood (ML). Numbers at nodes indicate Bayesian posterior probabilities (PP) and ultrafast bootstrap supports (UFBoot) from maximum likelihood analysis, respectively. Only well-supported numbers (PP > 0.95, UFBoot > 95) are shown.
Biology 12 00410 g008
Figure 9. Divergence time estimation of the parrotfishes derived from MCMCTree analysis. Numbers at nodes indicate estimated age. Blue bars represent 95% credible age intervals for each node.
Biology 12 00410 g009
Table 1. Features of the mitochondrial genome of the parrotfishes. Calotomus carolinus was taken as an example.
FeaturesStartStopLength/bpIntergenic
Nucleotide
Start
Codon
Stop
Codon
Anti-CodonStrand
tRNAPhe169690 GAA+ *
12S-rRNA7010209510 +
tRNAVal10211093730 TAC+
16S-rRNA1094278216890 +
tRNALeu(UAA)27832855730 TAA+
ND1285638309757ATGTAA +
tRNAIle383839077010 GAT+
tRNAMet39183986696 TTG+
tRNAGln399340637168 CAT
ND24132517610450ATGTAG +
tRNATrp51775247714 TCA+
tRNAAla52525322715 TGC
tRNAAsn532854007341 GTT
tRNACys54425507669 GCA
tRNATyr55175586701 GTA
COI5588713815510GTGTAA +
tRNASer (UGA)71397209713 TGA
tRNAAsp72137283714 GTC+
COII728879786910ATGT +
tRNALys79798052741 TTT+
ATPase 880548221168−16ATGTAG +
ATPase 6820688946890CTGTA +
COIII889596797850ATGTAA +
tRNAGly96809750711 TCC+
ND39752101033520ATATAG +
tRNAArg10,10410,172690 TCG+
ND4L10,17310,469297−7ATGTAA +
ND410,46311,84313810ATGT +
tRNAHis11,84411,912692 GTG+
tRNASer (GCU)11,91511,9806632 GCT+
tRNALeu (UAG)12,01312,084724 TAG+
ND512,08913,9301842−4ATGTAA +
ND613,92714,4485221ATGTAA
tRNAGlu14,45014,5227364 TTC
Cyt b14,58715,72711410ATGT +
tRNAThr15,72815,799720 TGT+
tRNAPro15,80015,872730 TGG
D-loop15,87317,1141242 +
* +/− indicated H strand and L strand, respectively; a negative value indicated overlapping nucleotides.
Table 2. Base composition of the CSBs of parrotfish mitogenomes.
Base Composition (%)CSB-DCSB-ICSB-II
A10.534.28.8
T44.432.220.1
G21.619.65.2
C23.514.065.9
Disclaimer/Publisher’s Note: The statements, opinions and data contained in all publications are solely those of the individual author(s) and contributor(s) and not of MDPI and/or the editor(s). MDPI and/or the editor(s) disclaim responsibility for any injury to people or property resulting from any ideas, methods, instructions or products referred to in the content.

