Article

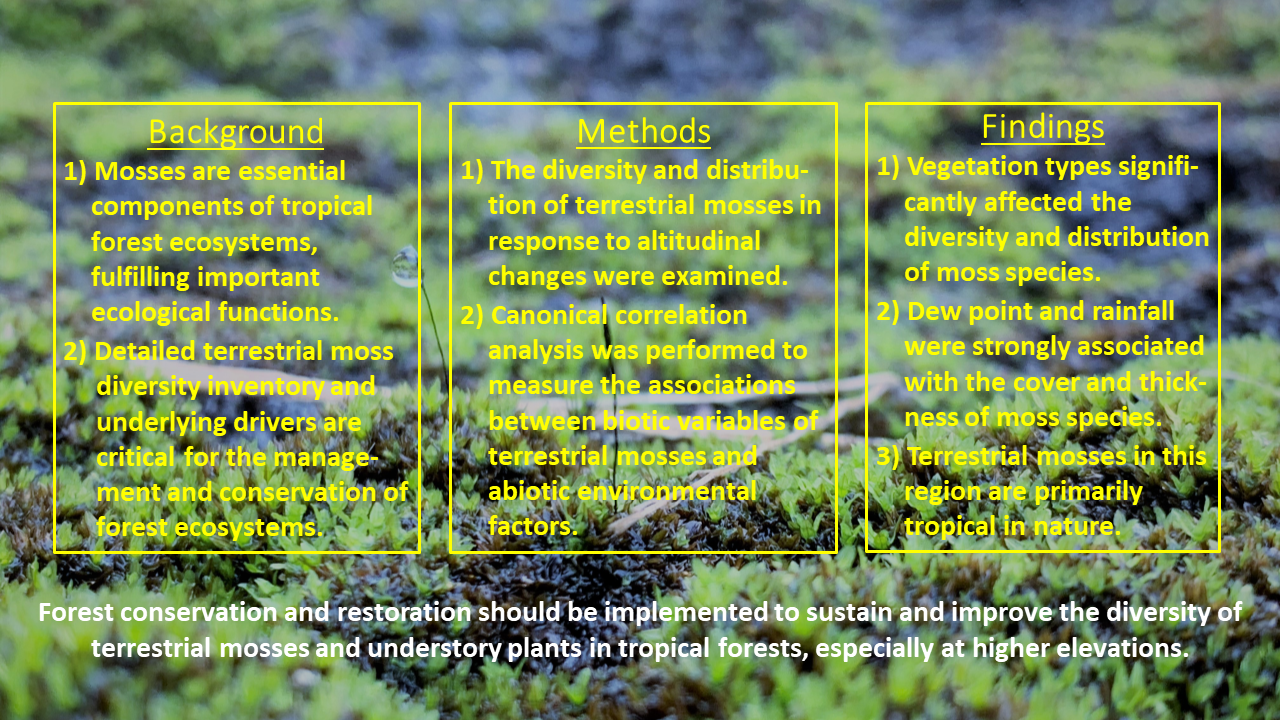
Vegetation Types Attributed to Deforestation and Secondary Succession Drive the Elevational Changes in Diversity and Distribution of Terrestrial Mosses in a Tropical Mountain Forest in Southern China

School of Life Sciences, The Chinese University of Hong Kong, Shatin, NT, Hong Kong, China
*
Author to whom correspondence should be addressed.
Forests 2021, 12(8), 961; https://doi.org/10.3390/f12080961
Submission received: 20 April 2021 / Revised: 30 June 2021 / Accepted: 15 July 2021 / Published: 21 July 2021
(This article belongs to the Section Forest Ecology and Management)

Abstract

:
(1) Background: Detailed diversity information regarding terrestrial mosses in a tropical forest ecosystem and an understanding of the drivers behind moss distribution provide crucial data for the management and conservation of forest ecosystems. Mosses are critical components of tropical forest ecosystems due to their high diversity and biomass, and they also fulfill essential ecological functions. Here, we report the first study into the relative importance of vegetation types and elevational gradient for the diversity, distribution and community structure of terrestrial moss species in southern China. (2) Methods: Five elevations spaced 200 m apart in the tropical mountain forest on the northern aspect of Tai Mo Shan were selected. The diversity, distribution, and geographical patterns of terrestrial mosses in response to altitudinal changes were examined. Differences in the biotic variables of terrestrial mosses between elevations were tested using a one-way ANOVA. Curve estimation regression models were used to describe the responses of the biotic variables to the elevation gradient. Canonical correlation analysis (CCA) was performed to identify and measure the associations among biotic variables of terrestrial mosses and abiotic environmental factors. (3) Results: Fifty-three terrestrial moss species belonging to 20 families and 31 genera were recorded along the altitudinal gradient on Tai Mo Shan. Microclimate factors including dew point and rainfall were strongly associated with the cover and thickness of the ground moss species. There were no obvious richness changes of terrestrial mosses along the elevation gradient. In total, 33 of the 51 species were tropically distributed, 14 species were found across East Asia and the tropical regions, 10 species had an East Asian pattern and 8 were temperate species. (4) Conclusions: Vegetation types significantly affect the diversity and distribution of terrestrial moss species. Although they are influenced by the East Asian and temperate climate with frequent human activities, terrestrial mosses on Tai Mo Shan are primarily tropical in nature. Forest conservation and restoration should be implemented to sustain and improve the diversity of terrestrial mosses and understory plants on Tai Mo Shan, especially at higher elevations.

Graphical Abstract

1. Introduction

Bryophytes encompass more than 20,000 species recorded worldwide, of which more than 12,000 are mosses [1]. Tropical forest ecosystems harbor the highest biodiversity of all terrestrial habitats [2,3,4]. More than 40% of bryophytes occur in tropical habitats [5], which are hotspots and well-suited to the exploration of the potential influences of global climate change on moss diversity [6] from unexpectedly high rates of habitat degradation and biodiversity loss [7]. Mosses are critical components of tropical forest ecosystems due to their high diversity and biomass [8,9,10,11]. They also play critical roles in serving as pioneer plants in soil development [12,13,14], nutrient cycling [15,16], the regulation of hydrology [17,18], vegetation restoration and succession [19,20]. However, compared with their non-vascular epiphyte counterparts, terrestrial mosses appear to be neglected in ecological studies, especially in terms of the relationship between biotic and abiotic variables [21,22]. Under the threat of habitat fragmentation and drastic global warming [23], the detailed diversity mapping of terrestrial mosses in montane forest and an understanding of the underlining drivers will provide crucial data for the management and conservation of forest ecosystems [24].
Environmental variables, specifically rainfall, relative humidity and temperature, vary along elevation gradient, resulting in the distribution of different ecosystems [25], which might exert a strong impact on the biotic communities of terrestrial mosses. Forest characteristics such as ground cover and canopy closure are two factors that affect terrestrial moss diversity [26,27]. Deforestation and vegetation development are other factors influencing moss species diversity patterns [28]. Terrestrial moss species are intimately dependent on the external environment due to their morphological and physiological specificities and have a wide geographic distribution because of the interactions of their dispersal history, climatic and environmental fluctuations and habitat availability. These make them the best candidates for depicting elevational zonation studies of forest ecosystems, as they are found from sea level to mountain peaks (with an elevational diversity gradient) [8,29,30,31,32,33].
Perspectives on factors influencing the diversity and distribution of terrestrial mosses in mountain forest ecosystem are still controversial. Although non-vascular epiphyte richness and distribution have been explored in many regions, ecological studies of terrestrial mosses in mountain forest ranges in tropical Asia are generally lacking. The cover and thickness of terrestrial mosses are two important parameters of the growth condition of moss species and are indicative of their responses to climate change. In addition, the distribution patterns of moss species can provide baseline information, which may reflect the physiological adaptation to their current habitats and possibly imply the potential response to predicted climate change. The vegetation types have changed greatly from 100 m to 900 m asl on Tai Mo Shan due to deforestation and subsequent secondary succession (Table 1), presenting us with different habitats. The objectives of this study were (1) to investigate the terrestrial moss community characteristics (composition, cover and thickness) and their distribution pattern on Tai Mo Shan in Hong Kong; (2) to analyze the phytogeographical characteristics; and (3) to assess if vegetation types are the major factor influencing moss diversity and distribution, and to provide implications for the conservation of terrestrial mosses.

2. Materials and Methods

2.1. Study Area

Hong Kong is in the eastern Pearl River Delta of the South China Sea, 22°9′–22°33′ N, 113°50′–114°26′ E, with a territory of 1104 km2. It lies 130 km south of the Tropic of Cancer and features a humid subtropical climate with distinct hot humid and cool dry seasons. Despite its small area, there are distinct horizontal and vertical climatic gradients in Hong Kong. The primary evergreen or semi-evergreen monsoon forests that used to cover Hong Kong were cleared 400 years ago, except for some small, undisturbed patches in elevated, remote and steep regions [34,35].
Hong Kong is one of the most densely populated places in the world, with less than 25% of the total land area being urbanized. A generally hilly to mountainous terrain with steep slopes occupies approximately 75% of the total land area. Undeveloped land is found in very few plane areas and consists mostly of secondary forests, grassland, shrubland or farmland [36,37,38,39]. About 40% of the undeveloped land area is designated as country parks and nature reserves [40]. Despite the small total extent of Hong Kong and the massive amount of human disturbance, diverse flora and fauna still survive [37,41]. A diverse ecosystem exists in this region, with more than 3000 species of vascular plants, of which 300 are endemic to Hong Kong [42,43]. The known bryophyte flora of Hong Kong consists of 372 species from 70 families and 159 genera, of which 238 are mosses and 134 are liverworts and hornworts [44].
Tai Mo Shan is the highest peak in Hong Kong, with an elevation of 957 m. It has an area of 1440 hectares and is situated in the Tai Mo Shan Country Park in the center of the New Territories, Hong Kong. Due to the height of the mountain, Tai Mo Shan is claimed to be Hong Kong’s most misty area, as it is often covered in clouds. It is not uncommon for temperatures to drop below the freezing point during the winter [45]. The vegetation types in our study sites along the elevation gradient change greatly from lowland to the peak. Dense broad-leaved lowland woodlands are mainly distributed in hilly areas below 400 m, with the dominant species Glochidion hongkongense and Syzgium levinei at 100 m and 300 m, respectively. Dense broad-leaved low-hill forests are mostly located on uplands between 400 m–550 m. The species Cinnamomum porrectum is dominant at 500 m elevation. Grasslands are widely found at upper slopes above 550 m to the peak. At 700 m, small montane shrub patches are distributed, with the grass species Miscanthus sinensis being dominant. At 900 m and near the peak, dense montane shrub patches or montane forest patches exist, with M. sinensis again the commonest species. The area has become one of the major forest plantations with mainly native species selected in Hong Kong, starting from 2013 [46]. Trees planted here are mostly native species, such as Ficus microcarpa, Endospermum chinense, Syzgium levinei, Antidesma bunius, Psychotria asiatica and Aquilaria sinensis, with other non-natives, such as Pinus massoniana, Acacia confusa, Lophostemon confertus and Melaleuca quinquenervia. Forests are limited to a maximum altitude of 550 m, while the upper slopes are dominated by shrubs and grasses [35].

2.2. Moss Sampling

In April 2018, five sampling elevations were selected from the northern aspect of Tai Mo Shan (Figure 1), with an elevation interval of 200 m from 100 ± 20 m to 900 ± 20 m along the altitudinal gradient. Three 100 m transects were set up approximately 20 m apart at each altitude along the contour line according to vegetation type and accessibility, and six 0.5 m × 0.5 m quadrats were established along each transect line at intervals of ~20 m. All quadrats were marked using nylon threads. At each selected elevation, all three transects were homogenous and comparable to each other regarding vegetation type, canopy height and closure, ground cover and microclimate. Quadrats were moved to the nearest suitable location if boulders or dead wood occurred on the transect lines.
Field surveys were carried out from June to August in 2018 and 2019. Species composition, thickness, cover and life forms (such as tuft, tail, weft, mat and cushion) were examined in the 90 quadrats. For moss cover measurement, a transparent plastic sheet with 25 grid cells of 0.1 m × 0.1 m was placed on each quadrat. The percentage cover of terrestrial moss species was estimated based on the number of grids occupied by terrestrial mosses with an area cover larger than 50%. The thickness (height) of the moss layer was recorded in the four cardinal directions and the center of the quadrats. Moss species in each quadrat along each transect were collected and stored in paper bags for identification in the laboratory after June 2018. Moss specimens were identified under a microscope (YS100; Nikon) in the laboratory, and the nomenclature followed that in [47,48].
The geographical distribution of the recorded species was obtained from the data of the Discover Life (https://www.discoverlife.org/ accessed on 19 July 2021), GBIF (https://www.gbif.org/ accessed on 19 July 2021), eFlora (http://www.efloras.org/index.aspx accessed on 19 July 2021) and other published databases. A phytogeographical pattern division method of bryophytes with revised and more detailed tropical division was also adopted in this study to supplement data interpretation [49]. Each species was assigned to a phytogeographical pattern on the basis of its present worldwide distribution.

2.3. Environmental and Climatic Factors

Environmental and climate data (including air temperature, relative humidity (RH), rainfall, dew point and wind speed) at each site were obtained from a local weather station if possible. For two elevations (500 and 700 m asl) from the northern aspect, weather data were not available, and climate parameters were measured at the self-deployed weather stations or were estimated according to the nearest meteorological station. Three mini weather stations were set at each elevation to collect the air temperature, dew point, relative humidity, rainfall and wind speed. Vegetation type, canopy closure, ground cover and geographic location were recorded at each sampling site. Canopy closure was determined using the densiometer method by standing in the center of each quadrat and counting at the four cardinal directions of the sampling point [50]. The number of grids with >50% plant coverage in each direction was counted, and the average calculated. Ground cover was measured from images obtained from a densiometer mirror by placing it in the center of each quadrat. Soil pH was measured using a glass electrode after shaking a 1:2.5 solution (soil to water ratio) for approximately 30 mins [51]. The environmental and climatic factors along the altitudinal gradient are presented in Table 1.

2.4. Statistical Analysis

Species richness, cover and thickness were averaged for each transect line and elevation for statistical analysis. All environmental variables were averaged for each elevation. All statistical tests were performed using SPSS (Version 26.0; IBM). Data were checked for deviation from normality and homogeneity of variance before analysis. Differences in richness, cover and the thickness of terrestrial mosses among elevation gradients were tested using a one-way ANOVA and Tukey’s HSD. Curve estimation regression models were used to describe the response of biotic variables such as species richness, cover and thickness to the elevation gradient with cubic and quadratic models. Durbin-Watson test was performed to check self-correlation in the environmental variables before canonical correlation analysis. Canonical correlation analysis (CCA) was performed to identify and measure the associations among biotic variables and environmental factors, including altitude, air temperature, dew point, relative humidity, rainfall, canopy closure, ground cover, soil pH and wind speed, using the MANOVA syntax command [52,53].

3. Results

3.1. Species Composition

A total of 134 specimens were collected from 90 quadrats and identified to belong to 53 species in 31 genera and 20 families (Appendix A Table A1). The terrestrial moss richness of different transect lines across the elevation gradient ranged from 3–10 species (Appendix B Table A2). The terrestrial moss community cover ranged from 7.2% to 23.8%, and the highest value was observed at the peak of Tai Mo Shan (Appendix B Table A2). Pogonatum inflexum dominated at 100 m, while Pseudotaxiphyllum pohliaecarpum was the most common species at 300 and 500 m asl, and Hypnum plumaeforme dominated at the peak. No dominant species was found at 700 m asl. Plant thicknesses at different altitudes ranged from 3.2 mm to 8.6 mm and increased with elevation. The most common families were Dicranaceae (consisting of three genera and seven species), Leucobryaceae (consisting of two genera and six species), Thuidiaceae (consisting of two genera and five species), Sematophyllaceae (consisting of three genera and five species) and Hypnaceae (consisting of four genera and seven species) (Appendix A Table A1).

3.2. Distribution of Terrestrial Mosses along the Elevation Gradient

Differences in species richness along the elevation gradient were not statistically significant (F = 1.245, p = 0.353, Table 2). No obvious trend was found between moss richness and elevation (R = 0.541, p = 0.264 for the cubic model, R = 0.389, p = 0.374 for the quadratic model, Figure 2a). By contrast, moss cover along the transect lines differed significantly with altitude (F = 43.331, p < 0.001, Table 2). Plant thickness differed significantly along the elevation gradient (F = 29.145, p < 0.001, Table 2). Moss cover (R = 0.892, p < 0.001 for the cubic model, R = 0.812, p < 0.01 for the quadratic model, Figure 2b) and thickness (R = 0.960, p < 0.001 for the cubic model, R = 0.953, p < 0.001 for the quadratic model, Figure 2c) increased nonlinearly with the increasing elevation. The moss plants grew better with increasing elevation, and the highest cover and thickness occurred at the peak of Tai Mo Shan.

3.3. Life Form Composition

Four different life forms were identified at the different study elevations of Tai Mo Shan. Smooth mat was the dominant moss life form overall, followed by turf (Appendix A Table A1). Different life forms prevailed at the five elevations. Smooth mat was the dominant life form at 100 m asl, turf and mat were dominant at 300 m asl, and cushion was dominant at 500 m asl. Weft, turf and mat life forms were common at 700 m asl, while at the peak, weft was most prevalent (Figure 3 and Appendix A Table A1).

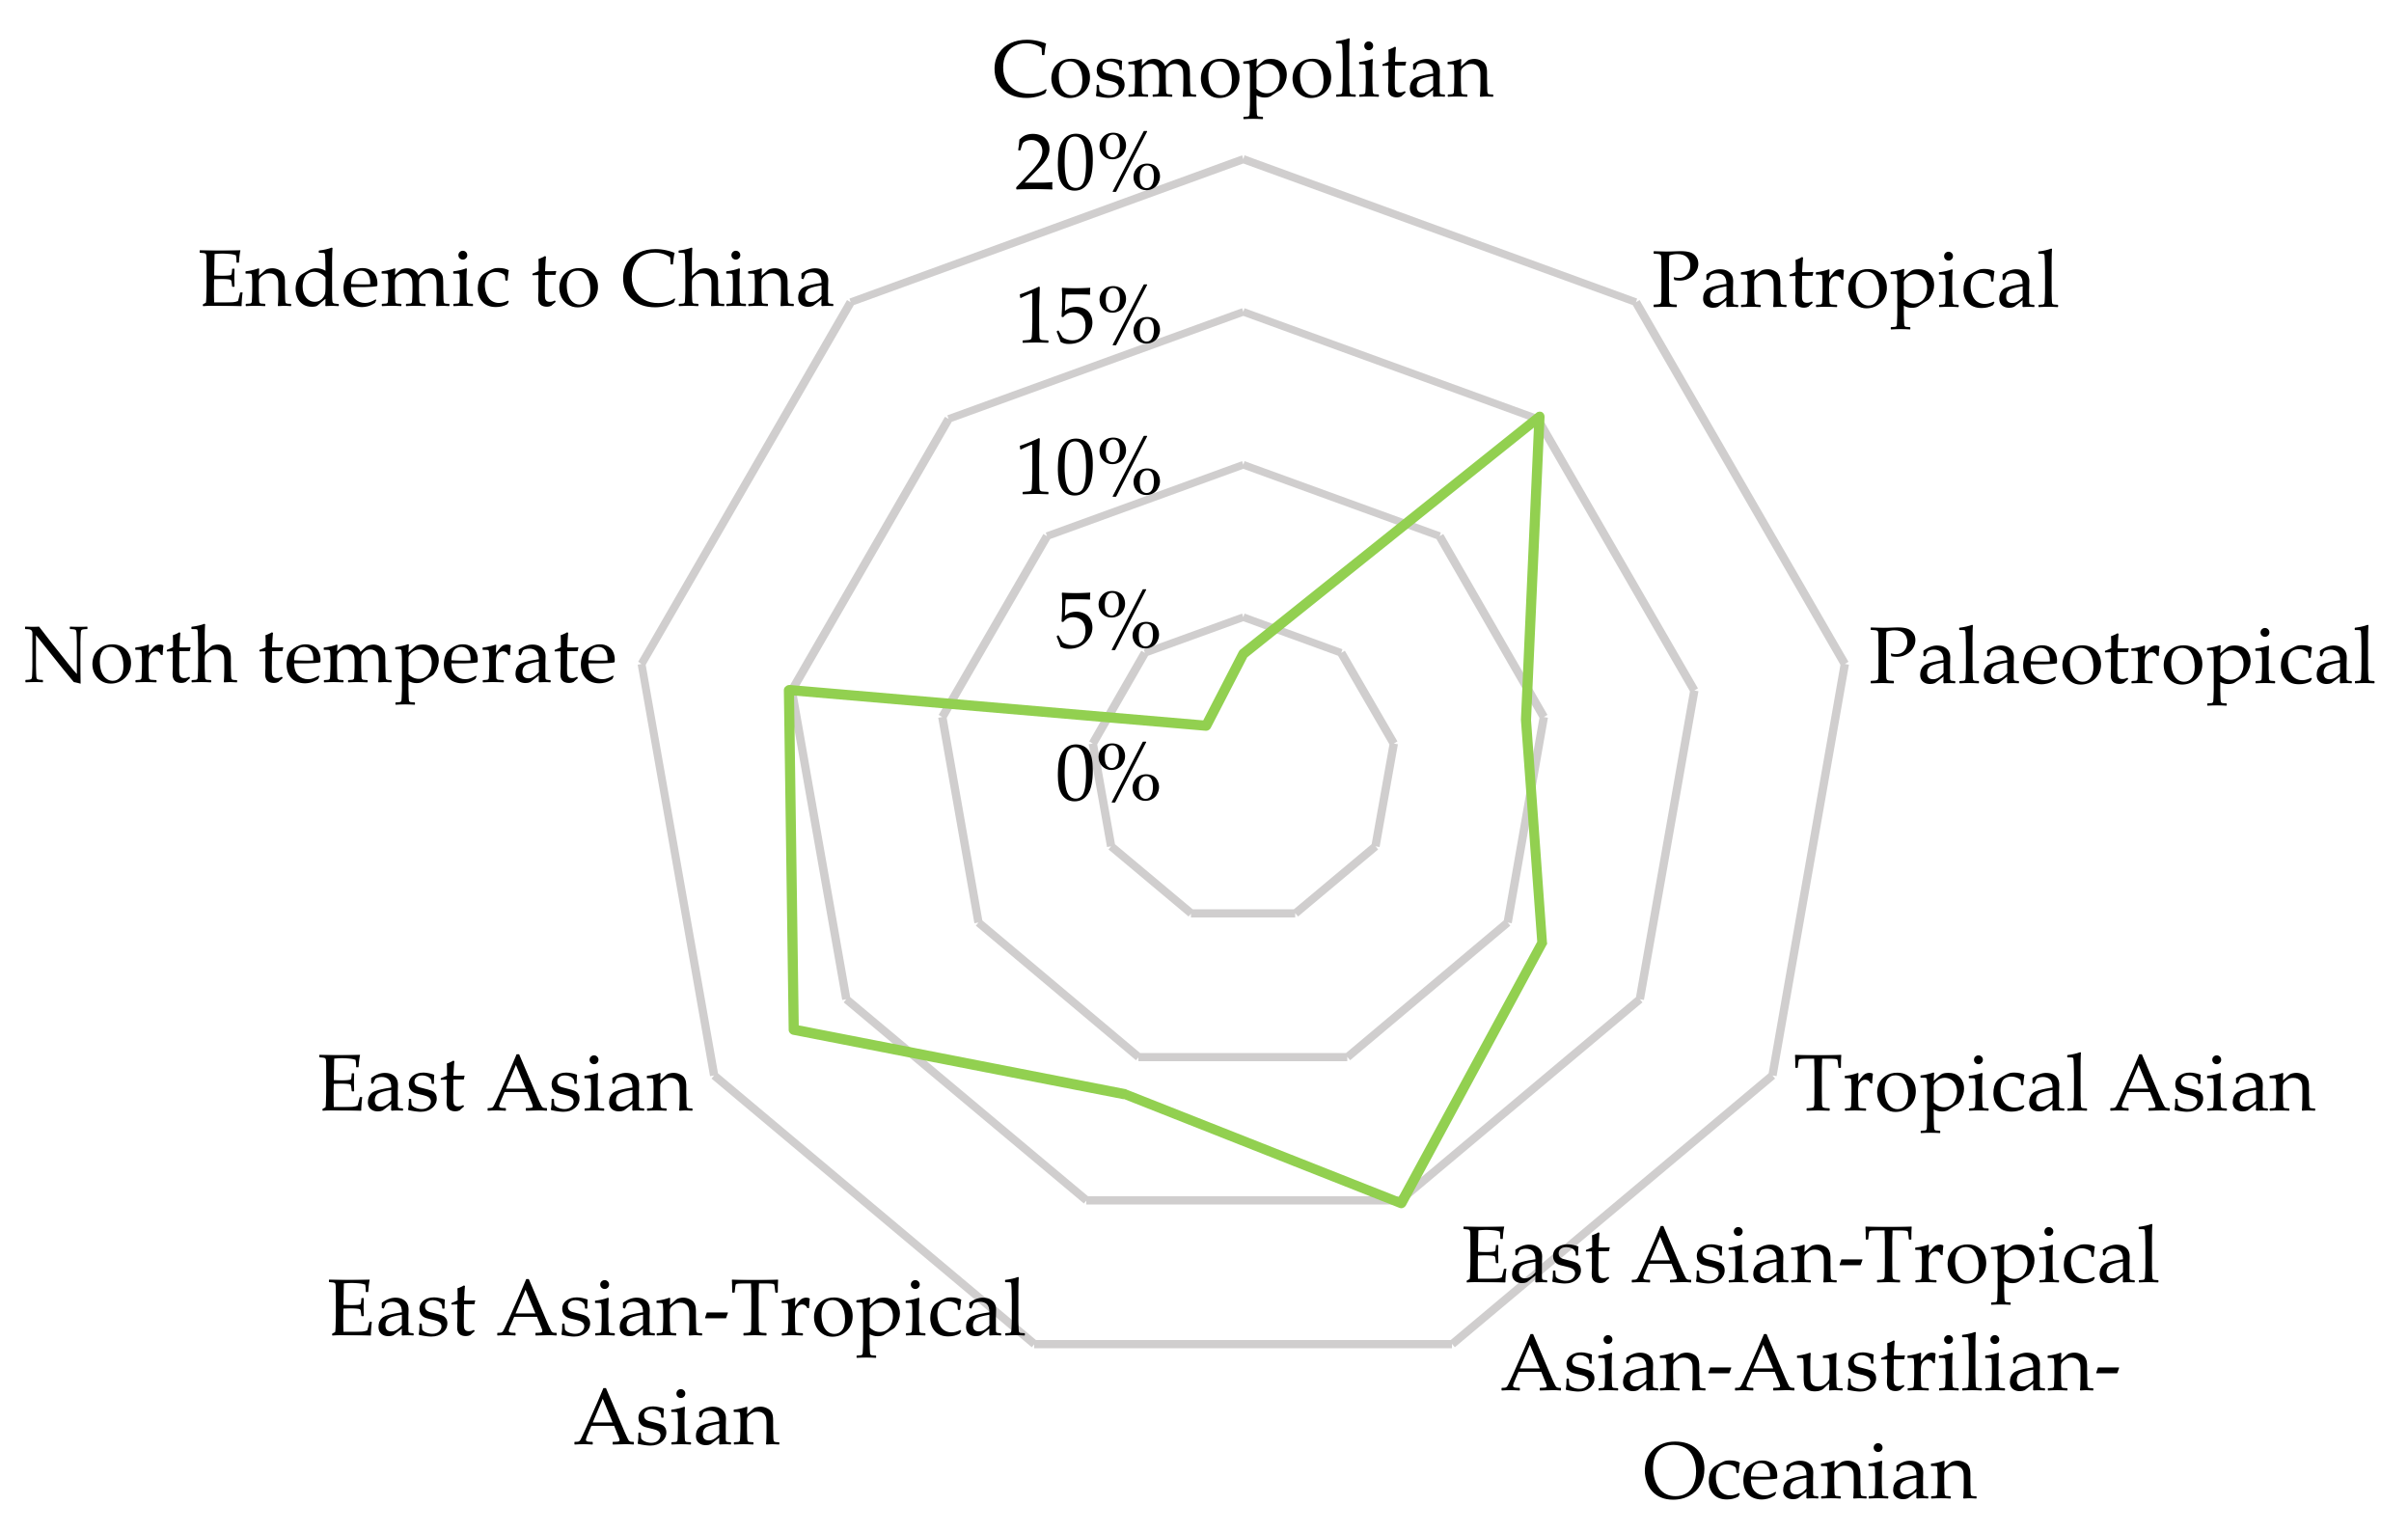
3.4. Phytogeographical Elements

Nine elements of phytogeographic patterns were identified for all terrestrial mosses found in this study (Figure 4 and Table A1 and Table A3). Excluding the cosmopolitan species, 33 of the 51 species were tropical, 14 species were continuously distributed between East Asian and tropical regions, 10 species had an East Asian pattern and 8 species were northern temperate (Table 3). Dicranodontium didymodon was the only species endemic to China.

3.5. Environmental Variables and Species Composition

The results of Durbin–Watson test ranged from 1.5–2.5, which showed no self-correlations among the environmental variables. Based on the canonical correlation analysis results, canonical variables for biotic and environmental variables were strongly associated (r1 = 0.99, p < 0.001; r2 = 0.93, p = 0.015) (Figure 5 and Table A4, Table A5 and Table A6). The first canonical coefficient explained 84.9% of the variance in the correlation and showed that the canonical variable for biotic factors (primarily coverage and thickness) was strongly related to the dew point (negative) and rainfall (positive) and, to a lesser extent, air temperature (negative) (Figure 5a). The first canonical variable for biotic factors explained 57% of the variance in these factors, whereas that for abiotic factors explained 28% of the variance. The second canonical variable suggests that the canonical factor for species richness was strongly related to ground cover and canopy closure (positive for the previous two) and, to a lesser extent, relative humidity, wind speed and altitude (negative for the latter three) (Figure 5b). The second canonical variable for biotic factors explained 24% of the variance in these factors, and that for abiotic factors explained 48% of the variance in the environmental factors.

4. Discussion

In total, 53 terrestrial moss species from 20 families and 31 genera were found in the Tai Mo Shan, which has distinct horizontal and vertical climatic gradients. This species number is relatively low due to the fact that this study was conducted in a secondary mountain forest with a smaller number of moss species on grasslands at the higher elevations and that we focused only on terrestrial mosses, in contrast to the previous findings of tropical primary forest regions, which included not only mosses, but lichens, liverworts and other epiphytes [54,55].
Elevational diversity gradients differ among various organisms in different habitats [10]. Vegetation types might explain why no obvious species abundance changes of ground moss diversity was found in the present study. Due to the large-scale deforestation centuries ago, with subsequent secondary succession, different habitats developed along the elevation gradient with different climatic conditions and vegetation types, resulting in unique and fragmented habitats which is not conducive to the dispersal and colonization by mosses [7,56]. Forests are limited to a maximum altitude of 550 m asl; the upper slopes are dominated mainly by grasses and montane shrub patches or montane forest patches with significantly lower ground cover, canopy closure and higher wind speed in contrast to that of lowland woodlands and low-hill forest at the lower elevations. The results in Table 1 showed that the two most open habitats at 700 and 900 m most clearly stood out from the other three, which suggested that the observed species compositional patterns were mainly determined by basic ecological differences of each habitat between elevations. Ground cover and canopy closure were two factors that affected the terrestrial moss diversity, which was in line with the previous findings [26,27]. Bryophytes are often regarded as shade plants, with the ability to photosynthesize effectively under low photosynthetically active radiation, even for species in open habitats [57,58,59]. Excess exposure therefore inhibits the colonization and growth of terrestrial mosses [60,61,62]. Water loss increases at approximately the square root of the wind speed [63]. Consequently, a high wind speed will curb the development and growth of terrestrial mosses. Therefore, the two open habitats at higher elevation, especially at 700 m, featured less rich diversity of terrestrial mosses. Massive disturbance has influenced species diversity patterns, as large-scale deforestation and different vegetation developments have existed along elevation gradient in this region, which supported the findings of present study [28]. From the CCA results (Figure 5, Table A4, Table A5 and Table A6), rainfall and altitude were negatively related to species richness, which indicated that vegetation types outweighed the positive effect of optimal environmental conditions of higher elevations [24,64,65,66]. No obvious trend was observed, whether increasing [29,31,33,54,55], decreasing [67] or a hump-shaped distribution [9,65,68] upon increasing elevation. The scale effect might explain the difference between these patterns. When the elevation gradient is relatively long, a hump-shaped distribution instead of a linear pattern will occur [65,69]. However, in addition to climatic variables such as rainfall [70] and temperature [71], biotic variables such as productivity [72], competition [73] and resource abundance [74] also correlate with the elevational diversity of plants and animals.
The moss layer developed better at higher elevations, and the highest cover and thickness occurred at the peak, indicating optimum environmental conditions [69]. A thicker moss layer is often associated with high cover in some species, which consequently results in higher biomass. Therefore, cover and thickness are two important parameters to model the biomass of bryophytes [69]. The important role of air temperature, dew point, rainfall and relative humidity in bryophyte growth might be due to their poikilohydry [75], and the water content is a primary factor for bryophyte productivity [76,77], whereas increasing temperature decreases moss cover [78,79]. Table 1 shows that the environmental variables including the development of different vegetation types varied significantly along the altitudinal gradient, resulting in different habitats. The effect of altitude can be explained by differences in habitats along the elevation gradient. At altitudes higher than 550 m, herbaceous plants and litter at montane grassland have a good moisture-holding capacity and nutrient availability, thus favoring the growth of ground bryophyte species [80]. Ground cover may be a better factor than canopy closure for more realistically reflecting the microclimate of ground moss species. Moss cover was significantly related to elevation, which is in line with the findings in tropical rain forests [81] and the Appalachians in eastern North America [33].
The life form of bryophytes is driven by different environmental pressures to minimize water loss to maximize net carbon dioxide uptake [82]. The life form of bryophytes is closely related to humidity and light and, to a lesser extent, temperature [83]. Short turfs and cushions were predominant in brightly lit habitats. Tails and fans were observed in the shade beneath the tropical rain forest. In the case of mats and wefts, the capillary retention of water predominates with respect to physiological activity, especially photosynthesis, which enables these life forms to extend their duration of being fully active beyond the time of rainfall. Different life forms prevail at the five elevations on Tai Mo Shan. Smooth mats and turfs were the dominant forms. Mats dominated below 400 m, whereas wefts and mats dominated above 400 m. Different life form characteristics coincide with the humidity of a habitat, such as pendants in lowlands and submontane areas (<400 m), wefts and tails in the montane belt (400–900 m) and mats and cushions in high montane and subalpine belts (above 900 m) [32]. Furthermore, smooth mats are adapted to relatively dry habitats [84]. These differences might be explained by the different bryophyte types studied (i.e., epiphytic and terrestrial).
The nine phytogeographical patterns identified in this study were divided into three groups: tropical, East Asian and temperate, except for the cosmopolitan pattern (Table 3). Although Hong Kong lies on the margin of the Asian tropics with intense human activities, the tropical element was still the largest of the three, contributing two-thirds of the total taxa, which was higher than the total number of non-tropical taxa (i.e., the sum of the East Asian and temperate taxa). High similarities were found between Hong Kong and Hainan, and tropical taxa were the most shared due to the similar climate zone [85]. The distribution of seed plants is divided into 15 phytogeographical types [86], which are also applicable to bryophytes. However, bryophytes have a wider distribution than seed plants. The present diversity and distribution of terrestrial mosses have been significantly affected by deforestation in this region, but they also offer an opportunity to explore how they survive under microclimate and habitat degradation.

5. Conclusions

Our study shows that Tai Mo Shan features rich moss species, even in warmer and dryer lowlands. However, vegetation types significantly affect the diversity and distribution of terrestrial mosses. The highest cover and thickness of ground moss species occurred at the peak of Tai Mo Shan. Cover and thickness can be used as predictors of biomass of terrestrial moss species. Life forms of terrestrial mosses were diversified, which was driven by different environmental pressures, with different life forms prevailing at different elevations. Although they are influenced by the East Asian and temperate climate and disturbed by human activities, terrestrial mosses on Tai Mo Shan are primarily tropical in nature. Under the threat of climate change, especially global warming and the uncertainty of rainfall, those lying at higher altitudes face great challenges. Forest conservation and restoration should be conducted to sustain and improve the biodiversity of terrestrial mosses and understory plants on Tai Mo Shan, especially at higher elevations.

6. Future Research

The present study only investigated terrestrial mosses, but further research on liverworts, hornworts and other understory plants should be carried out in to give more complete information of the impact of deforestation and subsequent vegetation development on understory and bryophyte communities. A comparison study in tropical primary forests in nearby Guangdong or Hainan province might provide us with more convincing evidence.

Author Contributions

J.H. and L.M.C. conceived the ideas. J.H. carried out the fieldwork, sample collection, laboratory procedures, and data analyses. L.M.C. commented on the data analyses. J.H. led the writing and L.M.C. edited the manuscript. All authors have read and agreed to the published version of the manuscript.

Funding

This study was supported by a one-line research grant from the School of Life Sciences, The Chinese University of Hong Kong.

Data Availability Statement

The authors confirm that the data supporting the findings of this study are available within the article and its Appendix A.

Acknowledgments

We thank Li Zhang from the Shenzhen Fairylake Botanical Garden and Chinese Academy of Sciences for his assistance in moss identification; The Agriculture, Fisheries and Conservation Department of the Hong Kong SAR government for allowing us to set up mini-weather stations at our experimental sites; and Rita Foo for her help with the field study.

Conflicts of Interest

The authors declare no conflict of interest.

Appendix A

Table A1. Characteristics of terrestrial mosses along altitudinal gradients.
ElevationSpeciesFamilyLife FormGeographical Element
100Syrrhopodon gardneriCalymperaceaeTurfPantropical
Syrrhopodon armatusCalymperaceaeTurfPalaeotropical
Hyophlia javanicaPottiaceaeTurfTropical Asian
Philonotis hastataBartramiaceaeCushionPantropical
Octoblepharum albidumLeucobryaceaeCushionPantropical
Schwetschkeopsis fabroniaFabroniaceaeWeftNorth temperate
Claopodium gracillimumThuidiaceaeMatEast Asian
Claopodium pellucinerveThuidiaceaeMatNorth temperate
Entodontopsis ancepsStereophyllaceaeMatTropical Asian
Fissidens guangdongenisFissidentaceaeTurfTropical Asian
Sematophyllum subpinnatumSematophyllaceaeMatPantropical
Pseudotaxiphyllum densumHypnaceaeMatEast Asian
Ectropothecium zollingeriHypnaceaeMatEast Asian-Tropical Asian-Australian-Oceanian
Vesicularia montagneiHypnaceaeMatEast Asian-Tropical Asian-Australian-Oceanian
Pogonatum inflexumPolytrichaceaeTurfEast Asian Tropical Asian
300Pleuridium subulatumDitrichaceaeTurfNorth temperate
Campylopus laxitextusDicranaceaeCushionEast Asian-Tropical Asian-Australian-Oceanian
Campulopus subulatusDicranaceaeCushionNorth temperate
Fissidens guangdongenisFissidentaceaeTurfTropical Asian
Fissidens crispulusFissidentaceaeTurfPalaeotropical
Leucobryum humillimumLeucobryaceaeWeftEast Asian Tropical Asian
Duthiella speciosissimaTrachypodaceaeWeftEast Asian
Taxithelium oblongifoliumSematophyllaceaeMatEast Asian Tropical Asian
Sematophyllum phoeniciumSematophyllaceaeMatPalaeotropical
Pseudotaxiphyllum pohliaecarpumHypnaceaeMatEast Asian-Tropical Asian-Australian-Oceanian
500Brothera leanaDicranaceaeTurfNorth temperate
Campylopus gracilisDicranaceaeCushionNorth temperate
Campylopus umbellatusDicranaceaeCushionEast Asian-Tropical Asian-Australian-Oceanian
Dicranodontium didymodonDicranaceaeCushionEndemic to China
Leucobryum bowringiiLeucobryaceaeWeftPantropical
Leucobryum boninenseLeucobryaceaeWeftEast Asian
Octoblepharum albidumLeucobryaceaeCushionPantropical
Fissidens guangdongenisFissidentaceaeTurfTropical Asian
Sematophyllum subhumileSematophyllaceaeMatEast Asian-Tropical Asian-Australian-Oceanian
Sematophyllum subpinnatumSematophyllaceaeMatPantropical
Papillidiopsis macrostictaSematophyllaceaeCushionEast Asian
Pseudotaxiphyllum pohliaecarpumHypnaceaeMatEast Asian-Tropical Asian-Australian-Oceanian
700Campulopus ericoidesDicranaceaeCushionTropical Asian
Leucobryum scabrumLeucobryaceaeWeftEast Asian
Leucobryum juniperoideumLeucobryaceaeWeftNorth temperate
Hyophlia involutaPottiaceaeTurfPantropical
Pohlia nutansBryaceaeTurfCosmopolitan
Thuidium pristocalyxThuidiaceaeMatPalaeotropical
Claopodium assurgensThuidiaceaeMatEast Asian-Tropical Asian-Australian-Oceanian
Hypnum plumaeformae var. minusHypnaceaeWeftEast Asian
Pseudotaxiphyllum densumHypnaceaeMatEast Asian
Pogonatum neesiiPolytrichaceaeTurfEast Asian-Tropical Asian-Australian-Oceanian
900Campylopus umbellatusDicranaceaeCushionEast Asian-Tropical Asian-Australian-Oceanian
Fissidens crispulusFissidentaceaeTurfPalaeotropical
Hyophlia javanicaPottiaceaeTurfTropical Asian
Pseudosymblepharis angustataPottiaceaeCushionPalaeotropical
Archidium ohioenseArchidiaceaeTurfPantropical
Anomobryum julaceumBryaceaeCushionCosmopolitan
Plagiomnium vesicatumMniaceaeMatPantropical
Pterobryopsis crassicaulisPterobryaceaeMatTropical Asian
Chrysocladium retrorsumMeteoriaceaeWeftEast Asian Tropical Asian
Thuidium glaucinoidesThuidiaceaeMatTropical Asian
Brachythecium garovaglioidesBrachytheciaceaeWeftEast Asian
Brachythecium buchananiiBrachytheciaceaeWeftEast Asian Tropical Asian
Sematophyllum subpinnatumSematophyllaceaeMatPantropical
Hypnum plumaeformeHypnaceaeWeftEast Asian Tropical Asian
Hypnum callichroumHypnaceaeWeftNorth temperate

Appendix B

Table A2. Composition and distribution of terrestrial mosses along the altitudinal gradient (n = 6).
Site No.Transect No.Altitude (m asl)Total Number of SpeciesCover (%)Thickness (mm)
111001017.03.1
2110614.52.8
3120813.63.8
212901010.23.5
2306710.83.2
3315610.23.0
31490715.83.1
2505810.73.3
3512610.34.0
4169077.34.5
270537.06.0
372057.34.7
51890623.58.1
29001025.010.0
3912723.07.7

Appendix C

Table A3. Phytogeographical elements of terrestrial mosses on Tai Mo Shan.
PatternsMoss Species (% Total)
1. Cosmopolitan2 (3.8%)
2. Pantropical8 (15.1%)
3. Paleotropical5 (9.4%)
4. Tropical Asian6 (11.3%)
5. East Asian–Tropical Asian–Australian–Oceanian8 (15.1%)
6. East Asian9 (17.0%)
7. East Asian–Tropical Asian6 (11.3%)
8. Northern temperate8 (15.1%)
9. Endemic to China1 (1.9%)
Total53

Appendix D

Table A4. Canonical correlation coefficients for canonical variable sets for biotic and environmental variables.
Canonical Variable SetsCanonical Correlation CoefficientCanonical Variance Explained (%)Fdfp
10.98584.98.542150.000
20.92214.63.53380.015
30.3550.40.43230.735

Appendix E

Table A5. Canonical loadings for biotic and environmental variables.
Set 1Set 2Set 3
Biotic variables
Species richness0.2670.6170.741
Cover0.9610.274−0.030
Thickness0.846−0.5140.143
Environmental variables
Air temperature−0.6210.658−0.085
Dew point−0.8000.486−0.088
Relative humidity0.352−0.7360.051
Rainfall0.733−0.6230.082
pH0.0690.3890.067
Ground cover−0.2320.878−0.035
Canopy closure−0.4530.845−0.086
Wind speed0.498−0.738−0.029
Altitude0.566−0.7500.048

Appendix F

Table A6. Proportion (%) of variance explained.
Canonical Variable SetsSet 1 by SelfSet 1 by Set 2Set 2 by SelfSet 2 by Set 1
157.055.328.027.2
224.020.448.241.0
319.02.40.40.1

References

  1. Goffinet, B.; Buck, W.R. Systematics of Bryophyta: From molecules to a revised classification. In Molecular Systematics of Bryophytes (Monographs in Systematic Botany); Goffinet, B., Hollowel, V., Magill, R., Eds.; Missouri Botanical Garden Press: St. Louis, MO, USA, 2004; pp. 205–239. [Google Scholar]
  2. Dowle, E.J.; Morgan-Richards, M.; Trewick, S.A. Molecular evolution and the latitudinal biodiversity gradient. Heredity 2013, 110, 501–510. [Google Scholar] [CrossRef] [Green Version]
  3. Hillebrand, H. On the generality of the latitudinal diversity gradient. Am. Nat. 2004, 163, 192–211. [Google Scholar] [CrossRef] [Green Version]
  4. Sahney, S.; Benton, M.J. Recovery from the most profound mass extinction of all time. Proc. R. Soc. B Biol. Sci. 2008, 275, 759–765. [Google Scholar] [CrossRef] [Green Version]
  5. Frahm, J.-P. Diversity of bryophyte species in the tropics. Trop. Bryol. 2003, 23, 13–21. [Google Scholar]
  6. Gaston, K.J. Global patterns in biodiversity. Nature 2000, 405, 220–227. [Google Scholar] [CrossRef]
  7. Glime, J.M. Tropics: Disturbance and conservation. In Bryophyte Ecology: Habitat and Role; Glime, J.M., Ed.; Michigan Tech Open Access Publications: Houghton, MI, USA, 2019; Volume 4, pp. 223–232. [Google Scholar]
  8. Glime, J.M. Meet the bryophytes. In Bryophyte Ecology: Physiological Ecology; Glime, J.M., Ed.; Michigan Tech Open Access Publications: Houghton, MI, USA, 2017; Volume 1, pp. 1–10. [Google Scholar]
  9. Grau, O.; Grytnes, J.; Birks, H.J.B. A comparison of altitudinal species richness patterns of bryophytes with other plant groups in Nepal, Central Himalaya. J. Biogeogr. 2007, 34, 1907–1915. [Google Scholar] [CrossRef]
  10. Grytnes, J.A.; Heegaard, E.; Ihlen, P.G. Species richness of vascular plants, bryophytes and lichens along an altitudinal gradient in western Norway. Acta Oecol. 2006, 29, 241–246. [Google Scholar] [CrossRef]
  11. Liede-Schumann, S.; Breckle, S.-W. Bryophyta checklists. In Provisional Checklists of Flora and Fauna of the San Francisco Valley and its Surroundings (Reserva Biológica San Francisco, Province Zamora-Chinchipe, Southern Ecuador); Liede-Schumann, S., Breckle, S.-W., Eds.; Society of Tropical Ecology: Bonn, Germany, 2008; pp. 60–89. [Google Scholar]
  12. Belnap, J.; Budel, B.; Lange, O.L. Biological soil crusts: Characteristics and distribution. In Ecological Studies: Biological Soil Crusts: Structure, Function, and Management; Belnap, J., Lange, O.L., Eds.; Springer: Berlin, Germany, 2003; Volume 150, pp. 3–30. [Google Scholar]
  13. Seitz, S.; Nebel, M.; Goebes, P.; Käppeler, K.; Schmidt, K.; Shi, X.; Song, Z.; Webber, C.L.; Weber, B.; Scholten, T. Bryophyte-dominated biological soil crusts mitigate soil erosion in an early successional Chinese subtropical forest. Biogeosciences 2017, 14, 5775–5788. [Google Scholar] [CrossRef] [Green Version]
  14. Zhao, J.; Zheng, Y.; Zhang, B.; Chen, Y.; Zhang, Y. Progress in the study of algae and mosses in biological soil crusts. Front. Biol. China 2009, 4, 143–150. [Google Scholar] [CrossRef]
  15. Clark, K.L.; Nadkarni, N.M.; Gholz, H.L. Retention of inorganic nitrogen by epiphytic bryophytes in a tropical montane forest. Biotropica 2005, 37, 328–336. [Google Scholar] [CrossRef]
  16. Turetsky, M.R. The role of bryophytes in carbon and nitrogen cycling. Bryologist 2003, 106, 395–409. [Google Scholar] [CrossRef]
  17. Beringer, J.; Lynch, A.H.; Chapin, F.S.; Mack, M.; Bonan, G.B. The representation of arctic soils in the land surface model: The importance of mosses. J. Clim. 2001, 14, 3324–3335. [Google Scholar] [CrossRef]
  18. Hölscher, D.; Köhler, L.; van Dijk, A.; Bruijnzeel, L.A. The importance of epiphytes to total rainfall interception by a tropical montane rain forest in Costa Rica. J. Hydrol. 2004, 292, 308–322. [Google Scholar] [CrossRef]
  19. Delach, A.; Kimmerer, R.W. The effect of Polytrichum piliferum on seed germination and establishment on iron mine tailings in New York. Bryologist 2002, 105, 249–255. [Google Scholar] [CrossRef]
  20. Jeschke, M.; Kiehl, K. Effects of a dense moss layer on germination and establishment of vascular plants in newly created calcareous grasslands. Flora 2008, 203, 557–566. [Google Scholar] [CrossRef]
  21. Shen, T.; Corlett, R.T.; Song, L.; Ma, W.-Z.; Guo, X.-L.; Song, Y.; Wu, Y. Vertical gradient in bryophyte diversity and species composition in tropical and subtropical forests in Yunnan, SW China. J. Veg. Sci. 2018, 29, 1075–1087. [Google Scholar] [CrossRef]
  22. Song, L.; Liu, W.Y.; Nadkarni, N.M. Response of non-vascular epiphytes to simulated climate change in a montane moist evergreen broad-leaved forest in southwest China. Biol. Conserv. 2012, 152, 127–135. [Google Scholar] [CrossRef]
  23. He, X.; He, K.S.; Hyvönen, J. Will bryophytes survive in a warming world? Perspect. Plant Ecol. Evol. Syst. 2016, 19, 49–60. [Google Scholar] [CrossRef]
  24. Raabea, S.; Müllerb, J.; Manthey, M.; Dürhammer, O.; Teuber, U.; Göttlein, A. Drivers of bryophyte diversity allow implications for forest management with a focus on climate change. For. Ecol. Manag. 2010, 260, 1956–1964. [Google Scholar] [CrossRef]
  25. Kricher, J.C. Other tropical ecosystems: From the mountains to the rivers to the sea. In Tropical Ecology; Princeton University Press: Princeton, NJ, USA, 2011; pp. 423–437. [Google Scholar]
  26. Shields, J.M.; Webster, C.R.; Glime, J.M. Bryophyte community response to silvicultural opening size in a managed northern hardwood forest. For. Ecol. Manag. 2007, 252, 222–229. [Google Scholar] [CrossRef]
  27. Weibull, H.; Rydin, H. Bryophytes species richness on boulders: Relationship to area, habitat diversity and canopy tree species. Biol. Conserv. 2005, 122, 71–79. [Google Scholar] [CrossRef]
  28. Bardat, J.; Aubert, M. Impact of forest management on the diversity of corticolous bryophyte assemblages in temperate forests. Biol. Conserv. 2007, 139, 47–66. [Google Scholar] [CrossRef]
  29. Ah-Peng, C.; Chuah-Petiot, M.; Descamps-Julien, B.; Bardat, J.; Stamenoff, P. Bryophyte diversity and distribution along an altitudinal gradient on a lava flow in La Reunion. Divers. Distrib. 2007, 13, 654–662. [Google Scholar] [CrossRef]
  30. Andrew, N.R.; Rodgerson, L.; Dunlop, M. Variation in invertebrate-bryophyte community structure at different spatial scales along altitudinal gradients. J. Biogeogr. 2003, 30, 731–746. [Google Scholar] [CrossRef]
  31. Bruun, H.H.; Moen, J.; Virtanen, R.; Grytnes, J.A.; Oksanen, L. Effects of altitude and topography on species richness of vascular plants, bryophytes and lichens in alpine communities. J. Veg. Sci. 2006, 17, 37–46. [Google Scholar] [CrossRef]
  32. Frahm, J.-P. Ecology of bryophytes along altitudinal and latitudinal gradients in Chile. Trop. Bryol. 2002, 21, 67–79. [Google Scholar]
  33. Stehn, S.E.; Webster, C.R.; Glime, J.M. Elevational gradients of bryophyte diversity, life forms, and community assemblage in the southern Appalachian Mountains. Can. J. For. Res. 2010, 40, 2164–2174. [Google Scholar] [CrossRef]
  34. Corlett, R.T. Human impact on the flora of Hong Kong Island. In The Changing Face of East Asia during Tertiary and Quaternary; Jablonski, N., Ed.; Center of Asian Research: Hong Kong, China, 1997; pp. 400–412. [Google Scholar]
  35. Zhuang, X.Y.; Corlett, R.T. Forest and forest succession in Hong Kong. J. Trop. Ecol. 1997, 14, 857–866. [Google Scholar] [CrossRef] [Green Version]
  36. Ashworth, J.M.; Corlett, R.T.; Dudgeon, D.; Melville, D.S.; Tang, W.S.M. Hong Kong Ecological Database; World Wide Fund for Nature: Hong Kong, China, 1993. [Google Scholar]
  37. Corlett, R.T. Environmental heterogeneity and species survival in degraded tropical landscapes. In The Ecological Consequences of Environmental Heterogeneity; Hutchings, M.J., John, E.A., Stewart, A., Eds.; Blackwell Science: Oxford, UK, 2000; pp. 333–355. [Google Scholar]
  38. Owen, B.; Shaw, R. Hong Kong Landscapes: Shaping the Barren Rock; Hong Kong University Press: Hong Kong, China, 2007. [Google Scholar]
  39. Planning Department. Land Use in Hong Kong. Available online: https://www.pland.gov.hk/pland_en/info_serv/statistic/landu.html (accessed on 1 September 2018).
  40. Agriculture, Fisheries and Conservation Department. Hong Kong: The Facts—Country Parks and Special Areas. Available online: https://www.afcd.gov.hk/english/country/cou_lea/the_facts.html (accessed on 11 June 2021).
  41. Dudgeon, D.; Corlett, R.T. Hills and Streams: An Ecology of Hong Kong; Hong Kong University Press: Hong Kong, China, 1994. [Google Scholar]
  42. Agriculture, Fisheries and Conservation Department. Hong Kong Biodiversity Database: The Natural Environment, Plants & Animals in Hong Kong. Available online: https://www.afcd.gov.hk/english/conservation/hkbiodiversity/hkbiodiversity.html (accessed on 1 September 2020).
  43. Hu, Q.-M. Preface: Rare and Precious Plants of Hong Kong; Agriculture, Fisheries and Conservation Department, Hong Kong Government: Hong Kong, China, 2003. [Google Scholar]
  44. Zhang, L. An updated and annotated inventory of Hong Kong Bryophytes. Mem. Hong Kong Nat. Hist. Soc. 2003, 26, 1–133. [Google Scholar]
  45. Hong Kong Observatory. Monthly Means of Meteorological Elements for Tai Mo Shan, 1997–2016: Cold/Hot Weather and Rainfall Statistics. Available online: https://www.hko.gov.hk/en/wxinfo/pastwx/mws2016/mws201601.htm (accessed on 2 February 2016).
  46. BGCI Webinar Series: Increasing Native Species Supply for Ecological Restoration: Restoring a Diverse Forest in Hong Kong. Available online: https://www.bgci.org/news-events/bgci-webinar-series-increasing-native-species-supply-for-ecological-restoration/ (accessed on 27 May 2021).
  47. Wu, D.L.; Zhang, L. Bryophyte Flora of Guangdong, 1st ed.; Guangdong Science and Technology Press: Guangzhou, China, 2013. [Google Scholar]
  48. Wu, P.C.; Jia, Y.; Wang, Q.H.; Yu, N.-N.; He, Q.; Wang, M.Z. Chinese Illustrated Bryophytes, 1st ed.; China Forestry Publishing House: Beijing, China, 2018. [Google Scholar]
  49. Shen, L.; Yu, J.; Li, D.-D.; Guo, S.-L. Geographical elements of bryophytes recorded from Zhoushan archipelago-discussion on methods of geographical element division of bryophytes. Bull. Bot. Res. 2019, 39, 826–834. [Google Scholar]
  50. Korhonen, L.; Korhonen, K.T.; Rautiainen, M.; Stenberg, P. Estimation of forest canopy cover: A comparison of field measurement techniques. Silva Fenn. 2006, 40, 315. [Google Scholar] [CrossRef] [Green Version]
  51. Dick, W.A.; Cheng, L.; Wang, P. Soil acid and alkaline phosphatase activity as pH adjustment indicators. Soil Biochem. 2000, 32, 1915–1919. [Google Scholar] [CrossRef]
  52. Afifi, A.; Clark, V.A.; May, S. Computer-Aided Multivariate Analysis, 4th ed.; Chapman & Hall/CRC Press: Boca Raton, FL, USA, 2004. [Google Scholar]
  53. Garson, G.D. GLM Multivariate, MANOVA, and Canonical Correlation; Statistical Associates Publishers: Asheboro, NC, USA, 2015. [Google Scholar]
  54. Wagner, S.; Bader, M.Y.; Zotz, G. Physiological ecology of tropical bryophytes. In Photosynthesis in Bryophytes and Early Land Plants: Advances in Photosynthesis and Respiration; Hanson, D., Rice, S., Eds.; Springer: Dordrecht, The Netherlands, 2014; Volume 37, pp. 269–289. [Google Scholar]
  55. Zotz, G. Altitudinal changes in diversity and abundance of non-vascular epiphytes in the tropics: An ecophysiological explanation. Selbyana 1999, 20, 256–260. [Google Scholar]
  56. Wagner, S.; Zotz, G.; Bader, M.Y. The temperature acclimation potential of terrestrial bryophytes. Plant Biol. 2014, 16, 117–124. [Google Scholar] [CrossRef] [PubMed]
  57. Longton, R.E. Physiological processes and response to stress. In Biology of Polar Bryophytes and Lichens; Longton, R.E., Ed.; Cambridge University Press: Cambridge, UK, 1988; pp. 141–210. [Google Scholar]
  58. Marchall, M.; Proctor, M.C.F. Are bryophytes shade plants? Photosynthetic light responses and proportions of chlorophyll a, chlorophyll b and total carotenoids. Ann. Bot. 2004, 94, 593–603. [Google Scholar] [CrossRef] [PubMed] [Green Version]
  59. Tuba, Z. Light, temperature and desiccation responses of CO2-exchange in desiccation tolerant moss, Tortula ruralis. Symp. Biol. Hung. 1987, 35, 137–150. [Google Scholar]
  60. Corrales, A.; Duque, A.; Uribe, J.; Londoño, V. Abundance and diversity patterns of terrestrial bryophyte species in secondary and planted montane forests in the northern portion of the Central Cordillera of Colombia. Bryologist 2010, 113, 8–21. [Google Scholar] [CrossRef]
  61. Peintinger, M.; Bergamini, A. Community structure and diversity of bryophytes and vascular plants in abandoned fen meadows. Plant Ecol. 2006, 185, 1–17. [Google Scholar] [CrossRef] [Green Version]
  62. Virtanen, R.; Crawley, M.J. Contrasting patterns in bryophyte and vascular plant species richness in relation to elevation, biomass and Soay sheep on St Kilda, Scotland. Plant Ecol. Divers. 2010, 3, 77–85. [Google Scholar] [CrossRef]
  63. Proctor, M.C.F. Climate responses and limits of bryophytes: Comparisons and contracts with vascular plants. In Bryophyte Ecology and Climate Change; Slack, N., Tuba, Z., Stark, L.R., Eds.; Cambridge University Press: Cambridge, UK, 2011; pp. 35–54. [Google Scholar]
  64. Porley, R.; Hodgetts, N. Mosses and Liverworts; Harper Collins Publishers: London, UK, 2005. [Google Scholar]
  65. Spitale, D. The interaction between elevation gradient and substratum reveals how bryophytes respond to the climate. J. Veg. Sci. 2016, 27, 844–853. [Google Scholar] [CrossRef]
  66. Wang, Z.-M.; Ye, W.; Xing, F.-W. Bryophyte diversity on a tropical continental island (Hainan, China): Potential vulnerable species and environmental indicators. J. Bryol. 2019, 41, 350–360. [Google Scholar] [CrossRef]
  67. Tusiime, F.M.; Byarujali, S.M.; Bates, J.W. Diversity and distribution of bryophytes in three forest types of Bwindi Impenetrable National Park, Uganda. Afr. J. Ecol. 2007, 45, 79–87. [Google Scholar] [CrossRef]
  68. Ah-Peng, C.; Wilding, N.; Kluge, J.; Descamps-Julien, B.; Bardat, J.; Chuah-Petiot, M.; Strasberg, D.; Hedderson, T.A. Bryophyte diversity and range size distribution along two altitudinal gradients: Continent vs. island. Acta Oecol. 2012, 42, 58–65. [Google Scholar] [CrossRef]
  69. Sun, S.Q.; Wu, Y.H.; Wang, G.X.; Zhou, J.; Yu, D.; Bing, H.J.; Luo, J. Bryophyte species richness and composition along an altitudinal gradient in Gongga Mountain, China. PLoS ONE 2013, 8, 1–10. [Google Scholar]
  70. Rosenzweig, M.L. Species diversity gradients: We know more and less than we thought. J. Mammal. 1992, 73, 715–730. [Google Scholar] [CrossRef]
  71. Pounds, J.A.; Bustamante, M.R.; Coloma, L.A.; Consuegra, J.A.; Fogden, M.P.; Foster, P.N.; Young, B.E. Widespread amphibian extinctions from epidemic disease driven by global warming. Nature 2006, 439, 161–167. [Google Scholar] [CrossRef] [PubMed]
  72. Sanders, N.J.; Lessard, J.P.; Fitzpatrick, M.C.; Dunn, R.R. Temperature, but not productivity or geometry, predicts elevational diversity gradients in ants across spatial grains. Glob. Ecol. Biogeogr. 2007, 16, 640–649. [Google Scholar] [CrossRef]
  73. Bryant, J.A.; Lamanna, C.; Morlon, H.; Kerkhoff, A.J.; Enquist, B.J.; Green, J.L. Microbes on mountainsides: Contrasting elevational patterns of bacterial and plant diversity. Proc. Natl. Acad. Sci. USA 2008, 105, 11505–11511. [Google Scholar] [CrossRef] [Green Version]
  74. Sánchez-Cordero, V. Elevation gradients of diversity for rodents and bats in Oaxaca, Mexico. Glob. Ecol. Biogeogr. 2001, 10, 63–76. [Google Scholar] [CrossRef]
  75. Uchida, M.; Muraoka, H.; Nakatsubo, T.; Bekku, Y.; Ueno, T.; Kanda, H.; Koizumi, H. Net photosynthesis, respiration, and production of the moss Sanionia uncinata on a glacier foreland in the high arctic, Ny-Ålesund, Svalbard. Arct. Antarct. Alp. Res. 2002, 34, 287–292. [Google Scholar] [CrossRef]
  76. Metcalfe, D.B.; Ahlstrand, J.C.M. Effects of moisture dynamics on bryophyte carbon fluxes in a tropical cloud forest. New Phytol. 2019, 222, 1766–1777. [Google Scholar] [CrossRef] [PubMed]
  77. Skre, O.; Oechel, W.C. Moss functioning in different taiga ecosystems in interior Alaska: I. Seasonal, phenotypic, and drought effects on photosynthesis and response patterns. Oecologia 1981, 48, 50–59. [Google Scholar] [CrossRef] [PubMed]
  78. Jónsdóttir, I.S.; Magnússon, B.; Gudmundsson, J.; Elmarsdóttir, Á.; Hjartarson, H. Variable sensitivity of plant communities in Iceland to experimental warming. Glob. Chang. Biol. 2005, 11, 553–563. [Google Scholar] [CrossRef]
  79. Walker, M.D.; Wahre, C.H.; Hollister, R.D.; Henry, G.H.R.; Ahlquist, L.E.; Alatalo, J.M.; Wookey, P.A. Plant community responses to experimental warming across the tundra biome. Proc. Natl. Acad. Sci. USA 2006, 103, 1342–1346. [Google Scholar] [CrossRef] [Green Version]
  80. Rincon, E. The effect of herbaceous litter on bryophyte growth. J. Bryol. 1988, 15, 209–217. [Google Scholar] [CrossRef]
  81. Frahm, J.-P.; Gradstein, S.R. An altitudinal zonation of tropical rain forests using bryophytes. J. Biogeogr. 1991, 18, 669–678. [Google Scholar] [CrossRef]
  82. Proctor, M.C.F. Physiological ecology. In Bryophyte Biology; Goffinet, B., Shaw, A.J., Eds.; Cambridge University Press: Cambridge, UK, 2009; pp. 237–268. [Google Scholar]
  83. Mägdefrau, K. Life-forms of Bryophytes. In Bryophyte Ecology; Smith, A.J.E., Ed.; Springer: Dordrecht, The Netherlands, 1982; pp. 45–58. [Google Scholar]
  84. Bates, J. Is ‘life-form’ a useful concept in bryophyte ecology? Oikos 1998, 82, 223–237. [Google Scholar] [CrossRef]
  85. Zhang, L.; Corlett, R. Phytogeography of Hong Kong bryophytes. J. Biogeogr. 2003, 30, 1329–1337. [Google Scholar] [CrossRef]
  86. Wu, Z.-Y.; Zhou, Z.-K.; Li, D.-Z.; Peng, H.; Sun, H. The areal types of the world families of seed plants. Acta Bot. Yunnanica 2003, 25, 245–257. (In Chinese) [Google Scholar]
Figure 1. Map showing the study site on Tai Mo Shan in the central part of Hong Kong (upper), and Google map with the five sampling points on Tai Mo Shan from 100 m to 900 m with elevation intervals of 200 m (lower).
Forests 12 00961 g001
Figure 2. Characteristics of terrestrial moss distributed along the elevation gradient; (a): species richness along elevational gradient; (b): cover of terrestrial moss species along elevational gradient; (c): thickness of moss layer along elevation gradient.
Forests 12 00961 g002
Figure 3. Dominant life forms of terrestrial mosses at five elevations.
Forests 12 00961 g003
Figure 4. Nine phytogeographical elements of terrestrial mosses on Tai Mo Shan.
Forests 12 00961 g004
Figure 5. Structure of the first (a) and second (b) canonical variables sets of the CCA.
Forests 12 00961 g005
Table 1. Environmental and climatic factors along the altitudinal gradient (n = 3).
AltitudeATDPRHRFpHGCCCWSVT
10027.2 a23.4 a84.8 d1838 b4.99 a89.3 c88.8 b12.3 bDense broad-leaved lowland woodland (Glochidion hongkongense)
30025.4 b22.6 b88.2 c1917 ab4.68 b94.7 a90.0 a5.30 dDense broad-leaved lowland woodland (Syzgium levinei)
50023.9 c22.0 c91.8 b1992 ab4.27 c92.0 b88.7 c7.70 cDense broad-leaved low-hill forest (Cinnamomum porrectum)
70023.2 d21.9 c92.6 ab2077 ab4.54 b53.5 e41.9 e25.9 aGrassland with small montane shrub patches (Miscanthus sinensis)
90021.0 e19.7 d93.4 a2271 a4.60 b68.4 d45.0 d25.3 aGrassland with dense montane shrub patches (Miscanthus sinensis)
Values followed by different letters are significantly different (p < 0.05) among various altitudes. Altitude: m above sea level; AT: °C mean daily air temperature; DP: °C dew point; RH: % relative humidity; RF: mm rainfall; GC: % ground cover; CC: % canopy closure; WS: wind speed km/h; VT: vegetation type (with most dominant species for each elevation within brackets).
Table 2. One-way ANOVA showing the composition and distribution of terrestrial mosses along the elevation gradient (n = 3).
SiteAltitude (m asl)Species RichnessCover (%)Thickness (mm)
11008.0 ± 1.2 a15.0 ± 1.0 b3.23 ± 0.3 b
23007.7 ± 1.2 a10.4 ± 0.2 c,d3.23 ± 0.2 b
35007.0 ± 0.6 a12.3 ± 1.8 b,c3.47 ± 0.3 b
47005.0 ± 1.2 a7.2 ± 0.1 d5.07 ± 0.5 b
59007.7 ± 1.2 a23.8 ± 0.6 a8.60 ± 0.7 a
Values followed by different letters are significantly different (p < 0.05) among various sites.
Table 3. General phytogeographical elements of terrestrial moss species on Tai Mo Shan.
General PatternsMoss Species (% Total)Patterns in Appendix C Table A3
Tropical33 (64.7%)2, 3, 4, 5, 7
East Asian24 (47.1%)5, 6, 7, 9
Temperate8 (15.7%)8
Total51
Publisher’s Note: MDPI stays neutral with regard to jurisdictional claims in published maps and institutional affiliations.

