Growth Parameters and Spawning Season Estimation of Four Important Flyingfishes in the Kuroshio Current Off Taiwan and Implications From Comparisons With Global Studies
 Shui-Kai Chang
 Tzu-Lun Yuan
 Simon D. Hoyle
 Jessica H. Farley4
  Jen-Chieh Shiao
- 1Graduate Institute of Marine Affairs, National Sun Yat-sen University, Kaohsiung, Taiwan
- 2Department of Applied Mathematics, Tunghai University, Taichung, Taiwan
- 3National Institute of Water and Atmospheric Research Ltd. (NIWA), Port Nelson, Nelson, New Zealand
- 4CSIRO Oceans and Atmosphere, Hobart, TAS, Australia
- 5Institute of Oceanography, National Taiwan University, Taipei, Taiwan
Growth shapes the life history of fishes. Establishing appropriate aging procedures and selecting representative growth models are important steps in developing stock assessments. Flyingfishes (Exocoetidae) have ecological, economic, and cultural importance to many coastal countries including Taiwan. There are 29 species of flyingfishes found in the Kuroshio Current off Taiwan and adjacent waters, comprising 56% of the flyingfishes taxa recorded worldwide. Among the six dominant species in Taiwan, four are of special importance. This study reviews aging data of these four species, documents major points of the aging methods to address three aging issues identified in the literature, and applies multi-model inference to estimate sex-combined and sex-specific growth parameters for each species. The candidate growth models examined included von Bertalanffy, Gompertz, Logistic, and Richards models, and the resulting optimal model tended to be the von Bertalanffy model for sex-combined data and Gompertz and von Bertalanffy models for sex-specific cases. The study also estimates hatch dates from size data collected from 2008 to 2017; the results suggest that the four flyingfishes have two spawning seasons per year. Length-weight relationships are also estimated for each species. Finally, the study combines the optimal growth estimates from this study with estimates for all flyingfishes published globally, and statistically classifies the estimates into clusters by hierarchical clustering analysis of logged growth parameters. The results demonstrate that aging materials substantially affect growth parameter estimates. This is the first study to estimate growth parameters of flyingfishes with multiple model consideration. This study provides advice for aging flyingfishes based on the three aging issues and the classification analysis, including a recommendation of using the asterisci for aging flyingfishes to avoid complex otolith processing procedures, which could help researchers from coastal countries to obtain accurate growth parameters for many flyingfishes.
Introduction
Growth and reproduction are the most important factors that act to increase fish biomass (King, 2007). How fast an animal grows and whether it reproduces once or twice, or more, in a lifespan are part of the crucial information on fish life history traits used for stock status assessment, which is essential for developing management plans for the resource. A mathematical model describing population growth has many functions, such as converting input catch estimates from biomass to numbers and converting output numbers into biomass (Maunder and Piner, 2015; Francis et al., 2016). Thus, inappropriate or uncertain age estimation or growth parameters can lead to misleading perceptions of population condition, cohort strength (recruitment), and the level of fishing mortality (Campana, 2001; Maunder and Piner, 2015). It can also affect the estimation of natural mortality and the mean age at maturity (Then et al., 2015; Farley et al., 2017; McKechnie et al., 2017), and consequently affect the reliability of scientific advice on stock status and related management measures (Eero et al., 2015; Hüssy et al., 2016; McKechnie et al., 2017).
Establishing appropriate aging procedures and selecting representative growth models are important steps in developing stock assessments (Maunder and Piner, 2015; Maunder et al., 2016). Campana (2001) documented many age validation methods, while Thorrold and Hare (2002) summarized four major methodological issues that aging researchers need to address when using otoliths as the aging material for reef fish, i.e., which otolith to use, deposition rate determination, first increment validation, and settlement marks. The first three issues (referred to as the three aging issues hereafter) should also be considered when performing aging studies on pelagic fish species.
The von Bertalanffy growth model (VBGM) has been widely used in fitting age and length data, but ontogenetic changes in growth rates not represented by the standard VBGM are commonly observed for many species, and so alternative models should be explored (Roff, 1980; Maunder et al., 2016). The multi-model inference approach (Katsanevakis, 2006; Katsanevakis and Maravelias, 2008) has been applied to evaluate multiple candidate growth models and many such studies have rejected the VBGM as the best growth model for the studied species (Williams et al., 2012; Carbonara et al., 2020; Liu et al., 2021), while some still support VBGM as the best model (Aragón-Noriega et al., 2015; Flinn and Midway, 2021). If the age is in days based on otolith growth increments, the hatch date can be back-calculated from the best model selected, and the spawning season(s) can be derived (Thorrold and Hare, 2002; Chang C.W. et al., 2012) for understanding the spawning periodicity of fishes with a short lifespan (e.g., in a year).
Flyingfishes (Exocoetidae) have ecological, economic, and cultural importance to many coastal countries (Chang S.K. et al., 2012). The species act as intermediaries within the food web between plankton and predators such as dolphinfish, tuna, and swordfish (Zuyev and Nikol’skiy, 1980; Oxenford and Hunte, 1999; Mancini and Bugoni, 2014); support coastal fisheries for bait and food supply (Zerner, 1987; Potts et al., 2003; Blake and Campbell, 2007), e.g., as one of the national cuisines of Barbados (Cumberbatch and Hinds, 2013) and a commercially important harvest in Japan (Masuda et al., 1984); and can represent a cultural emblem for communities (Cumberbatch and Hinds, 2013; Liu and Chang, 2019; Chang, 2020).
There are seven genera and 29 species of flyingfishes found in the Kuroshio Current off Taiwan and adjacent waters (Chang C.W. et al., 2012; Chang S.K. et al., 2012), among the eight genera and 52 species recorded worldwide (Nelson, 2006). The six dominant flyingfishes in the catches are, in the order of amount, spotwing flyingfish (SPW, Cypselurus poecilopterus) 44.7%, limpidwing flyingfish (LPW, Cheilopogon unicolor) 17.9%, margined flyingfish (Cheilopogon cyanopterus) 10.3%, sailfin flyingfish (Parexocoetus brachypterus) 7.7%, bony flyingfish (BNY, Hirundichthys oxycephalus) 7.4%, and greater spotted flyingfish (GSP, Cheilopogon atrisignis) 5.4% (Figure 1). Among the six dominant species, SPW and BNY are locally called “small flyingfish” (general size smaller than 25 cm FL, Chang S.K. et al., 2012) and GSP and LPW are called “large flyingfish” (Figure 2). These four species are the most important to Taiwan because: SPW is the most abundant small flyingfish supporting many coastal fisheries for bait, BNY is the source of an important fish roe fishery in northeastern Taiwan (Chang C.W. et al., 2012; Chang S.K. et al., 2012), GSP is the main fish species supporting the indigenous community (the Yami of Orchid Island) and their flyingfish culture (the Tao culture, Liu and Chang, 2019; Chang, 2020), and LPW is the most abundant large flyingfish supporting many coastal fisheries for food supply.
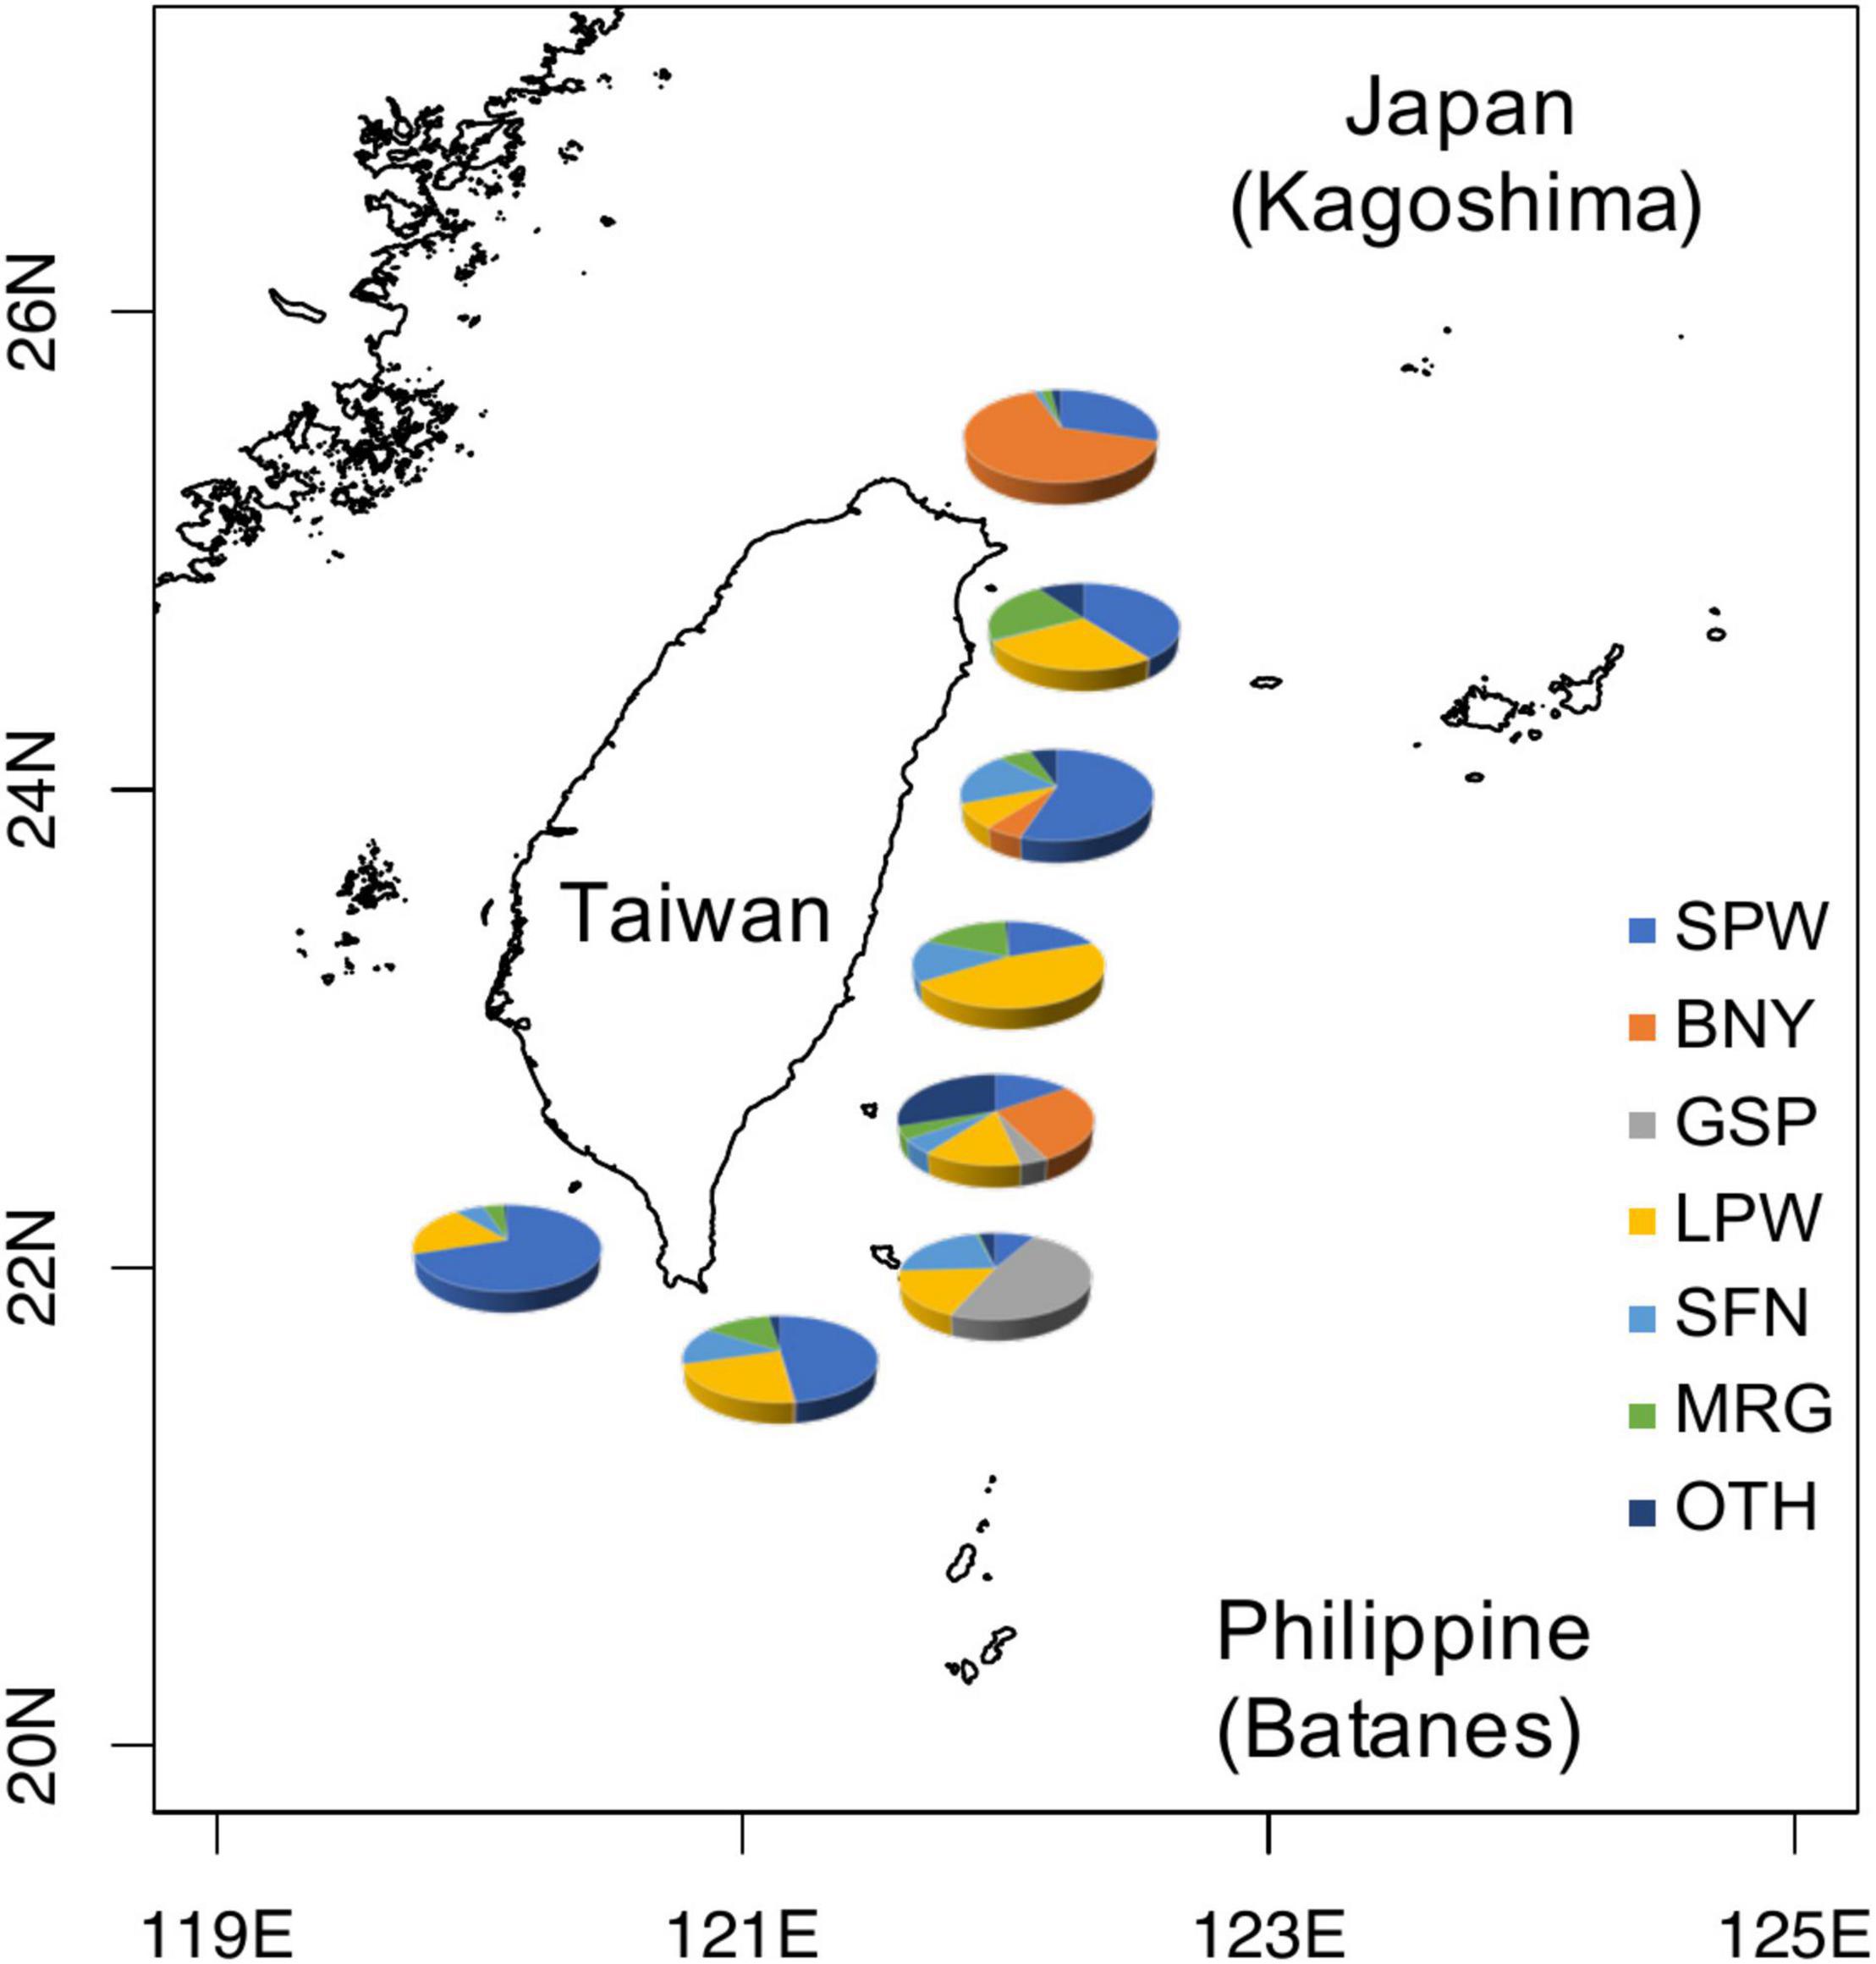
Figure 1. Distribution of major flyingfishes occurring in the Kuroshio Current off eastern Taiwan. SPW, spotwing flyingfish (Cypselurus poecilopterus); BNY, bony flyingfish (Hirundichthys oxycephalus); GSP, greater spotted flyingfish (Cheilopogon atrisignis); LPW, limpidwing flyingfish (Cheilopogon unicolor); SFN, sailfin flyingfish (Parexocoetus brachypterus); MRG, margined flyingfish (Cheilopogon cyanopterus); OTH, other flyingfishes.
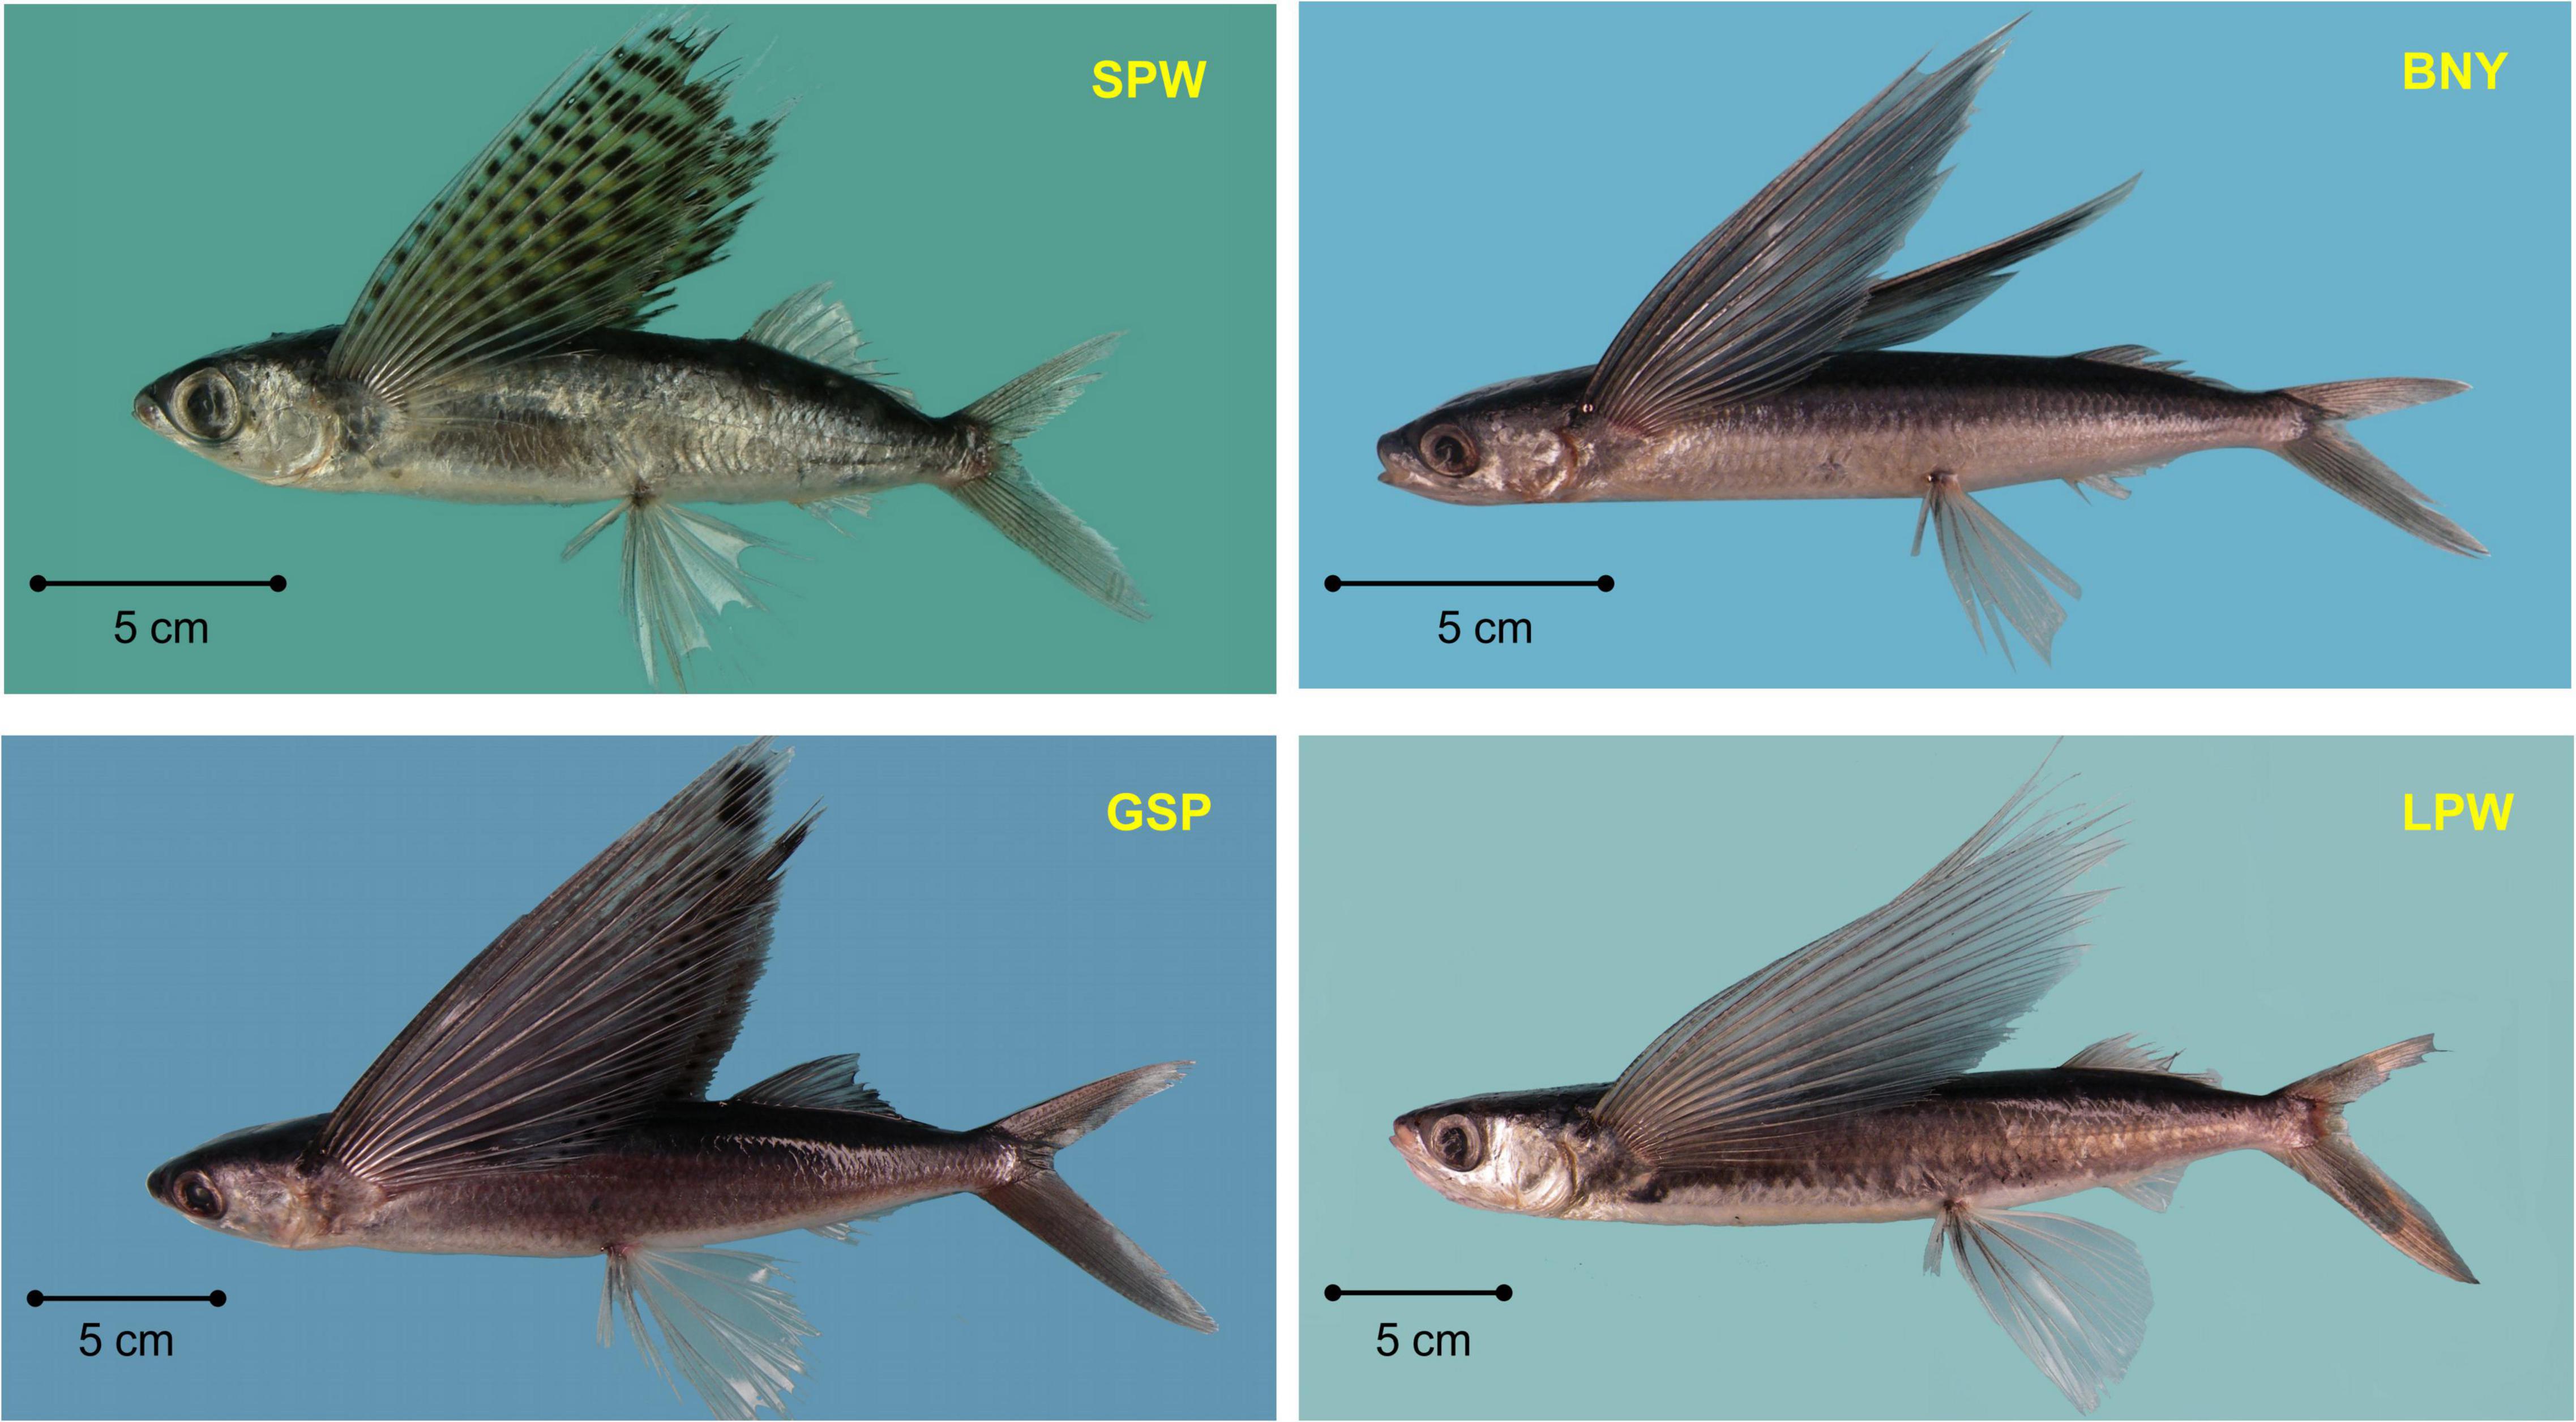
Figure 2. Four important flyingfishes occurred in Taiwan. SPW, spotwing flyingfish (Cypselurus poecilopterus); BNY, bony flyingfish (Hirundichthys oxycephalus); GSP, greater spotted flyingfish (Cheilopogon atrisignis); LPW, limpidwing flyingfish (Cheilopogon unicolor).
This study first estimates the ages of the four flyingfish species using otoliths. Growth models were fit to the age and length data for both combined and separate sexes using a multi-model inference approach, and the best-fit growth model is identified for each species. Key features of the aging methods are also discussed to address the three aging issues identified by Thorrold and Hare (2002). Second, based on the optimal growth models, this study estimates the age of fish from size data collected between 2008 and 2017, and back-calculates hatch date to determine the spawning season of each species. Length-weight relationships (LWR) are also estimated for each species. The study then combines the optimal growth estimates from this study with estimates for all flyingfishes published globally, and statistically classifies the estimates into clusters (groups) by hierarchical cluster analysis (HCA) of logged growth parameters (growth performance index, Pauly and Munro, 1984). We use this approach to explore how the results of this study relate to others using different aging materials and methods, and on different flyingfish species. If all aging methods were equally valid, growth patterns should cluster entirely based on species.
This is the first study to estimate growth parameters of flyingfishes using multiple models. We provide a set of recommendations from the study for aging flyingfishes, including the use of the asterisci otoliths as aging material to reduce the need for complex otolith preparation procedures (e.g., otolith polishing). These recommendations and the supporting computer code for deriving improved growth parameters could help researchers from coastal countries to obtain good quality growth parameters for many flyingfishes.
Materials and Methods
Data Sources
Biological data (fork length in mm, total weight in mg, and sex) and otolith samples of flyingfishes in Kuroshio off Taiwan were collected through the following programs:
(1) Nation-wide port sampling programs in major flyingfish landing ports during 2008–2017, extended from the work described in Chang S.K. et al. (2012). Sampling was conducted on the three major flyingfish fisheries, namely drive-in net, setnet, and gillnet fisheries (see Figure 1 of Chang S.K. et al. (2012) for sampling locations). The sampling programs have different targets by year and, therefore, not all the four species have consistent periods of data and sample collection (Table 1).
(2) At-sea surveys off eastern Taiwan during 2008–2013, also an extension of the work of Chang S.K. et al. (2012). The surveys used gillnets mainly for collecting adult fish for various purposes and dipnets for collecting juvenile fish in the flyingfish-roe fishing grounds.
(3) Hatching experiments in the laboratory of National Sun Yat-sen University for BNY during July–October 2009 and for GSP during June–August 2013.
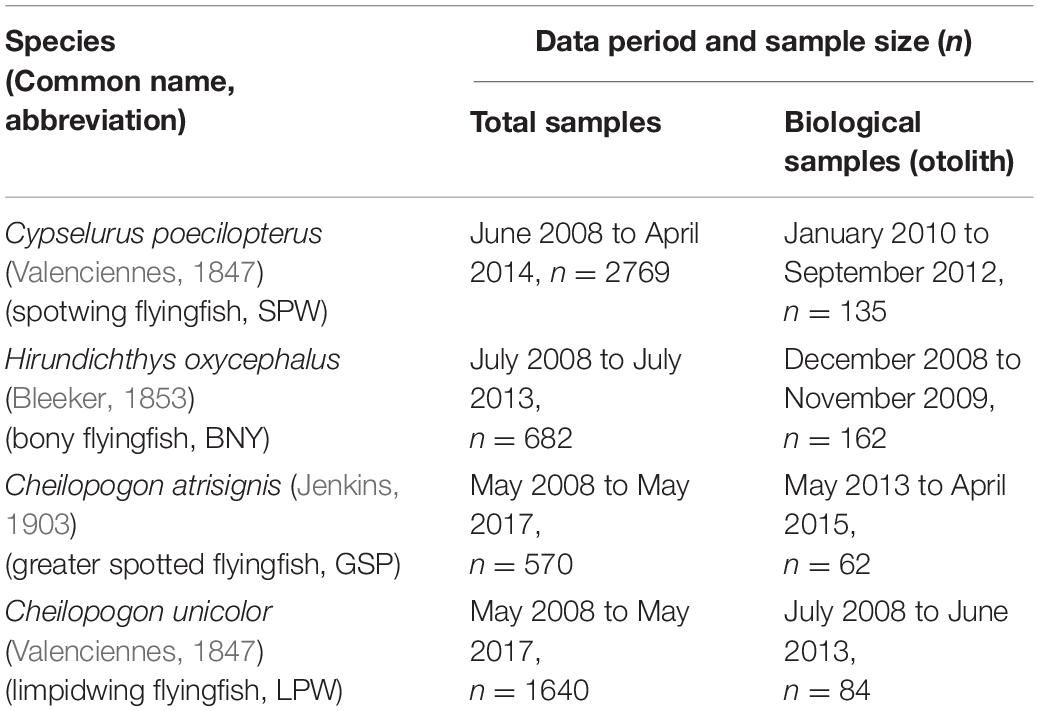
Table 1. Sampling period and sample size for data and otoliths used for the study of length-weight relationship and growth parameter estimation for four flyingfish species.
Otolith Age Data
Otoliths (sagittae, lapilli, and asterisci) were extracted from fish samples selected from the above port sampling programs, at-sea surveys and hatching experiments, with the aim of having samples from as many length classes as possible for both sexes. Both small and large flyingfish occurred in the Kuroshio off Taiwan (Chang S.K. et al., 2012), and prior to spawning have a widespread distribution with sex-specific schools that are difficult to sample. Most samples from port-sampling programs and at-sea surveys were from coastal areas, where flyingfish aggregate to spawn, and were adult fish (Figure 3). Flyingfish from the hatching experiments were all small with sex unknown.
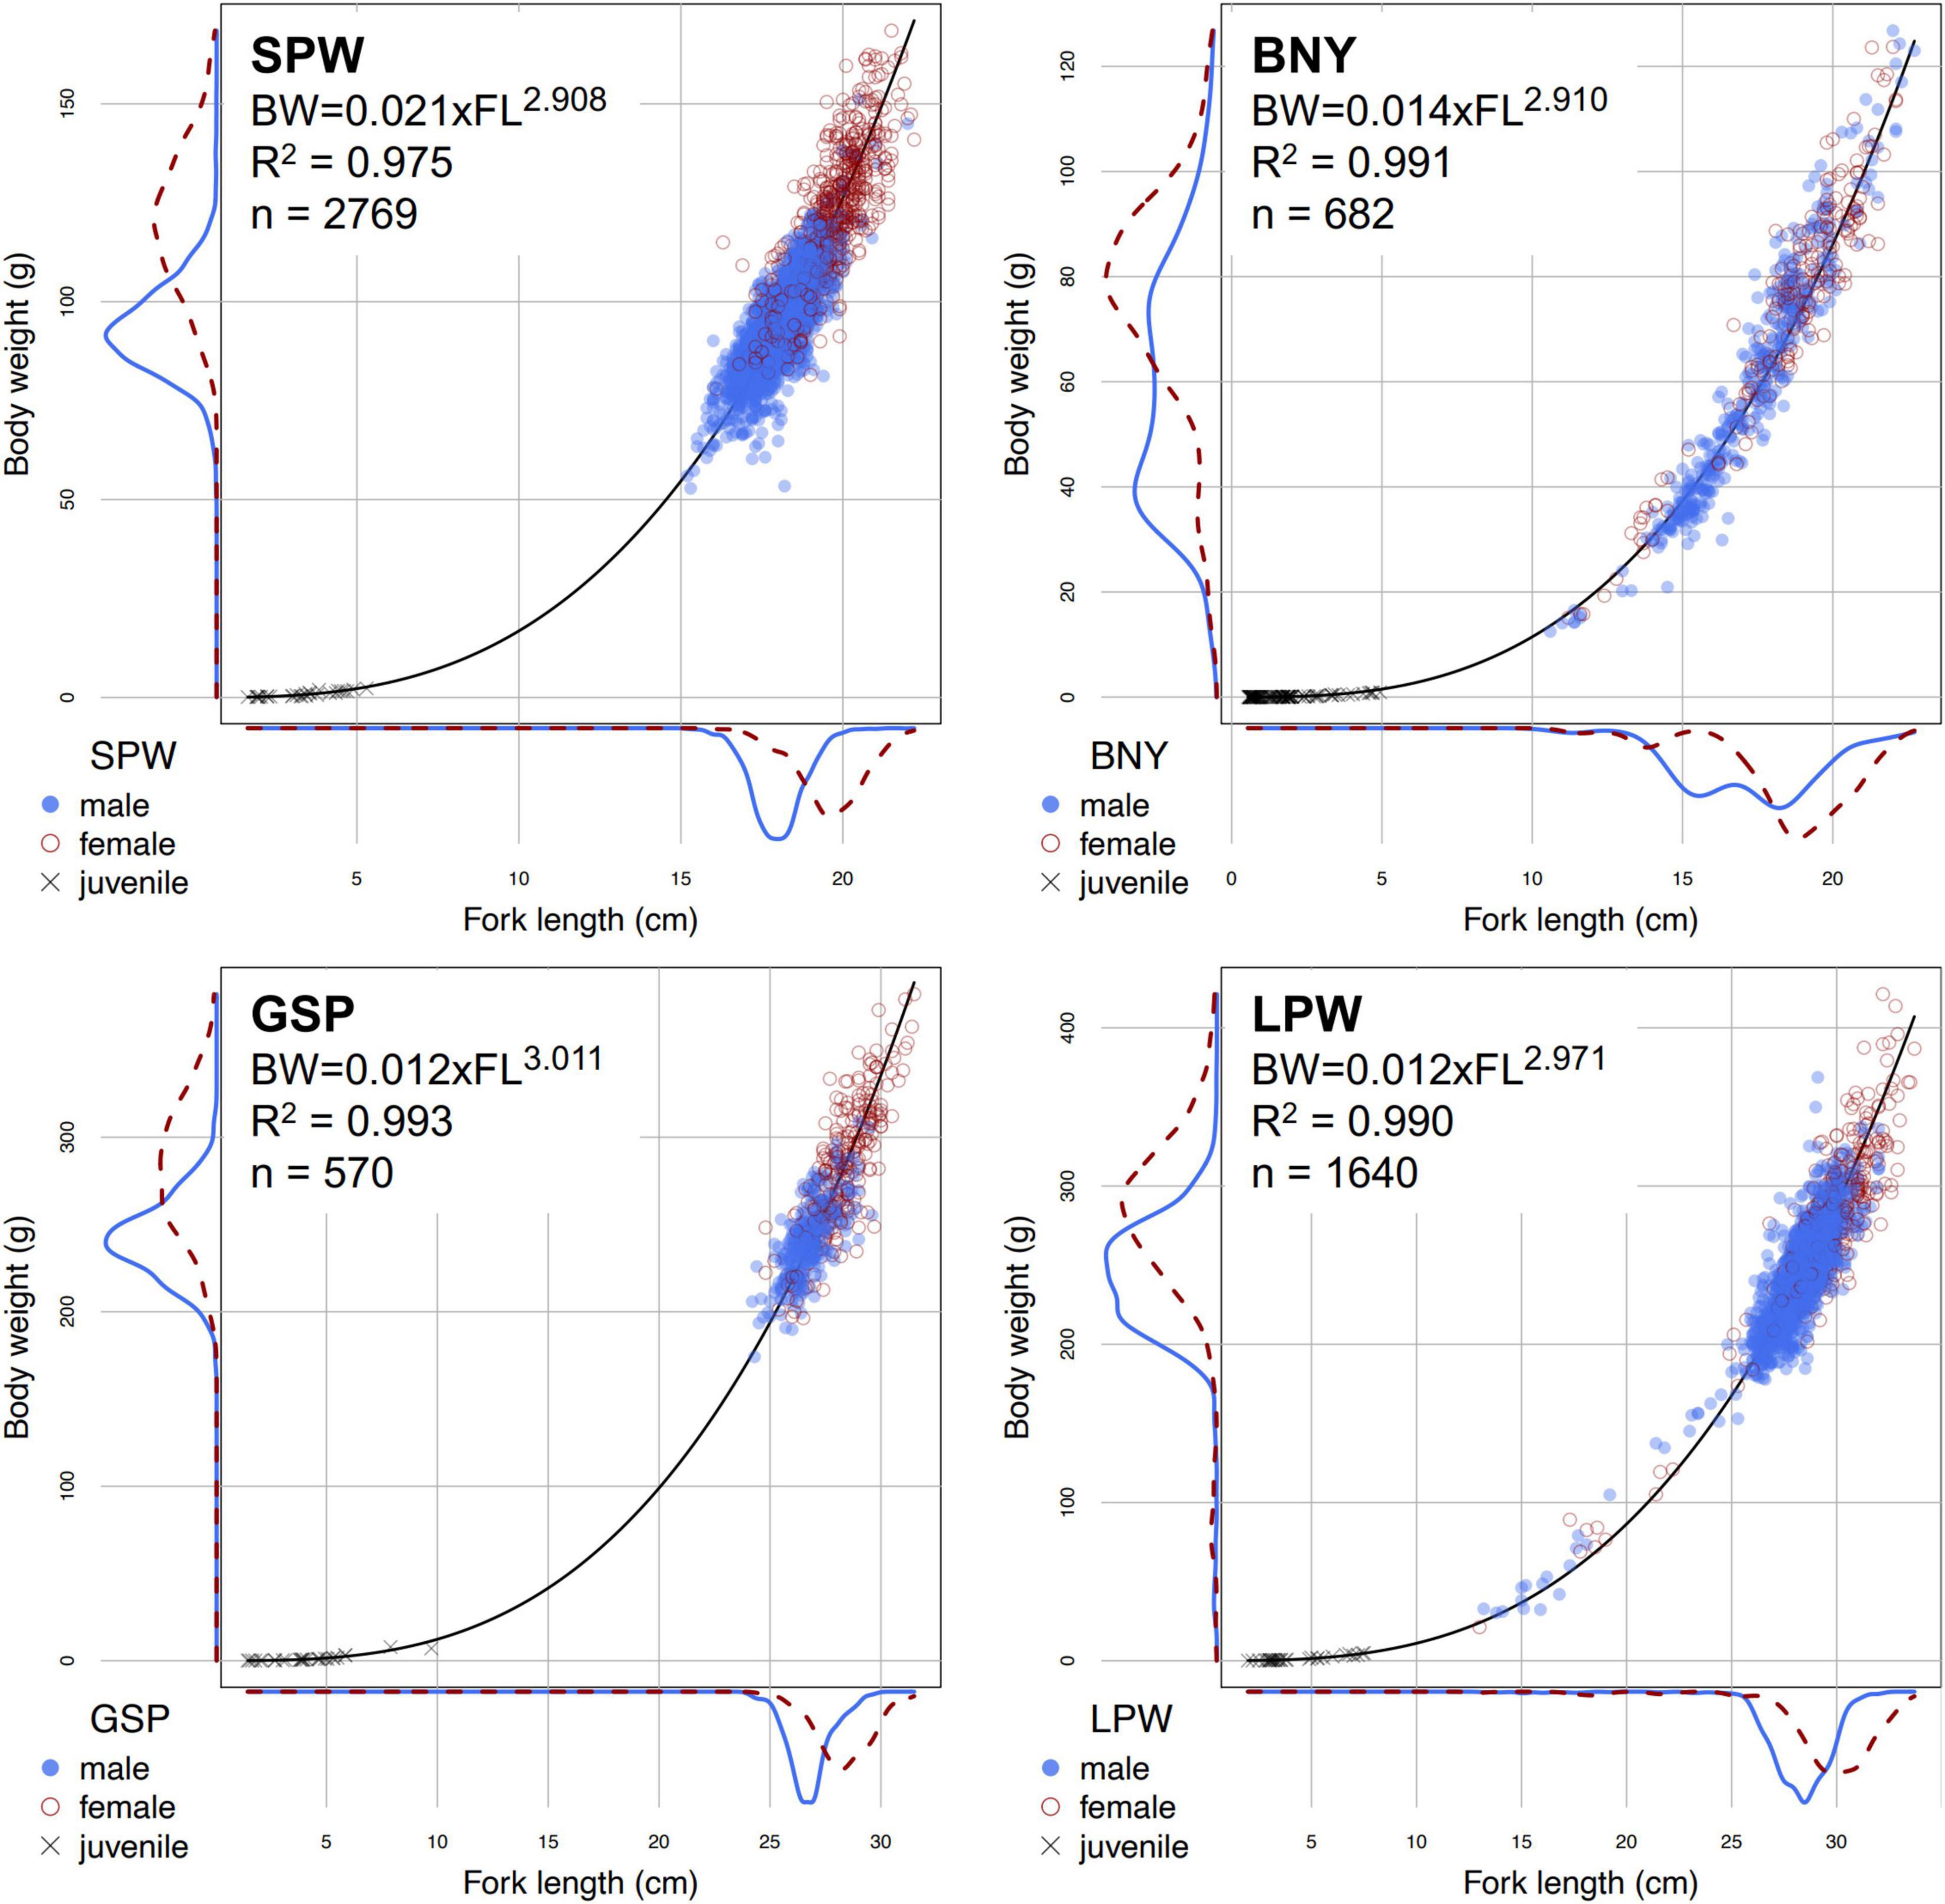
Figure 3. Fork lengths (FL) and total body weights (BW) data, as well as the estimated length-weight equations, of the four major flyingfishes that were used in this study. SPW, spotwing flyingfish; BNY, bony flyingfish; GSP, greater spotted flyingfish; LPW, limpidwing flyingfish. Data were from port sampling and at-sea survey programs, except for juvenile fish samples of BNY and GSP which included data from hatching experiments.
Images of the otoliths from the studied species are shown in Supplementary Figure 1. Otoliths were prepared as described in Chang C.W. et al. (2012). Sagittae, the largest of the three otoliths, are commonly used for estimating fish age (Campana and Neilson, 1985). However, for the four flyingfishes the growth increments of sagittae and lapilli from larger fish tended to be vague and difficult to determine, unless they had been well-polished; whereas growth increments of asterisci were visible for fish of all sizes and could be determined by examining the mounted otolith in whole without polishing (Lin, 2010; Tsai, 2016; Tseng, 2017; Liu, 2019; Figure 4). In addition, asterisci have been demonstrated to have a higher success rate for aging BNY (Chang C.W. et al., 2012). Therefore, this study used asterisci as the aging material.
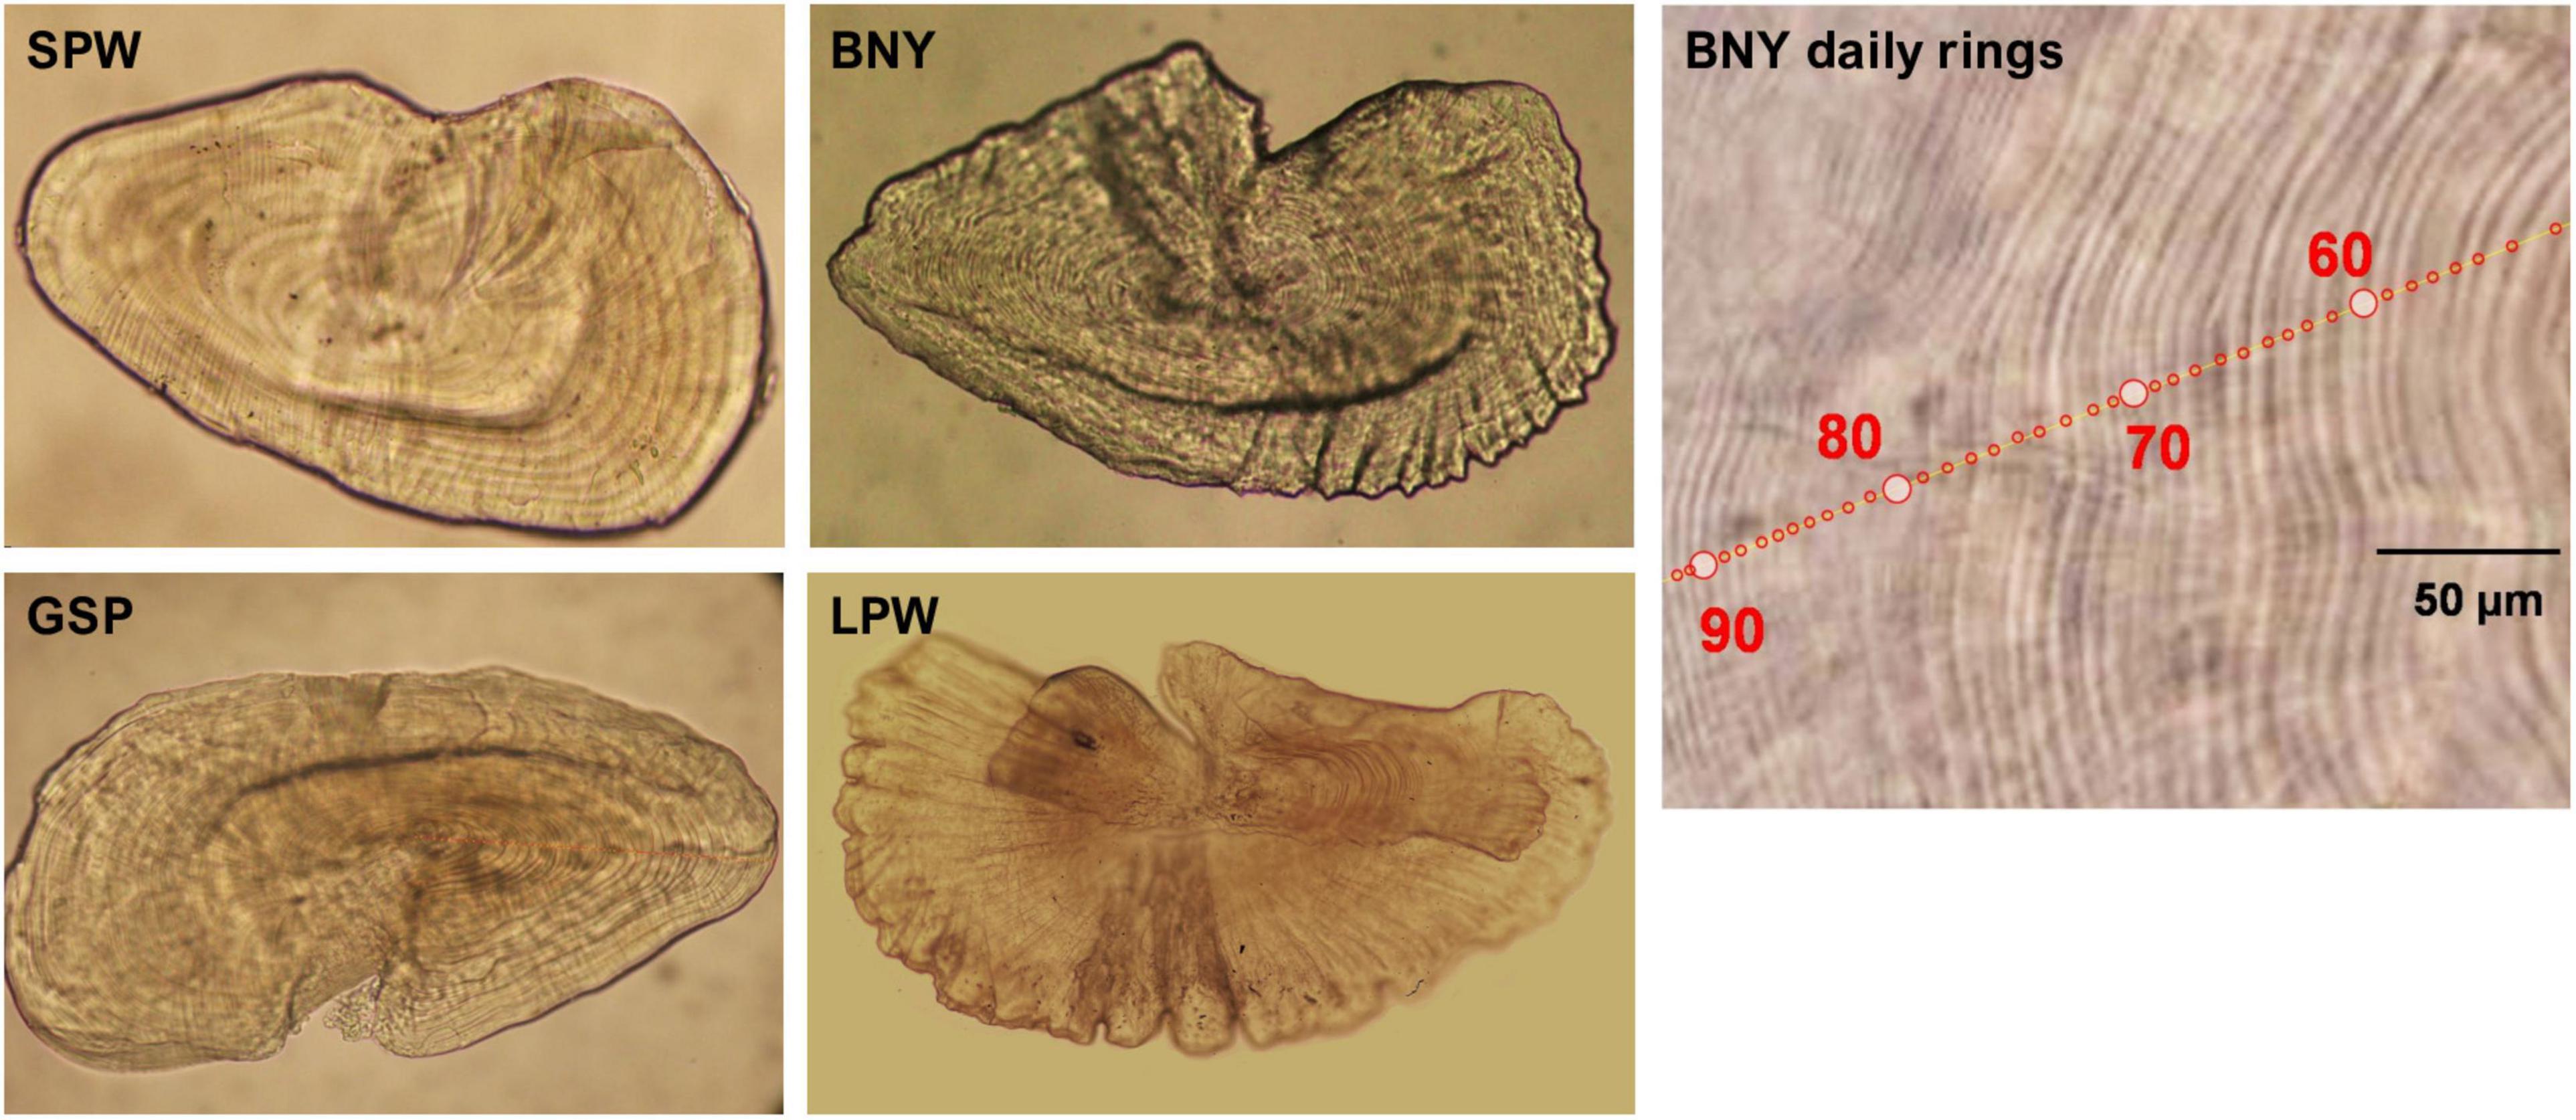
Figure 4. Mounted asteriscus of spotwing flyingfish (SPW, 30.24 mm FL), bony flyingfish (BNY, 54.21 mm FL), greater spotted flyingfish (GSP, 49.32 mm FL), and limpidwing flyingfish (LPW, 286.2 mm FL). “BNY daily rings” is part of the asteriscus of BNY of 155.01 mm FL under a zoom stereomicroscope (SMZ1000, Nikon), with increment counts in red circles.
The deposition rate of micro-increments in otoliths of BNY and GSP have been validated as forming daily in two hatching experiments (Chang C.W. et al., 2012; Tseng, 2017), by comparing the number of daily increments with reared days as a “dated reference” (Campana and Neilson, 1985). The conclusion of daily formation rate could be reasonably applied to the other two species SPW and LPW. Daily increments were counted by at least two otolith readers or three times by the same reader. Average percent errors (Beamish and Fournier, 2011) were used to examine precision. Some of the resultant age data have been used to derive VBGM growth parameters in different years (Lin, 2010; Tsai, 2016; Tseng, 2017; Liu, 2019), using standard growth estimation software FiSAT II (FAO-ICLARM stock Assessment Tools; Gayanilo et al., 2005). The present study reviewed all the age data and re-aged or excluded some of the records determined to be unreliable. For example, the BNY and GSP hatching experiments were reviewed and some samples were excluded due to husbandry problems that reduced confidence in their growth rates. Additional new samples collected were aged and the data sets were combined for conducting multi-model inference analyses to define the optimal growth model for each species. Final numbers of samples included in the growth analysis are shown in Table 1.
Unlike sagittae and lapilli, which could be observed immediately after hatching, asterisci appeared some days (called pre-asteriscus days) later. Therefore, the number of pre-asteriscus days should be estimated and added to the number of daily increments counted from asterisci to represent the fish’s age. The number of pre-asteriscus days can be determined during the hatching experiments, through microradiography study on the otolith (as performed in Chang C.W. et al., 2012). It can also be more systematically estimated by linear analysis of the increments counted from both asterisci and lapilli from the same fish. Since hatching experiments were only for BNY and GSP, the present study examined the counts of asterisci and lapilli of the four species and performed simple linear regressions on the data to determine the expected number of pre-asteriscus days.
Data Analyses
Growth Models
An information theoretic, multi-model inference approach was used to determine the optimal growth model for each of the species (Katsanevakis, 2006; Katsanevakis and Maravelias, 2008). The candidate growth models examined include VBGM and three sigmoidal models: Gompertz, Logistic, and Richards models (Gompertz, 1825; von Bertalanffy, 1938; Richards, 1959; Ricker, 1975). The first three are the most common three-parameter models (Flinn and Midway, 2021) and last is a four-parameter model.
Von Bertalanffy model: Lt = L∞(1−e−k(t−t0))
Gompertz model: Lt = L∞e−e−k(t−t0)
Logistic model: Lt = L∞(1 + e−k(t−t0))−1
Richards model: Lt = L∞(1 + 1/pe−k(t−t0))−p
where Lt is the length (FL in cm) at age t, L∞ is the mean asymptotic length, p is a dimensionless parameter of Richards model, and t0 is the theoretical age when length equals zero for the VBGM or the age at the inflection point of the growth curve for the other models. Parameter k (year–1) is a relative growth rate, describing how quickly the asymptotic length is attained or the rate of exponential decrease of the relative growth rate with age (Katsanevakis, 2006; Quist et al., 2012; Williams et al., 2012). The Richards model is equivalent to the generalized VBGM (Pauly, 1979).
The length-at-age data (combined and sex-specific) were fitted to the four candidate models using non-linear least squares in R version 3.5.1 (R-Development Core Team, 2018). The small-sample, bias-corrected form (AICc) of the AIC (Akaike’s Information Criteria) was used for model selection (Hurvich and Tsai, 1989; Burnham and Anderson, 2002). The model with the smallest AIC value (AICc,min) was selected as the ‘best’ among the models tested. AIC differences Δ = AICc,min – AICc,i were computed over all candidate models i. Models with Δ of 0–2 have substantial support, models with Δ of 4–7 have considerably less support, and models with Δ > 10 has essentially no support (Burnham and Anderson, 2002). The Akaike weight, wi, of each model was then calculated using these differences to quantify the plausibility, given the data and the set of four models, which is considered as the weight of evidence in favor of model i being the best of the available set of models (Burnham and Anderson, 2002; Katsanevakis and Maravelias, 2008).
Estimation of Spawning Season
The spawning date of each fish sampled was back-calculated from the age in days obtained from the otolith plus the number of pre-asteriscus days; as did in Chang C.W. et al. (2012) for BNY, which suggested that the spawning distribution across all the aged fish samples was consistent with the known spawning season from fishery data. Since not all the four studied species had a sufficient timespan of otolith samples during the year to examine spawning periodicity, this study estimates the age of fish from size data collected between 2008 and 2017 using the optimal growth model, and back-calculates hatch date to determine the spawning season of each species.
Estimation of Length-Weight Relationships
The length (L) and weight (W) relationship for each species was estimated using the wild-caught and hatching experiment fish, using a power function of the form W = a × Lb where a is the coefficient of the power function and b is the allometric coefficient. Parameters a and b were estimated with a linear regression of log(W) against log(L). Size distribution and LWR by sex for each species were also examined.
Global Estimate Classification
Growth parameters of various flyingfish species were collected from the literature. Details of the records are provided in Supplementary Table 1, with a summary in Table 2. L∞ reported as total length was converted to fork length based on the equation provided in FishBase (Froese and Pauly, 2019) (see examples provided in Supplementary Table 1). Estimates of k in days were converted to year. All records describe the growth by VBGM with sex combined. Growth parameters were estimated using different methods: based on aging of otoliths (asterisci or lapilli), using length frequency data (LFD), or unknown method. Since we found that the best growth model for each species in this study was VBGM (see section “RESULTS”), growth parameters of VBGM for the four species in this study were compiled into the global estimates table (39 estimates in total) for classification analysis. Record number 39 was from a recently published work but was excluded for the analysis because its estimate was for five flyingfish species combined.
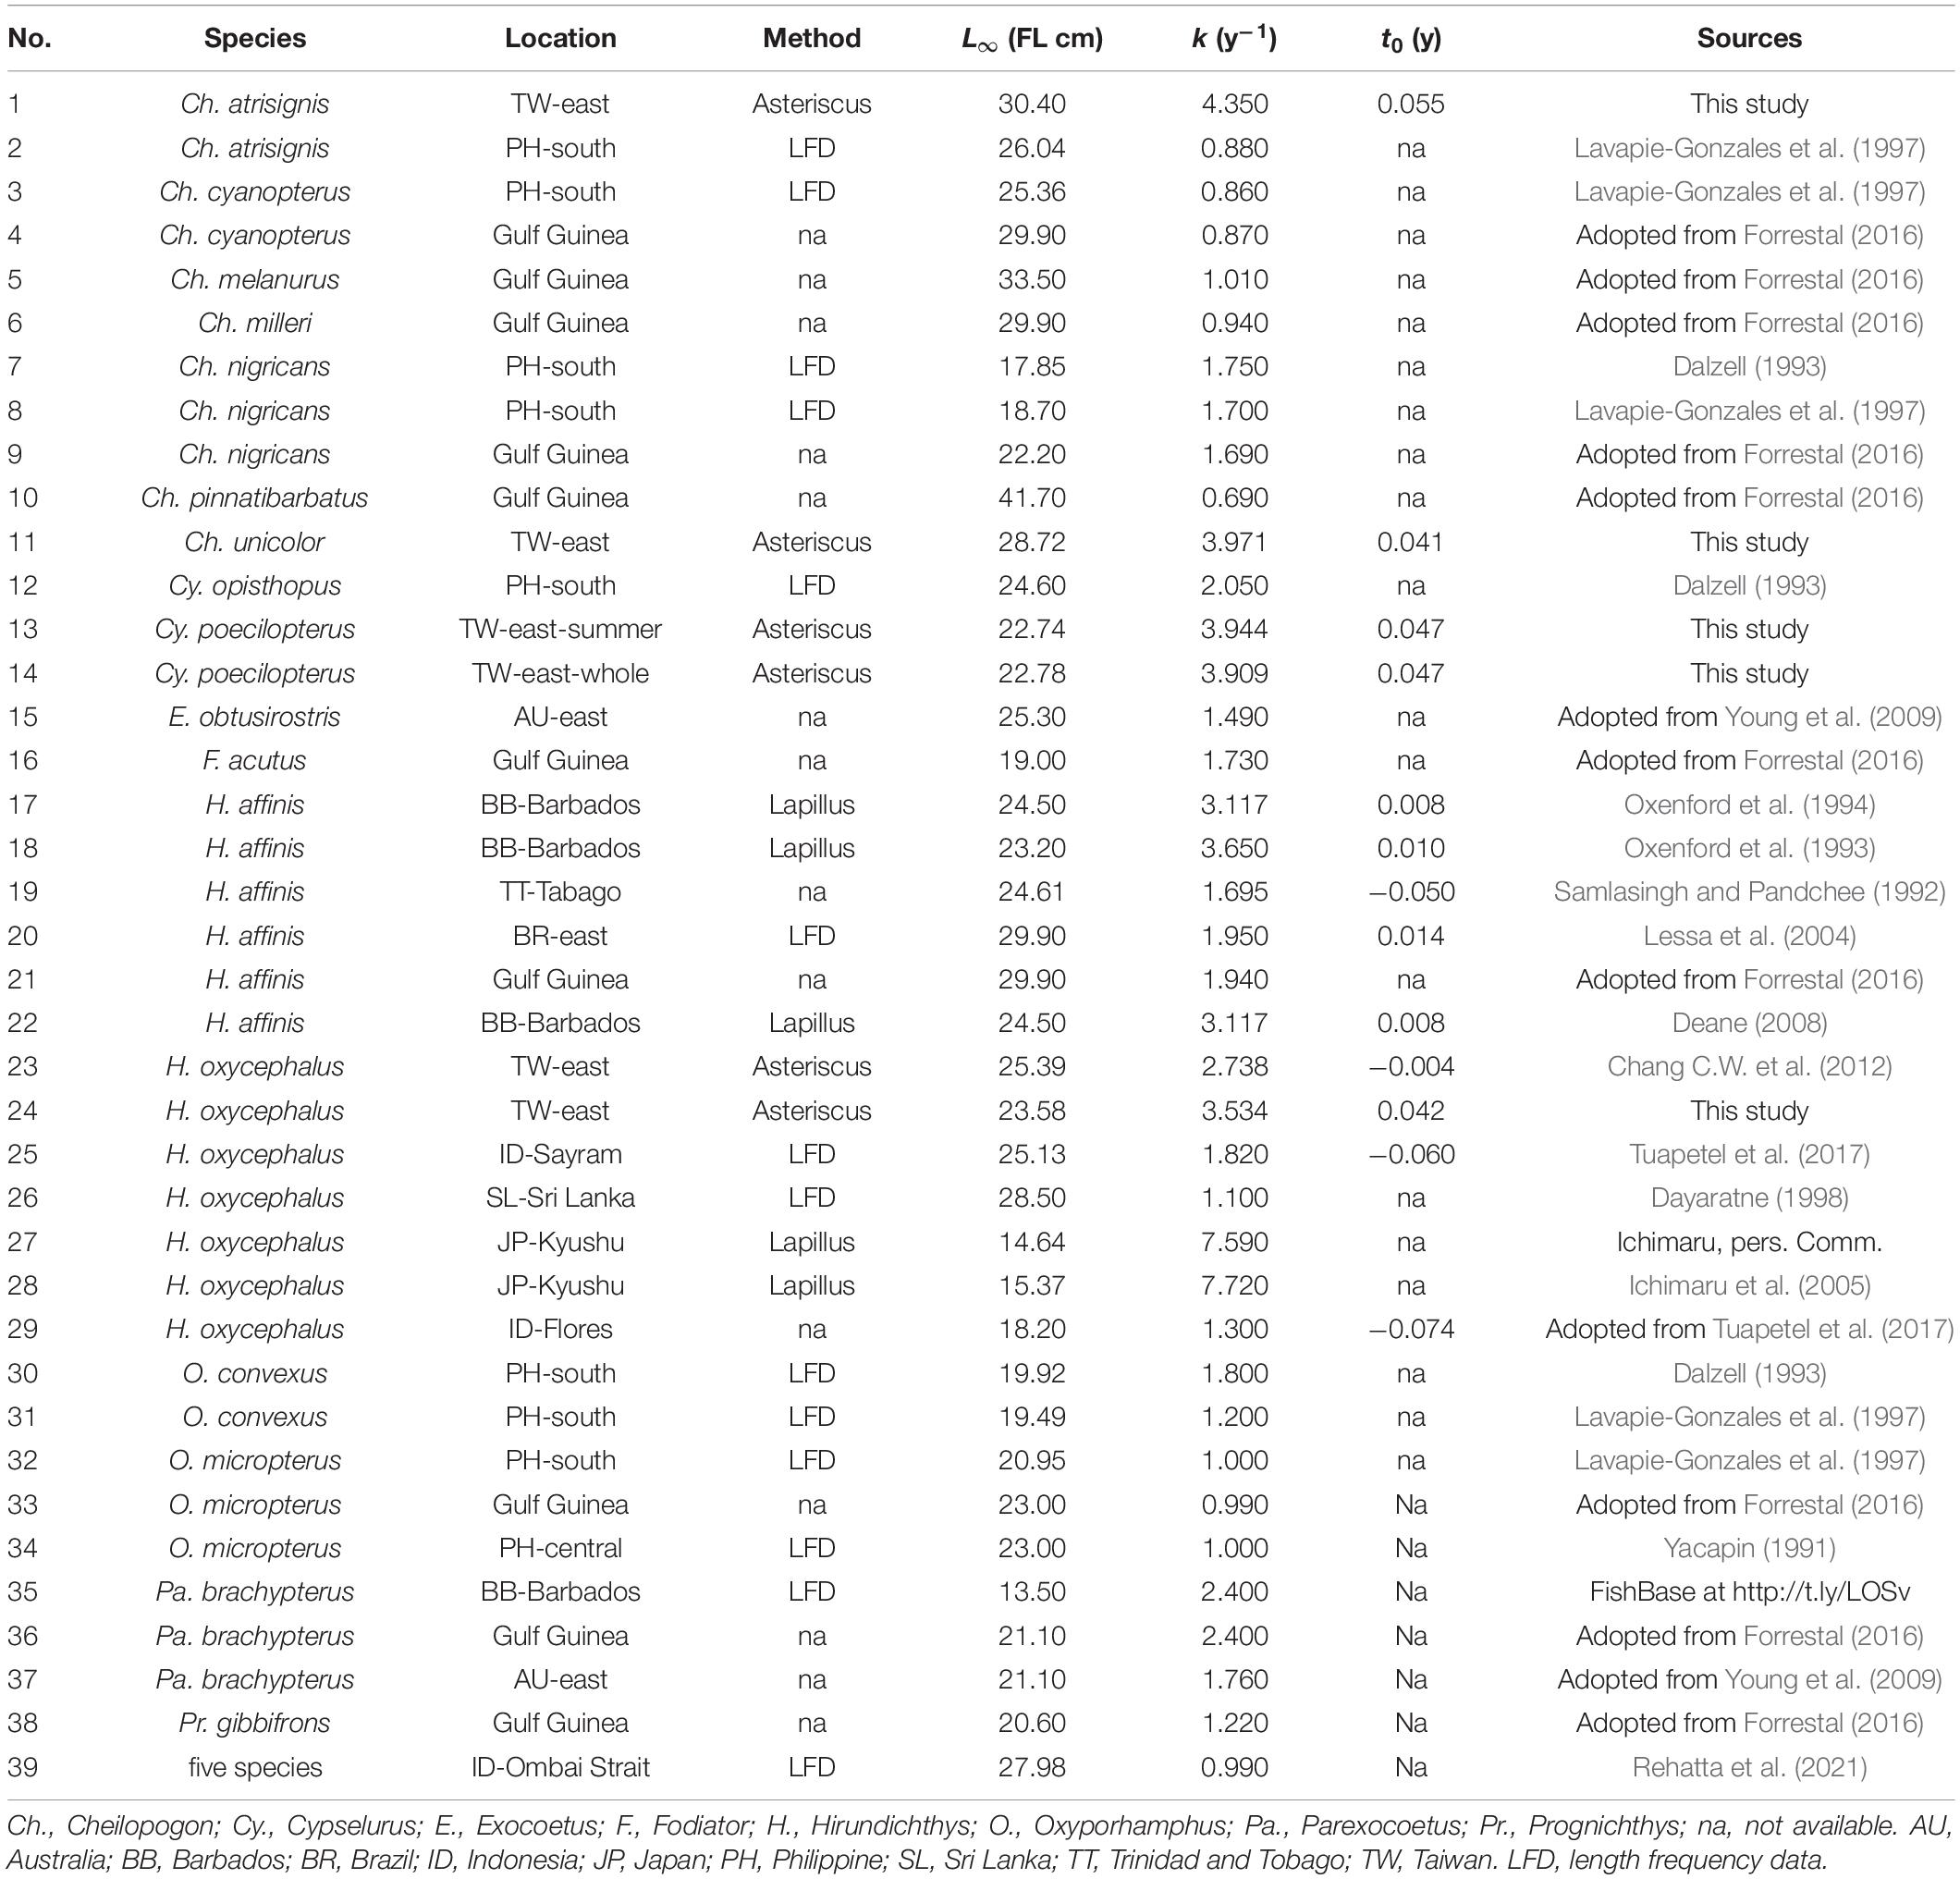
Table 2. Estimates of growth parameters for flyingfishes published globally (in the order of species). Refer to Supplementary Table 1 for detail information.
Pauly and Munro (1984) proposed a growth performance index, ϕ = 2log(L∞) + log(k), which has been applied widely to compare growth parameters of different studies (Sparre and Venema, 1992; Chang and Maunder, 2012; Chang et al., 2013). This study used the two variables of the index log(L∞) and −log(k) to identify clusters of growth estimates from the global summary using HCA (Boehmke and Greenwell, 2019). Data were prepared as a Minkowski distance matrix, and clustered using Ward’s (1963) method. HCA produces hierarchical clustering by starting with each point as a singleton cluster and then repeatedly merging the two closest clusters until a single, all-encompassing cluster remains (Tan et al., 2006). The number of clusters was decided by the “elbow method” (Kassambara, 2017).
Results
Growth Parameter Estimation
The number of daily growth increments counted from the blind readings of the asterisci and lapilli were highly correlated with slopes close to 1 and R2 > 0.99 for all four species (Figure 5). The intercepts of the linear relationships suggested that the numbers of pre-asteriscus days were about 11 days for small flyingfishes (SPW and BNY) and about 12 days for large flyingfishes (GSP and LPW). The pre-asteriscus days were added to the number of increments counted from the asteriscus and converted to age in years.
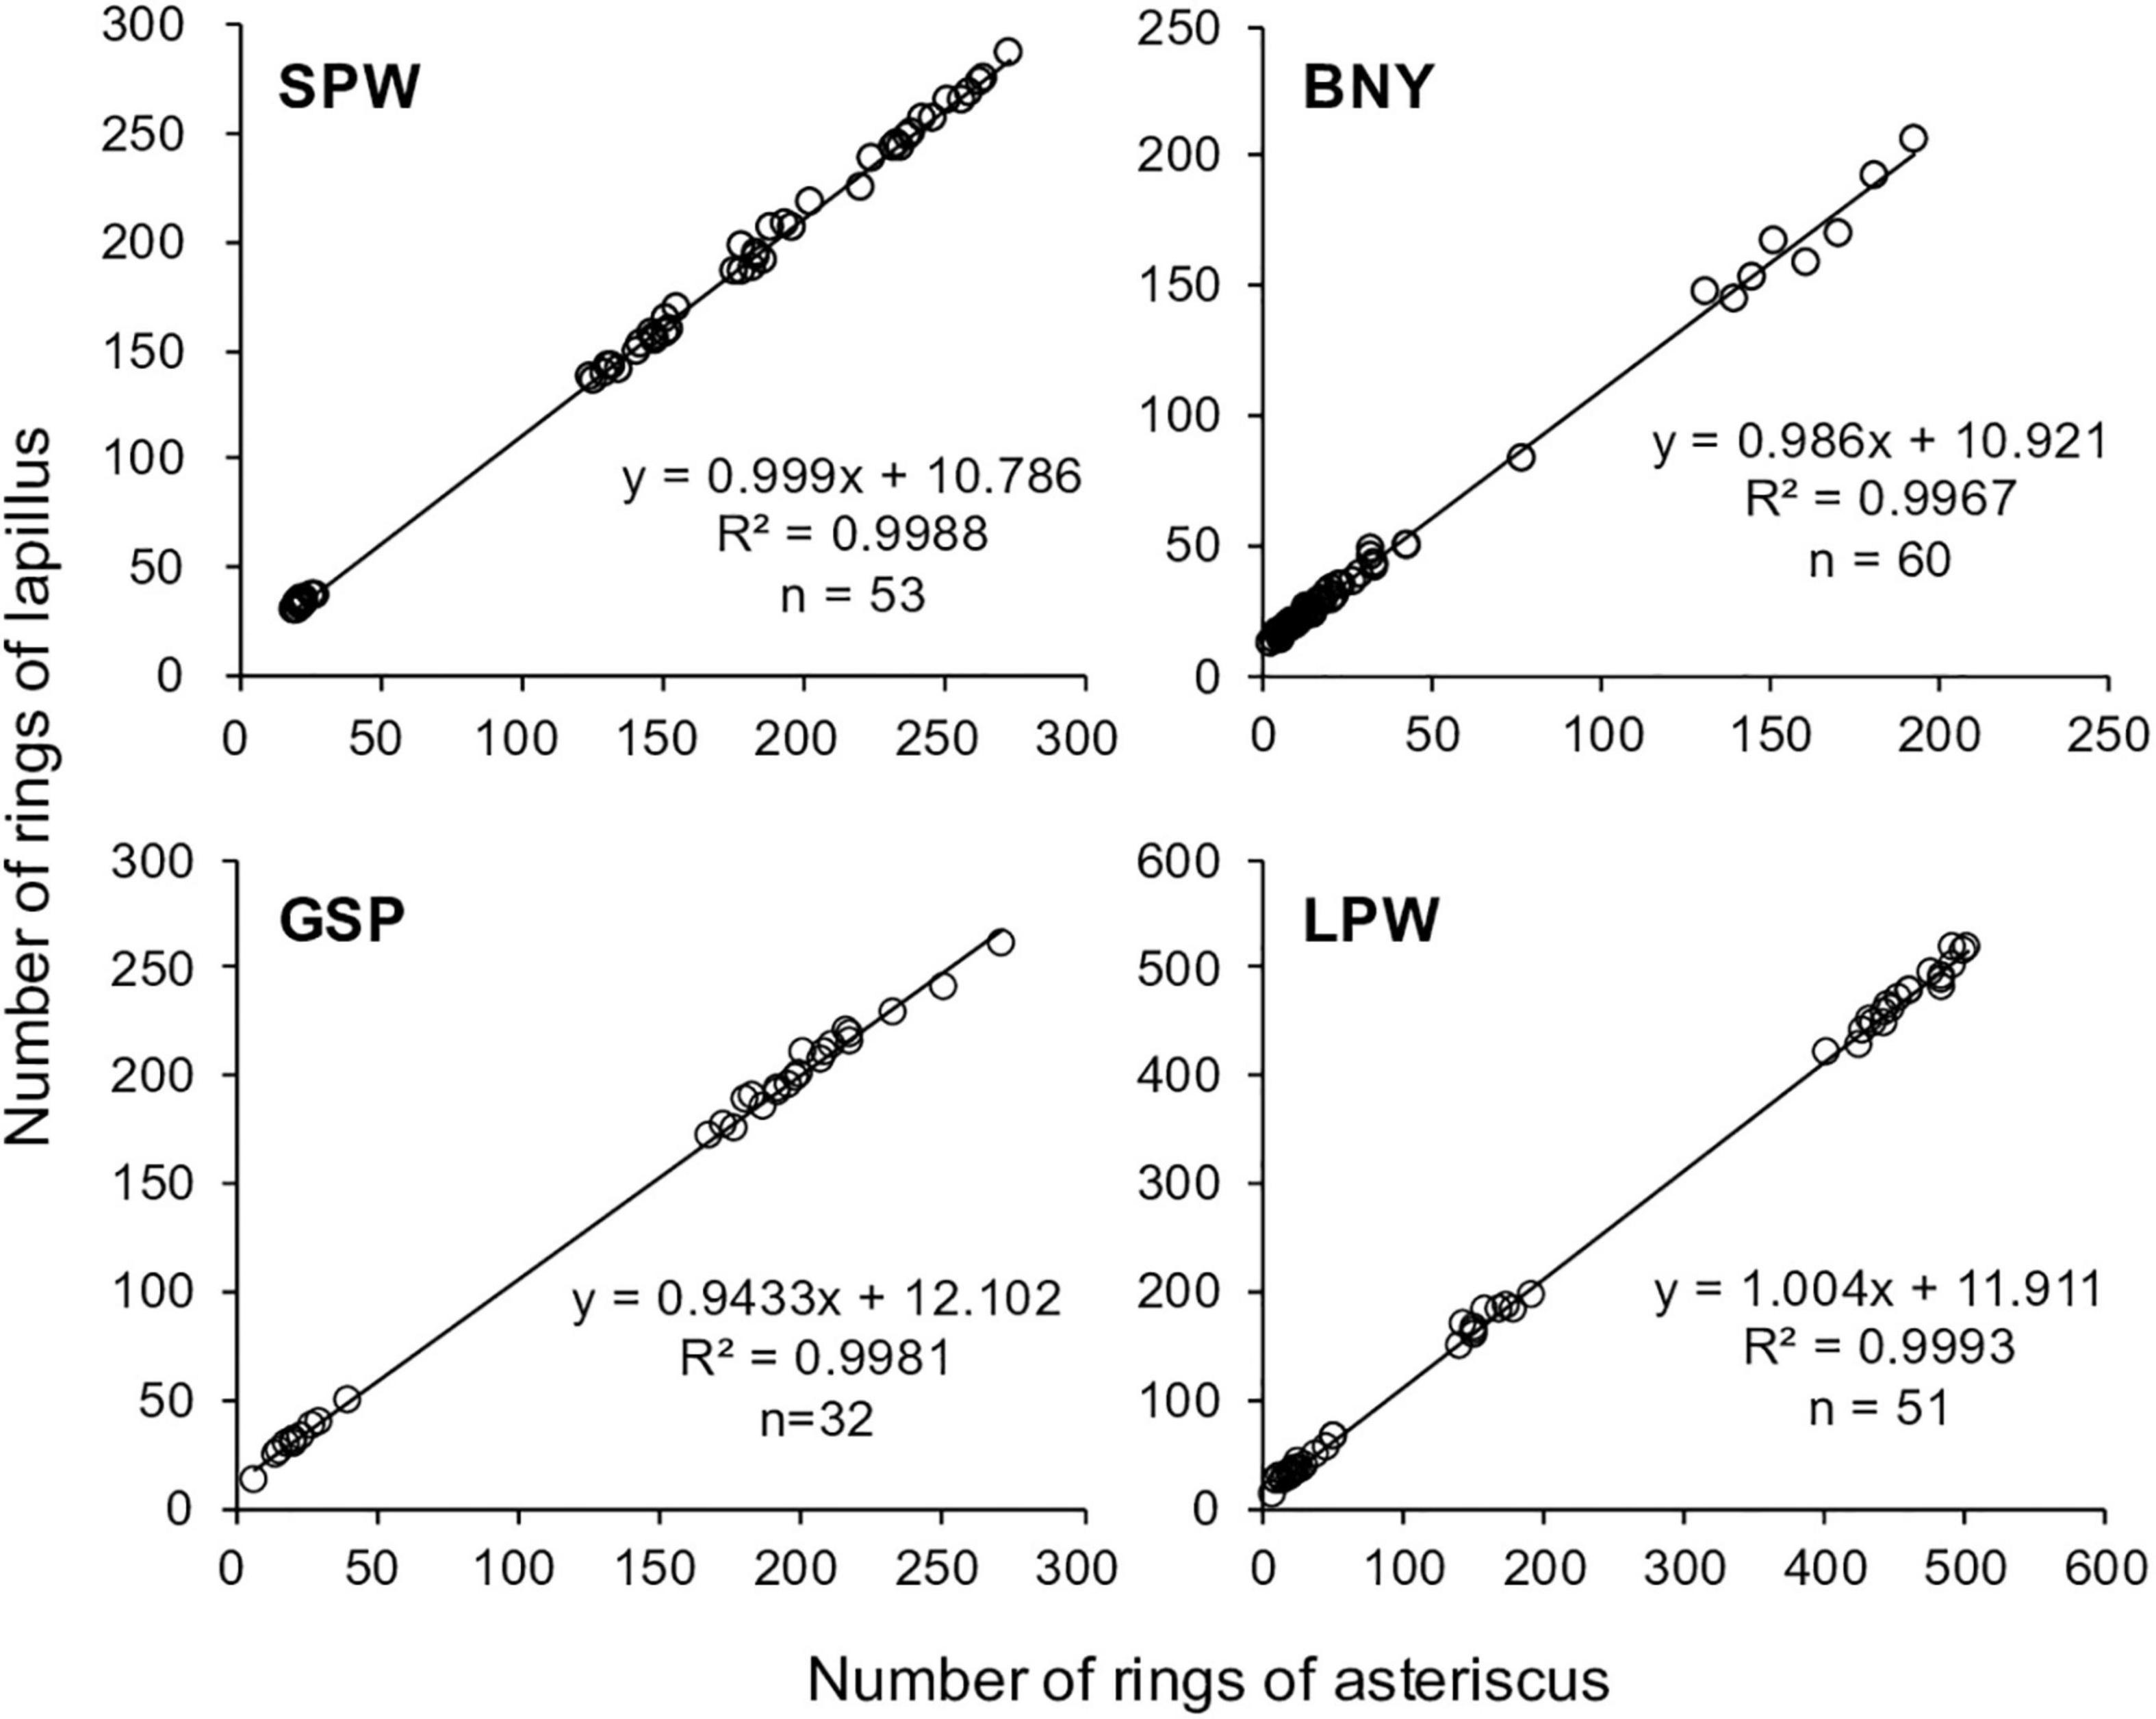
Figure 5. Number of rings read from both the asteriscus and lapillus and the linear relationship between the two numbers, for spotwing flyingfish (SPW), bony flyingfish (BNY), greater spotted flyingfish (GSP), and limpidwing flyingfish (LPW).
Growth models fit to the length and age data for each species (Figure 6 and Table 3) show that the VBGM was the best model with AICc differences Δ < 2 (indicating substantial support as the best model) (Katsanevakis and Maravelias, 2008) and Akaike weight w (the expected weight of evidence in favor of the model being the best among the four models) of over 90% for small flyingfishes SPW and BNY and 56–78% for large flyingfishes GSP and LPW.
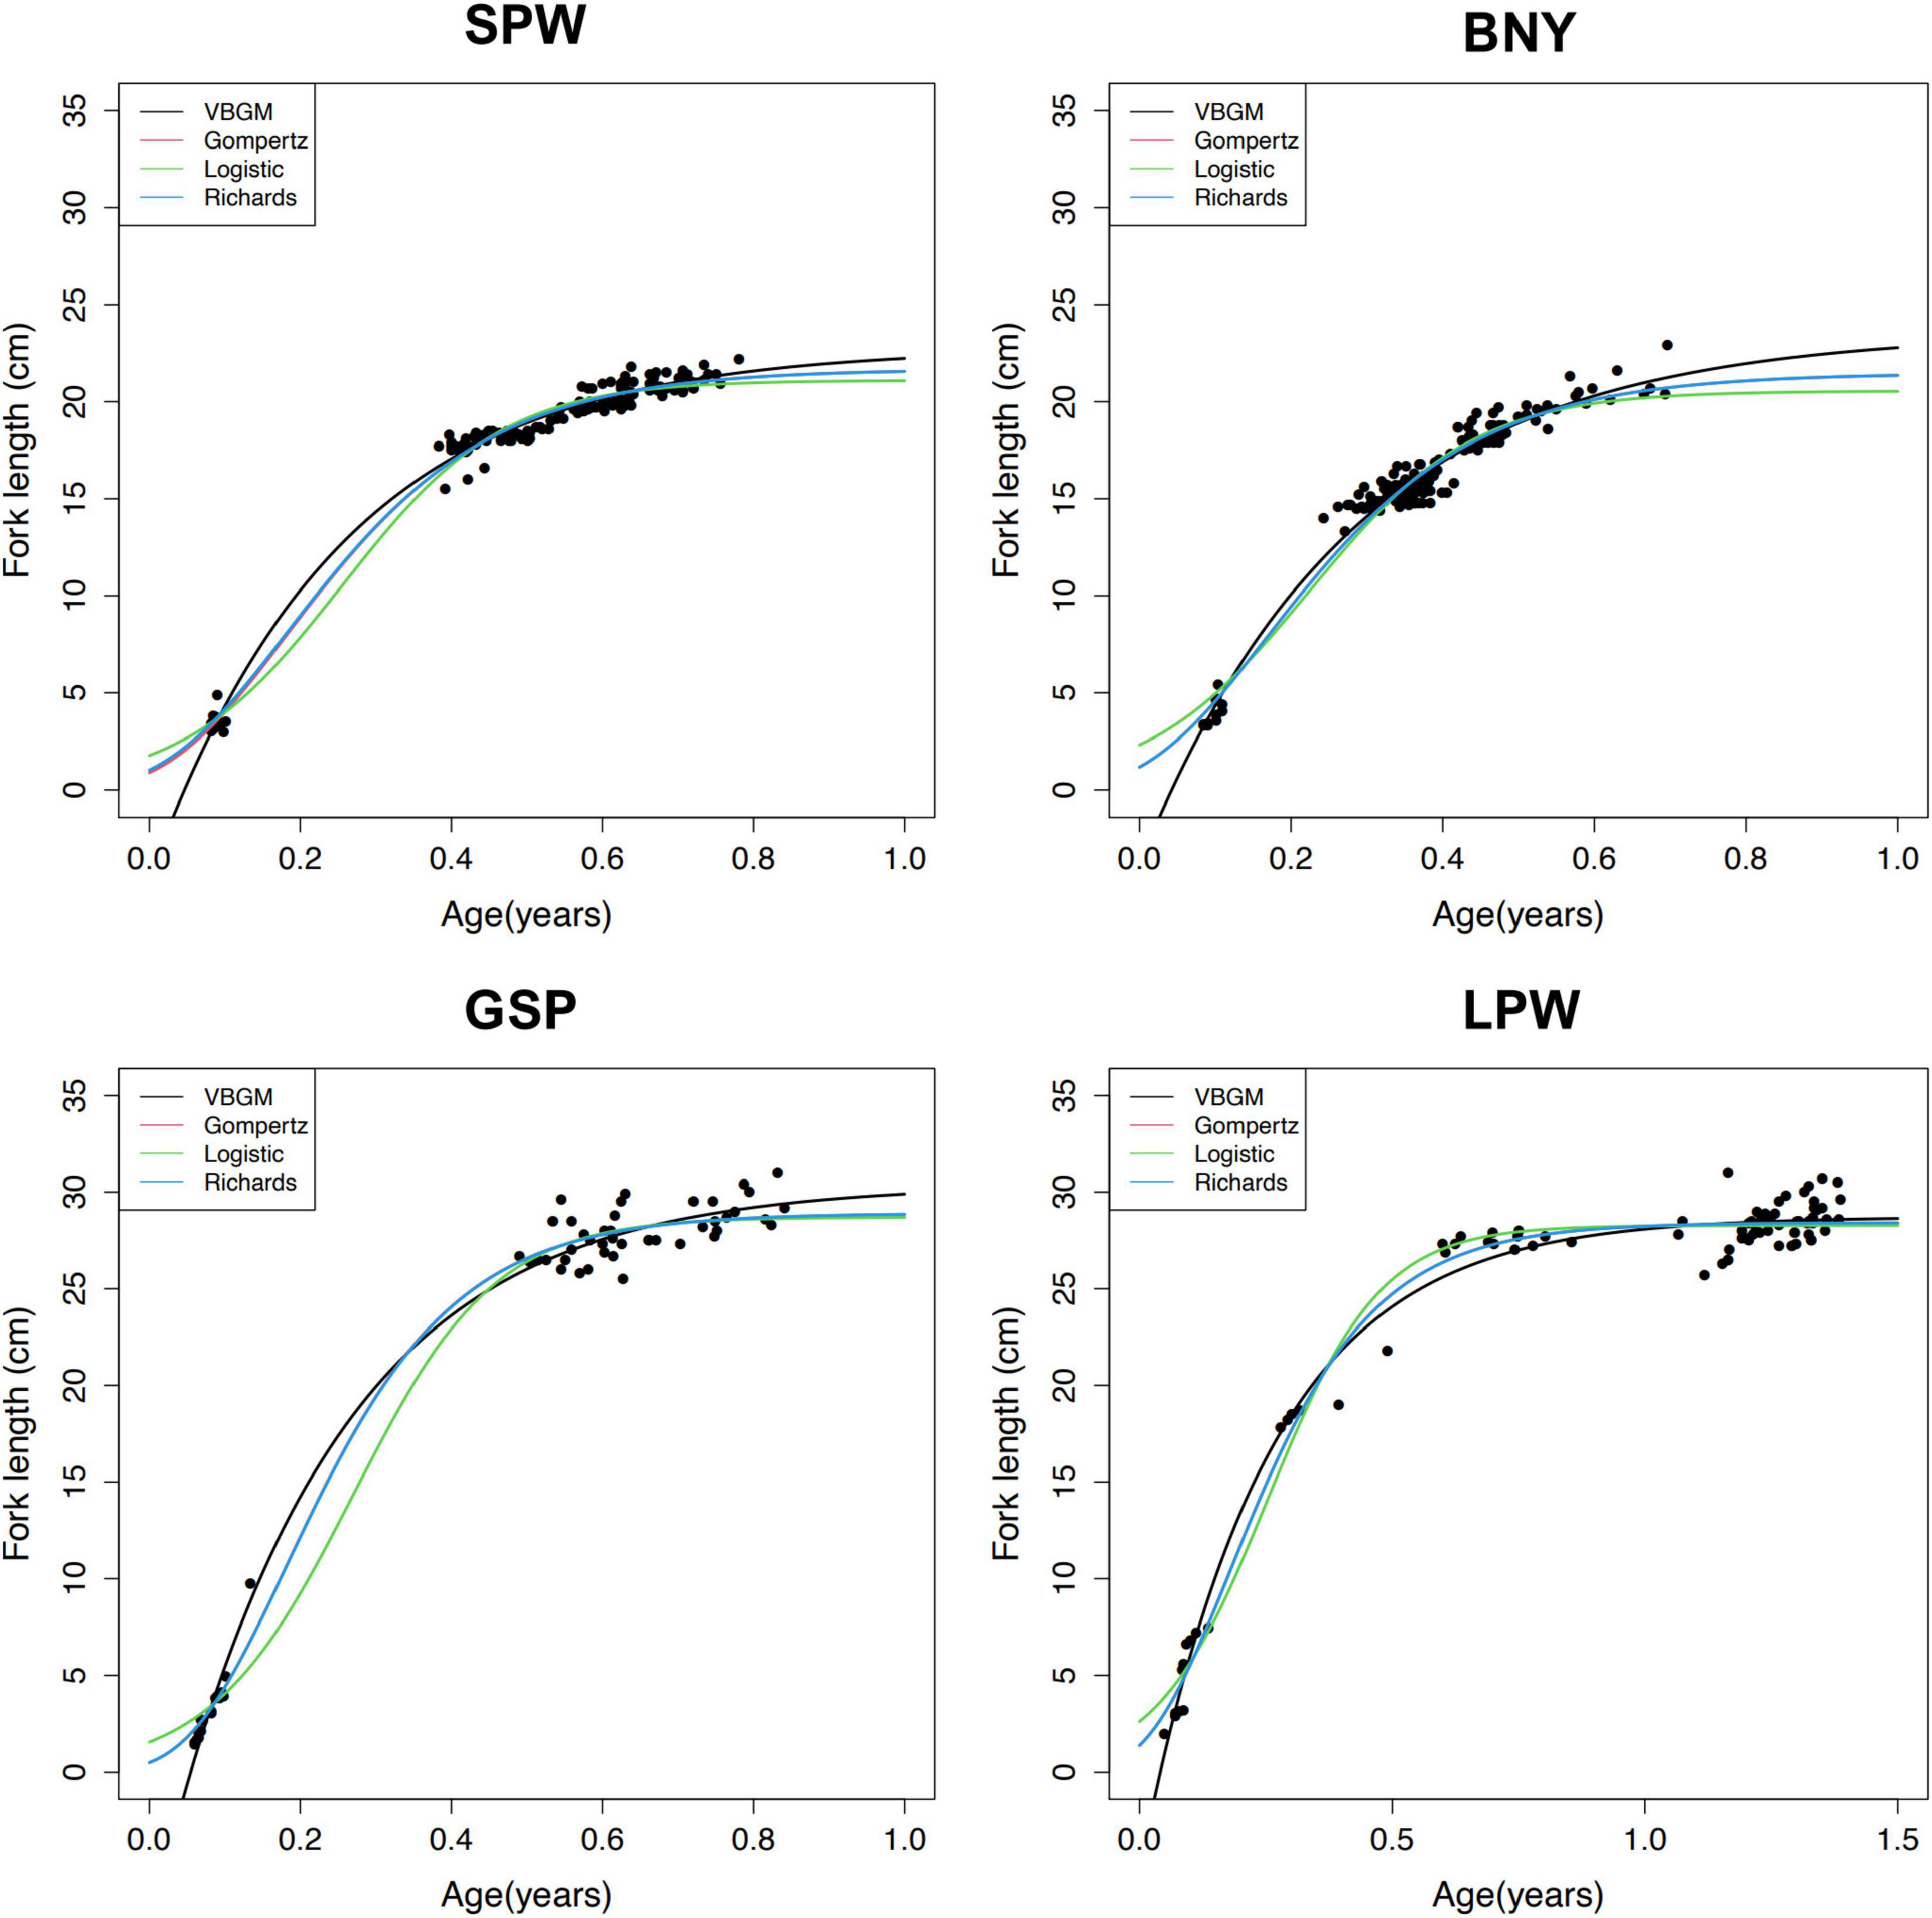
Figure 6. Age and length and fitted growth curves for spotwing flyingfish (SPW), bony flyingfish (BNY), greater spotted flyingfish (GSP), and limpidwing flyingfish (LPW).
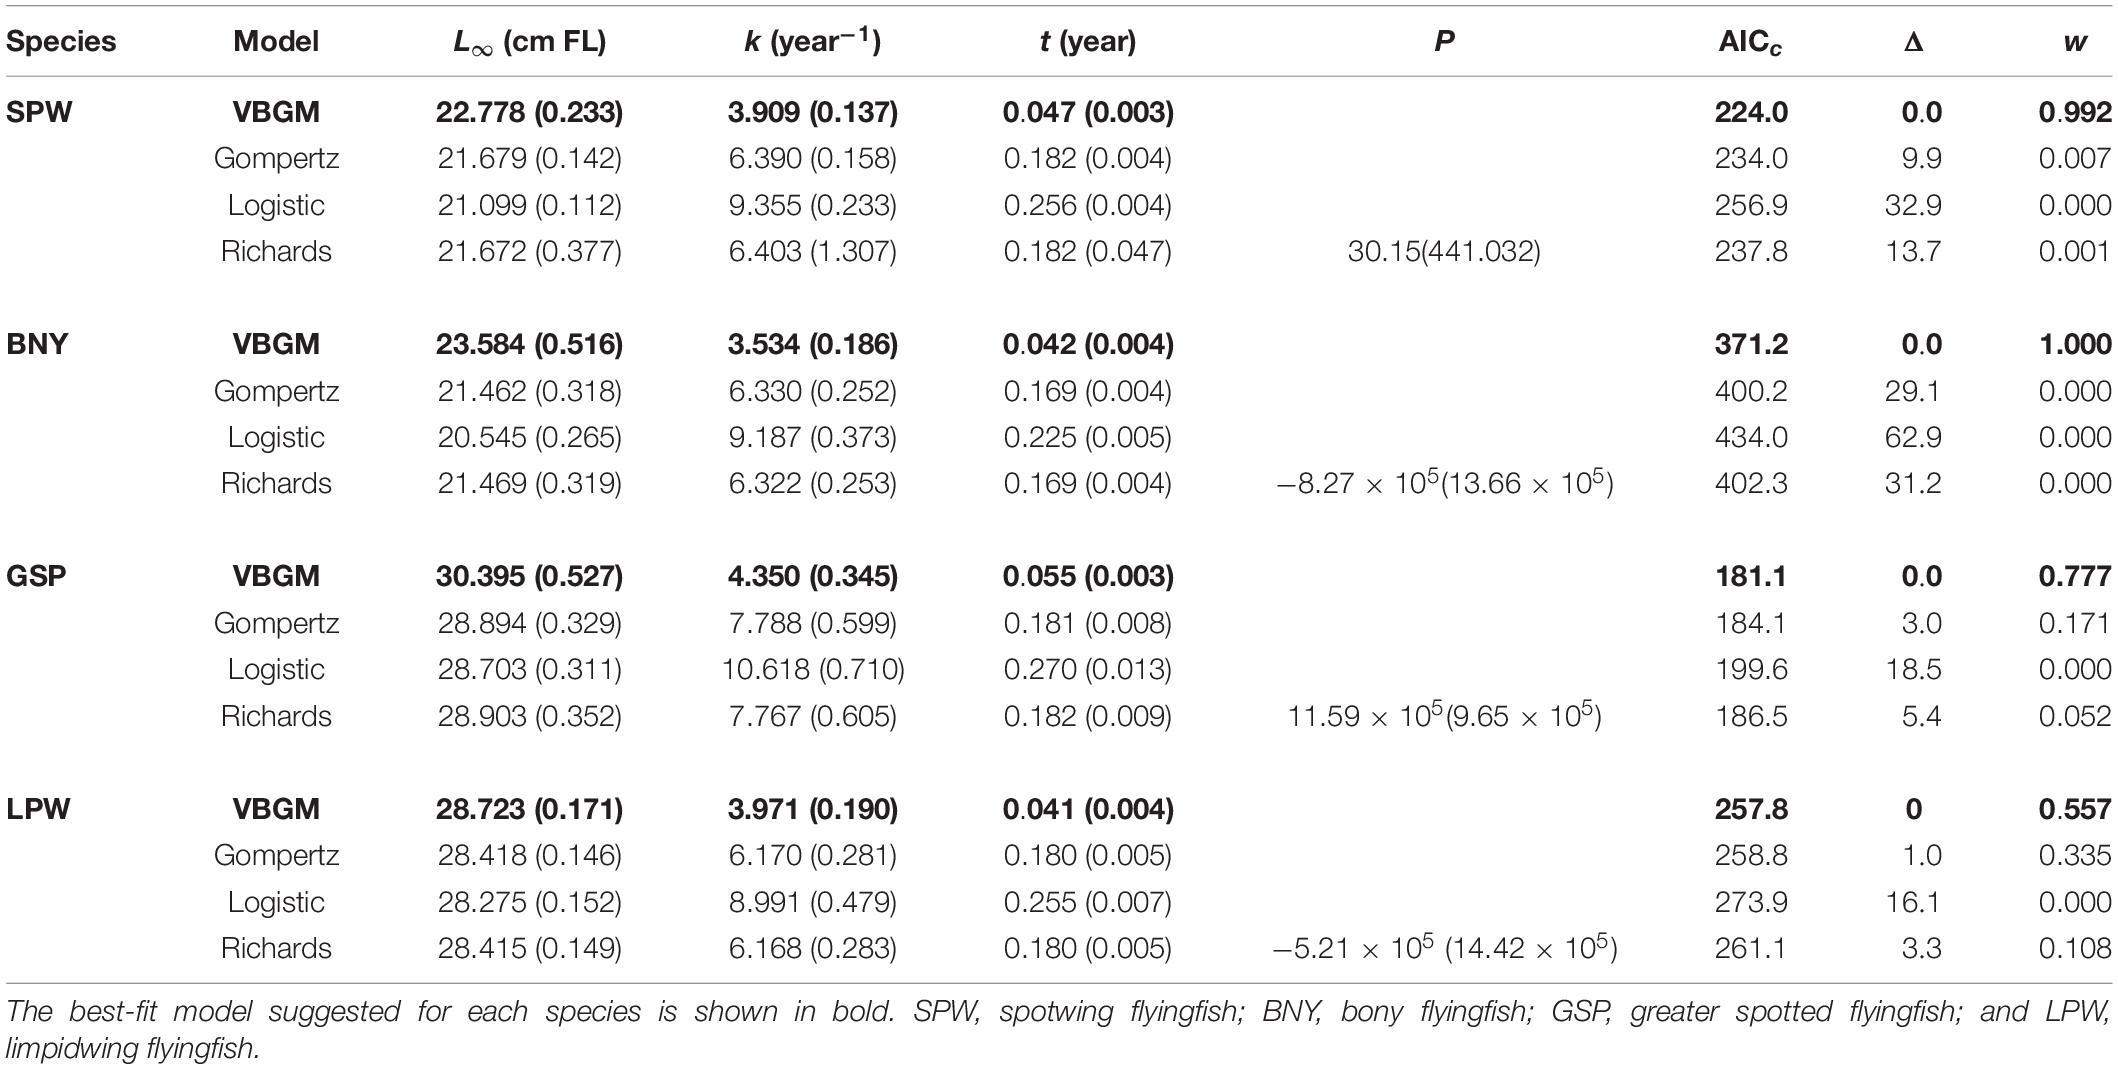
Table 3. Parameter estimates (± standard error) from four candidate growth models for the four dominate flyingfishes off Taiwan (sex combined).
The size distributions of adult fish showed clear differences between males and females: female fish tended to be larger for all species (Figure 3). Growth models fit to the length and age data by sex (Table 4) show that only three of the model runs favored the VBGM. Of the rest, three favored the Gompertz model and both sexes of GSP favored the logistic model. The values of AICc for females and males of the sex-specific runs (Table 4) could not be summed to compare directly with the sex-combined run (Table 3) of the same model and the same species to decide which is better supported by the data, as did in Williams et al. (2012). This is because data for both sexes of the sex-specific model included the same juvenile fish data, while the sex-combined model included only one set (thus, sample sizes were different). In this regard, we halved the likelihood contributions of the small fish data to each individual sex model for comparison with the sex-combined run. The results showed that the AICc of sex-combined runs of VBGM were 2–16% higher than those of sex-specific runs of the same model and the same species, suggesting that sex-specific models were better supported by the length-at-age data.
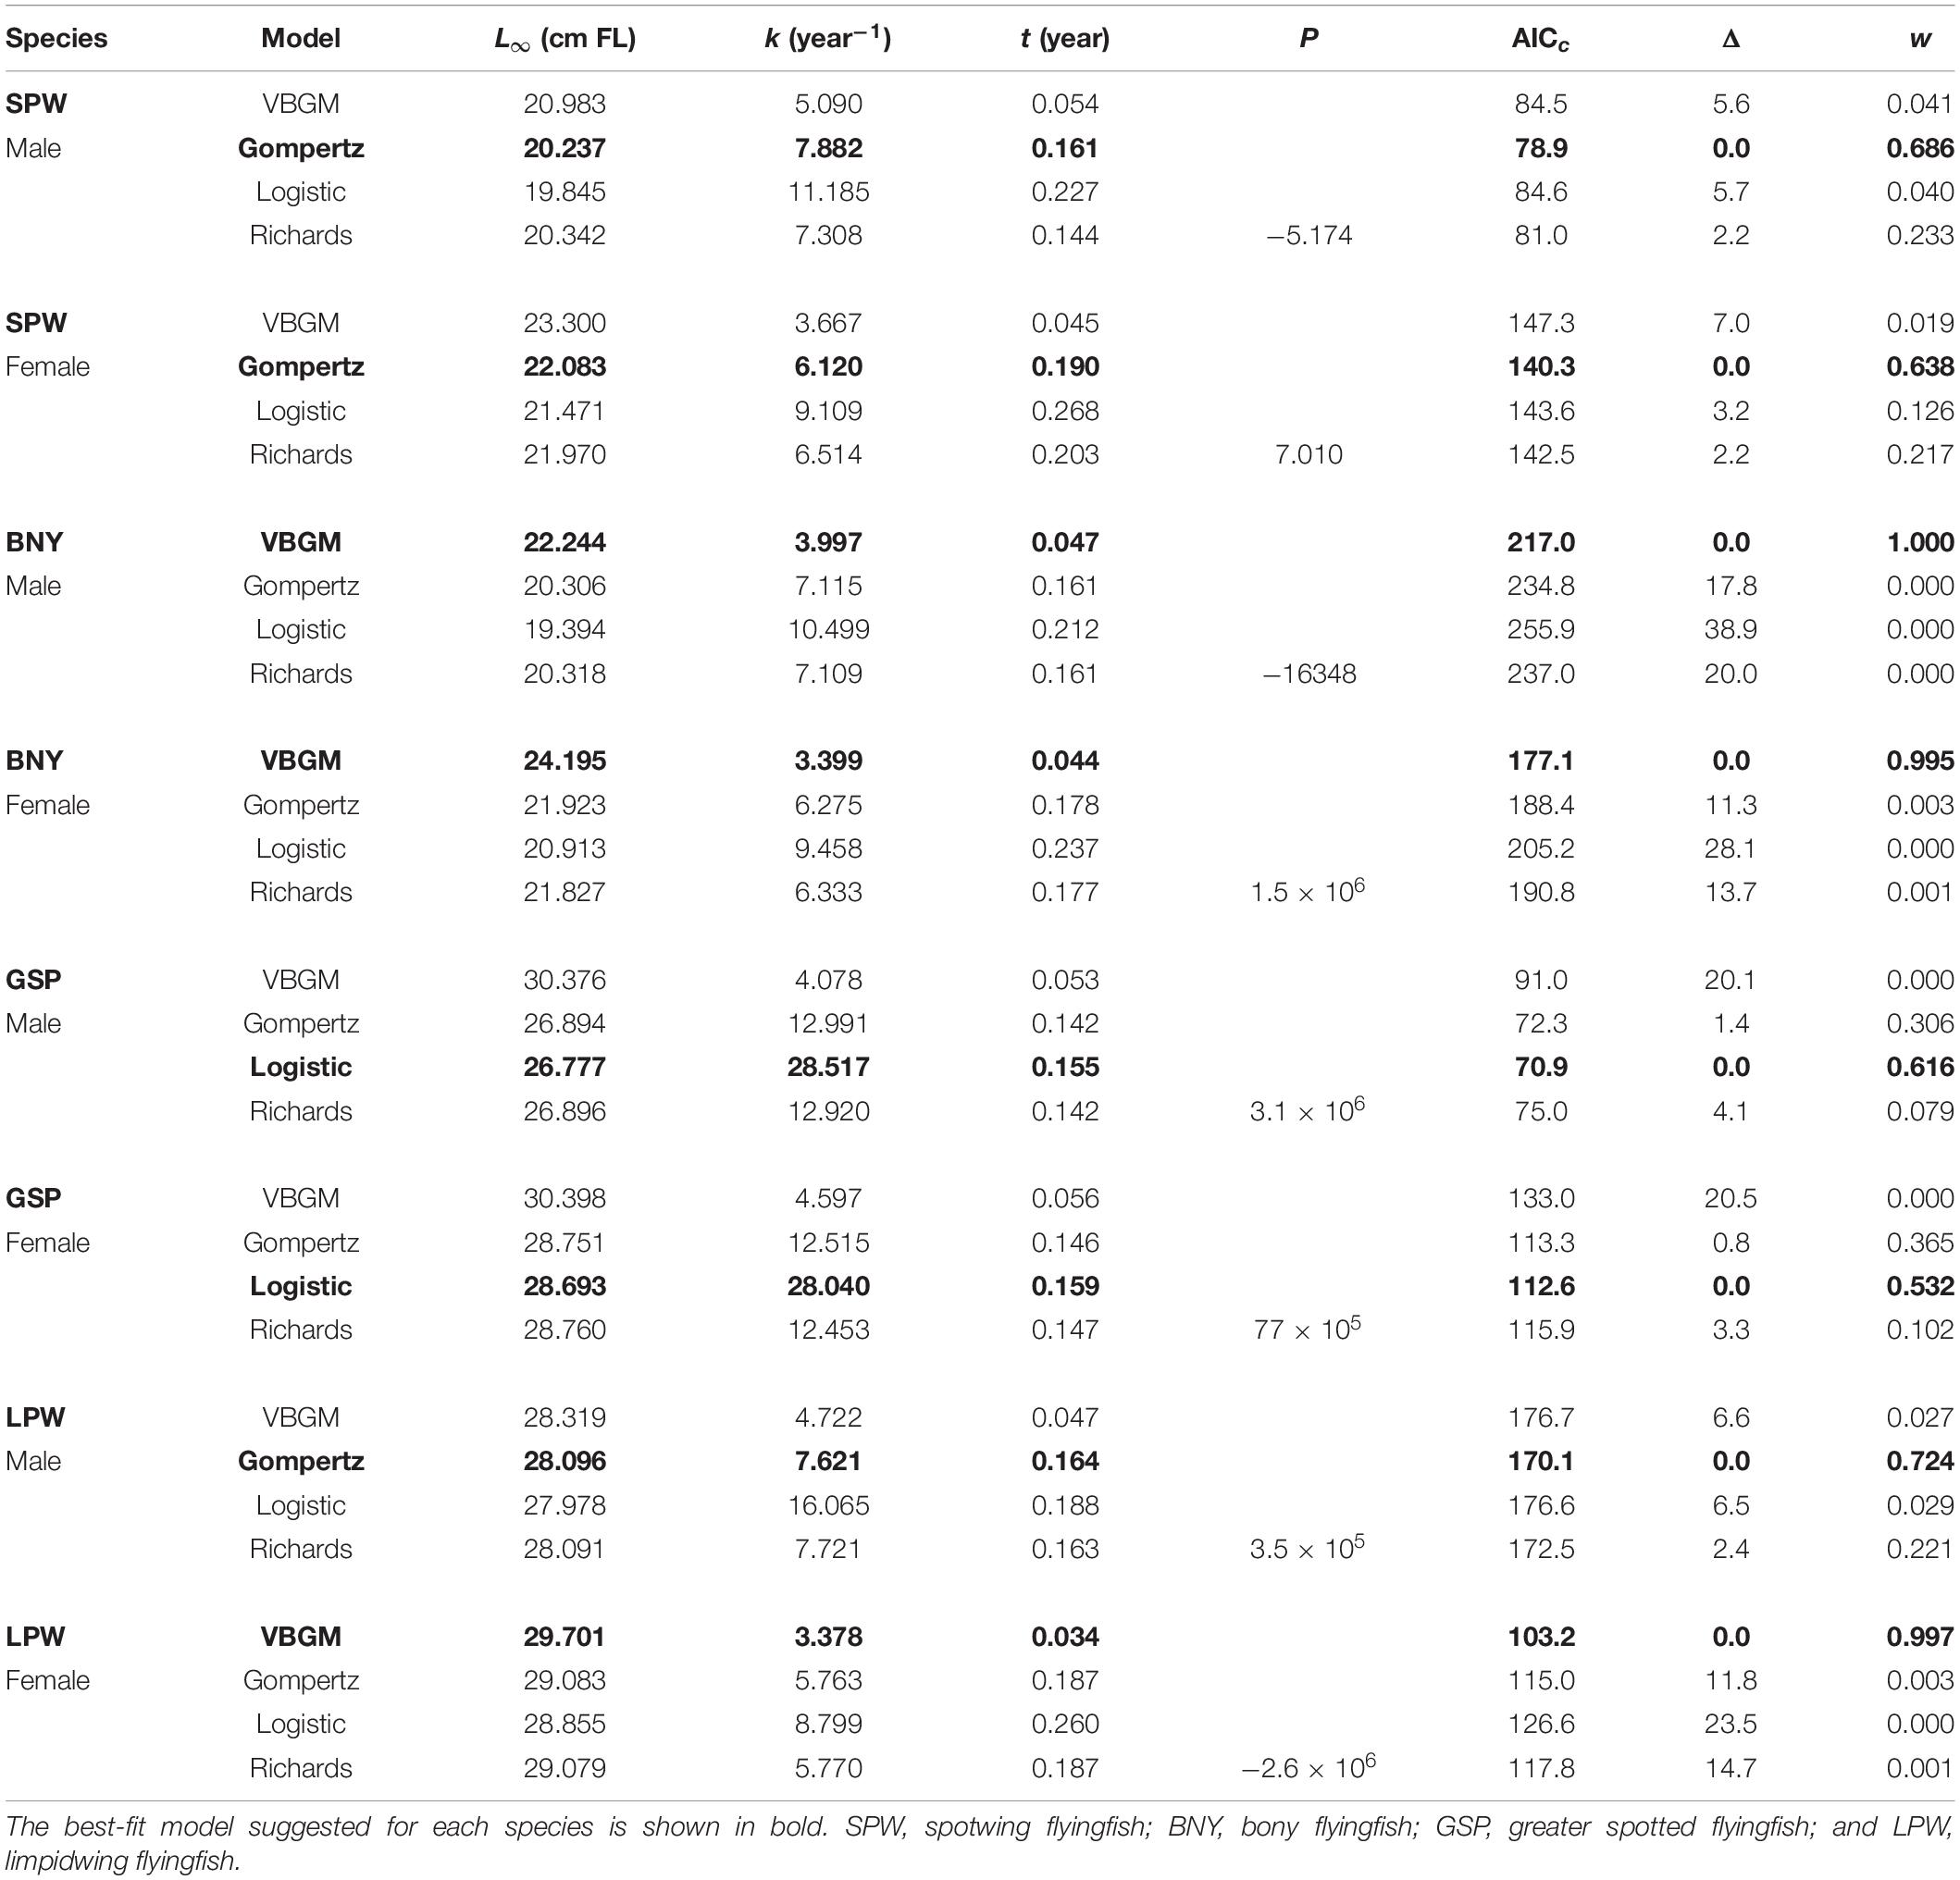
Table 4. Parameter estimates from four candidate growth models, by sex, for the four dominate flyingfishes off Taiwan.
Growth curves of VBGM and the best or second-best models (Gompertz or logistic models) for the four species by sex are shown in Figure 7. In general, female fish grow faster than male. Males have larger k but smaller predicted mean asymptotic length (L∞) than females (Table 4).
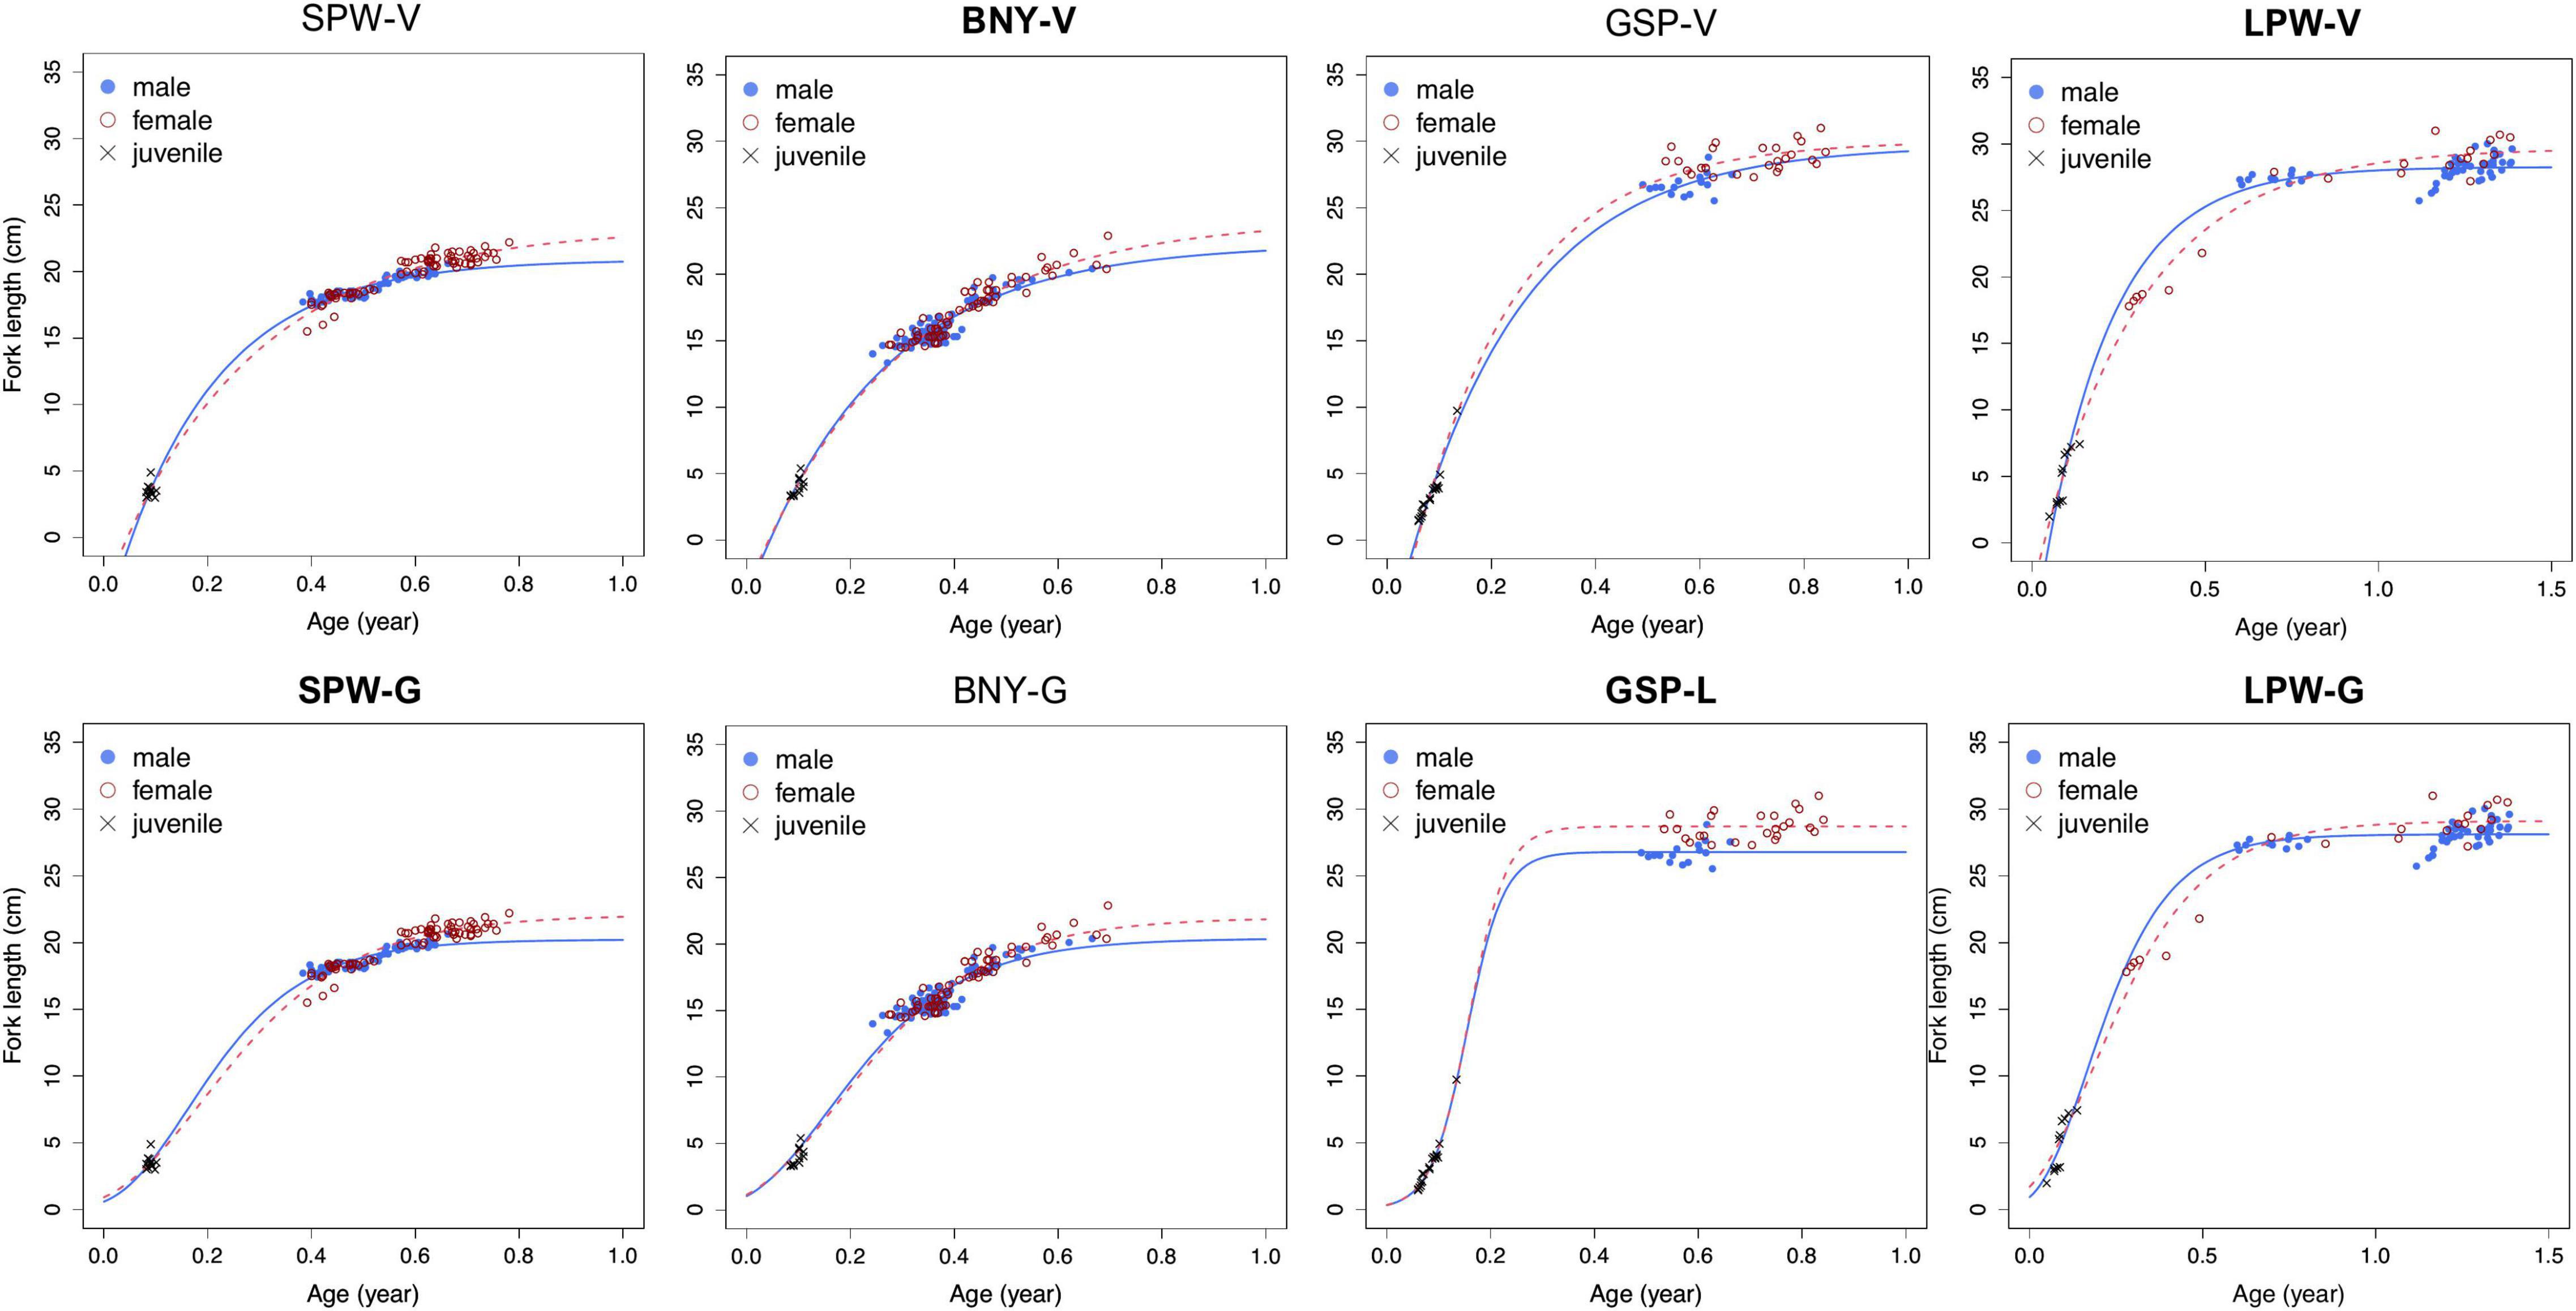
Figure 7. von Bertalanffy growth model (VBGM) (V) and Gompertz (G) or logistic (L) growth curves by sex for spotwing flyingfish (SPW), bony flyingfish (BNY), greater spotted flyingfish (GSP), and limpidwing flyingfish (LPW). The optimal models were labeled in bold for each species. For LPW, data of male fish favored for Gompertz model and female for VBGM. Note here that the same juveniles are included in both male and female curves for each species.
Estimation of Spawning Season
After excluding some samples (∼3%) because they lacked accurate sampling date information, we back-calculated hatch dates for the remaining samples from the optimal model of VBGM (Table 3). Frequencies of back-calculated hatch dates were approximately normally distributed in certain seasons, even though samples were collected in a short period (Figure 8). Most samples were collected between April and July, except for BNY for which some winter samples were collected in 2008–2009. For SPW, the modes of estimated hatch dates were mostly during the winter season of October to January, but modes were also noted during the summer period of June to September. Two modes were also noted for BNY (Figure 8), in summer and winter, although the months of modes varied by year. GSP were collected only during the flyingfish festival period (Chang, 2020) but the hatch dates were distributed in the autumn/winter season of September to December, as well as in the summer/autumn season of July to October. For LPW, the hatch dates mostly overlapped or occurred two months later than the sampling dates, without a clear bimodal distribution. However, the hatch dates back-calculated from otoliths readings still suggested a small spawning season during the winter season of October to January (the small panel in Figure 8).
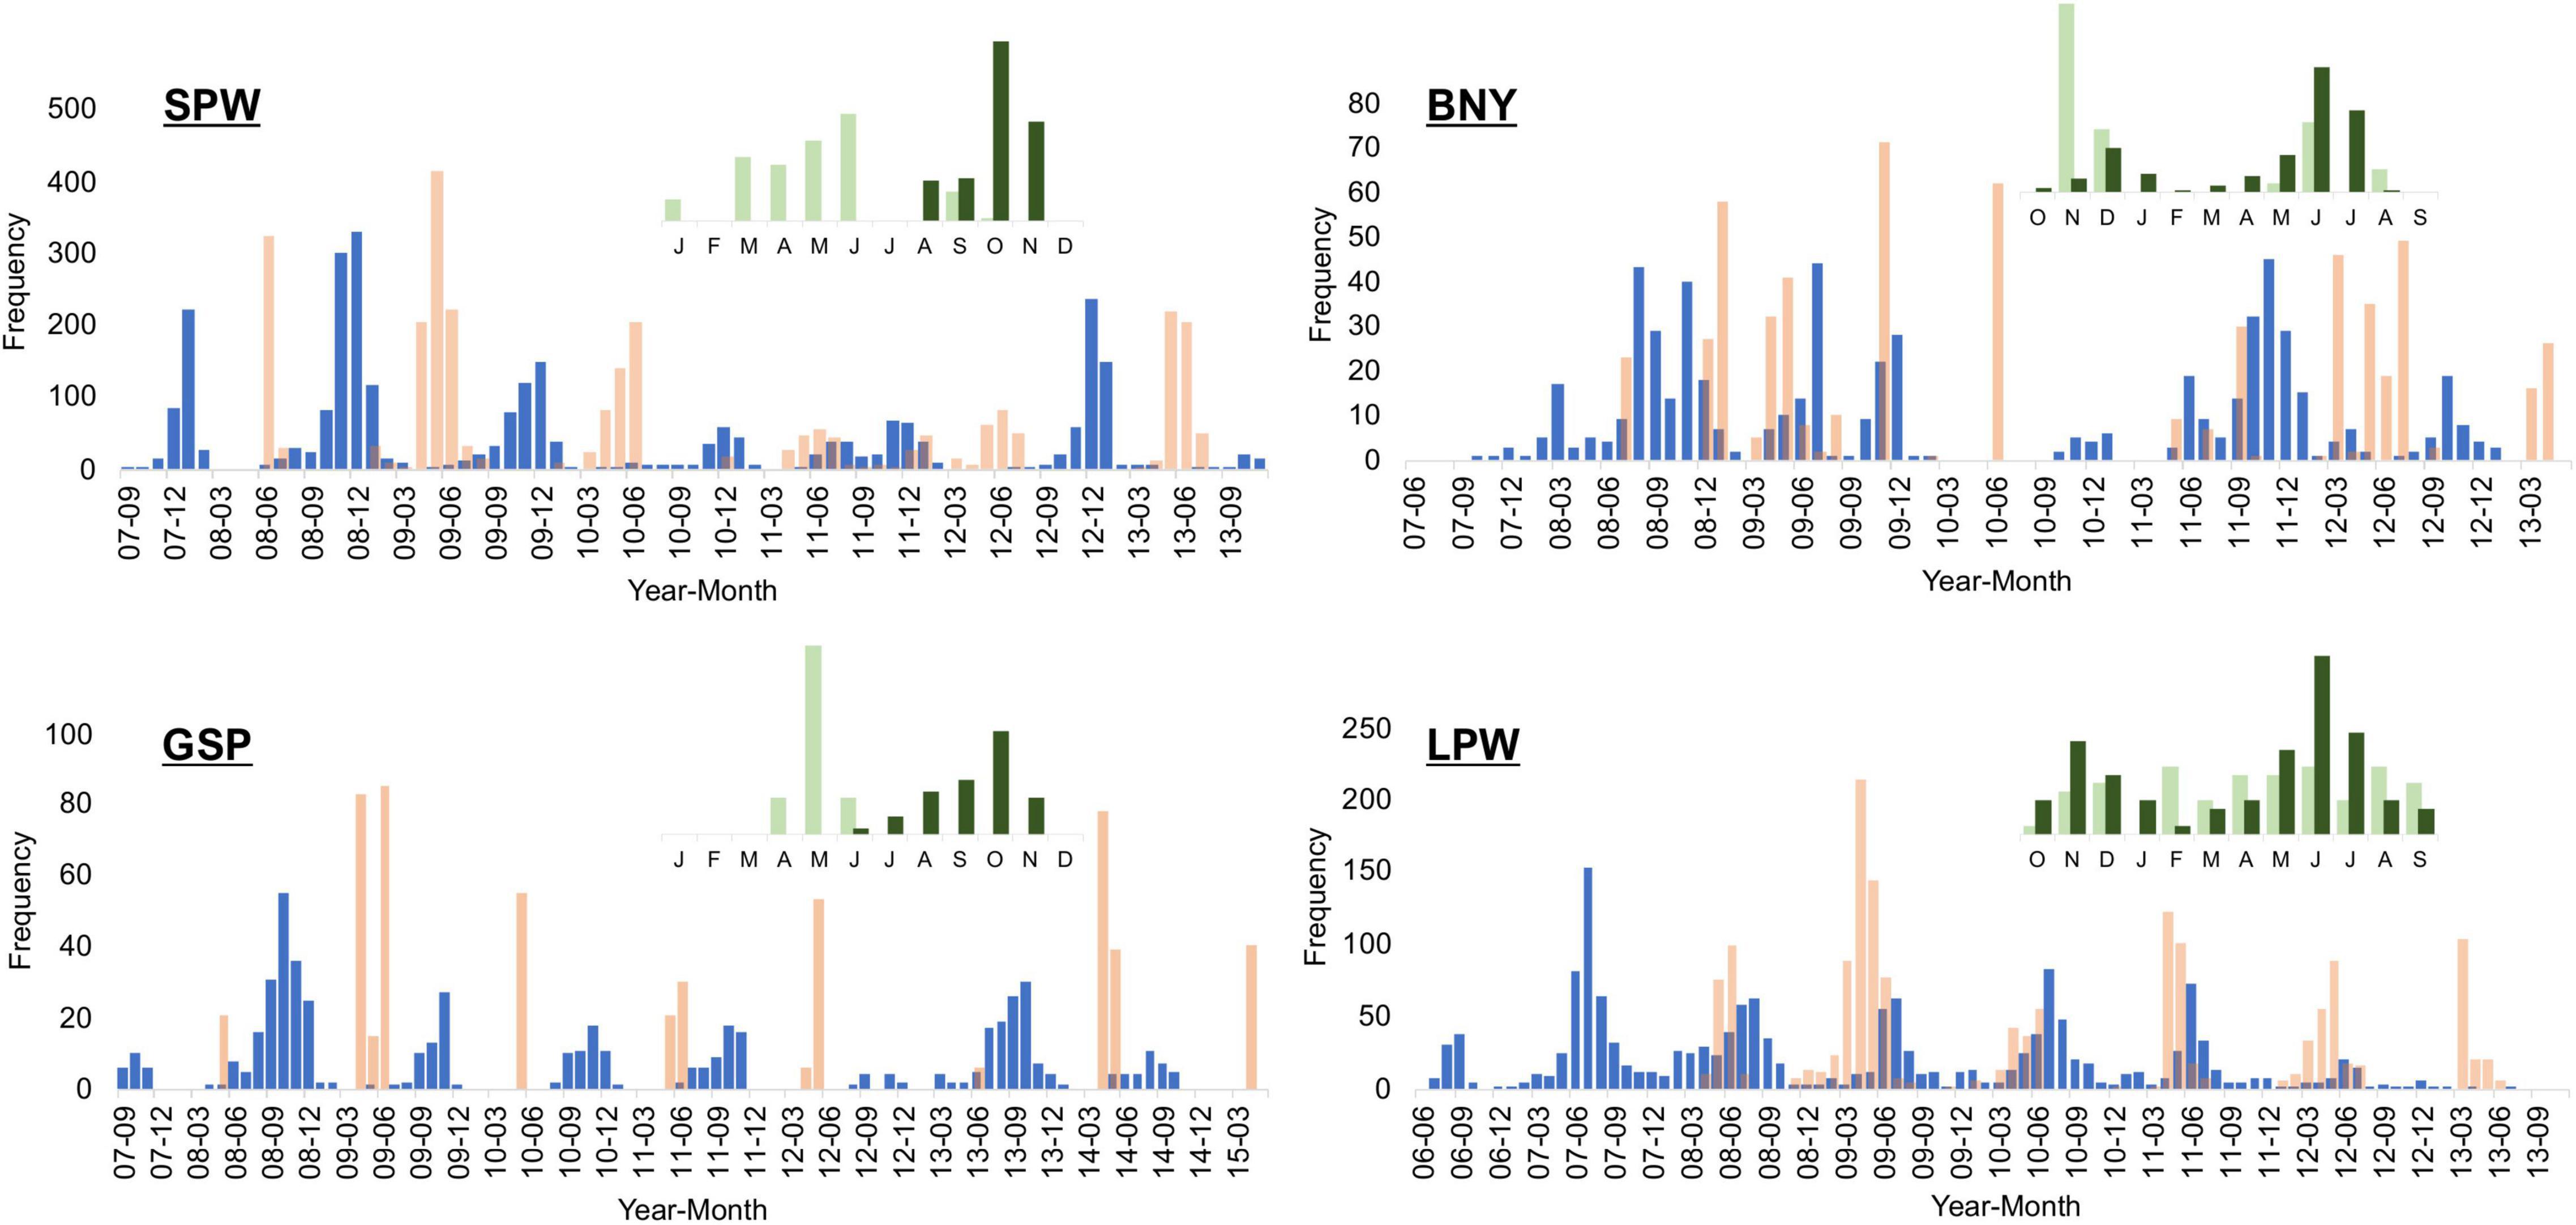
Figure 8. Sample frequency (in pink bar) of the four flyingfishes and the frequency of the back-calculated hatch date (in blue bar) based on VBGM of the species, by year-month. Upper small panels are otolith sample month (light green) and back-calculated hatch month (dark green) from ring readings (starting from October for BNY and LPW).
The otolith back-calculated hatch dates suggest only one spawning season for SPW and GSP, but two seasons for BNY and LPW. This was because otolith samples of SPW and GSP were collected mainly from the spring/summer season of March to June, while the samples of BNY and LPW were throughout the year (small panels in Figure 8). This shows that otolith back-calculation of hatch date might mislead the determination of spawning season, both the number of spawning season(s) and the major months of spawning, if the otolith samples are not collected over the whole year period.
It is worth noting that there were several days between fertilization date and hatching date. Based on the hatching experiments of BNY and GSP, the average period postfertilization before the fish hatched was three days for BNY and seven days for GSP (Lin, 2010; Chang C.W. et al., 2012; Tseng, 2017). The number of days might vary by species, or even by location, but would have little effect on spawning season estimates.
Length-Weight Relationships
The length-weight relationships of the four species are shown in Figure 3. Females generally reached larger sizes than males. R2 for the fits of the length-weight relationships were all higher than 97%. The allometric coefficient b values were generally close to three for all species, with positive allometric growth pattern for GSP (b = 3.011 ± 0.02) and negative allometric growth pattern for the other three species (b = 2.971 ± 0.015 for LPW, 2.908 ± 0.017 for SPW and 2.910 ± 0.021 for BNY). The relationships of female and male have been estimated separately; however, a generalized linear model of logarithmic body weight log(W) against log(L), sex and interaction of log(L) and sex, suggested no significant difference between sex (p > 0.05).
Classification of Global Growth Parameters
Few studies on flyingfish growth could be found in the literature. Many were reported in gray literature and were cited in academic publications without detailed information (e.g., many were cited in Forrestal, 2016 without information on the data sources). Many studies estimated growth for some life history stages, but did not provide final growth parameters (e.g., Yoneyama, 2001; Kono, 2004). In total, 39 growth records were obtained (Table 2), covering 20 flyingfish species, from the eastern and western Atlantic Ocean, the western Pacific Ocean, and the northern Indian Ocean. The studies estimated growth parameters using otoliths (asterisci and lapillus), LFD (mostly), or using an unknown aging method. Those with an unknown aging method were highly likely to have used LFD since this method is traditionally used for growth estimation in the regions studied. Only the four species from this study were aged using daily increments from asterisci.
The scree plot generated by the elbow method suggested that three, four or five clusters could be optimal (Figure 9). The results of classification based on the suggestion from scree plot are shown in Table 5.
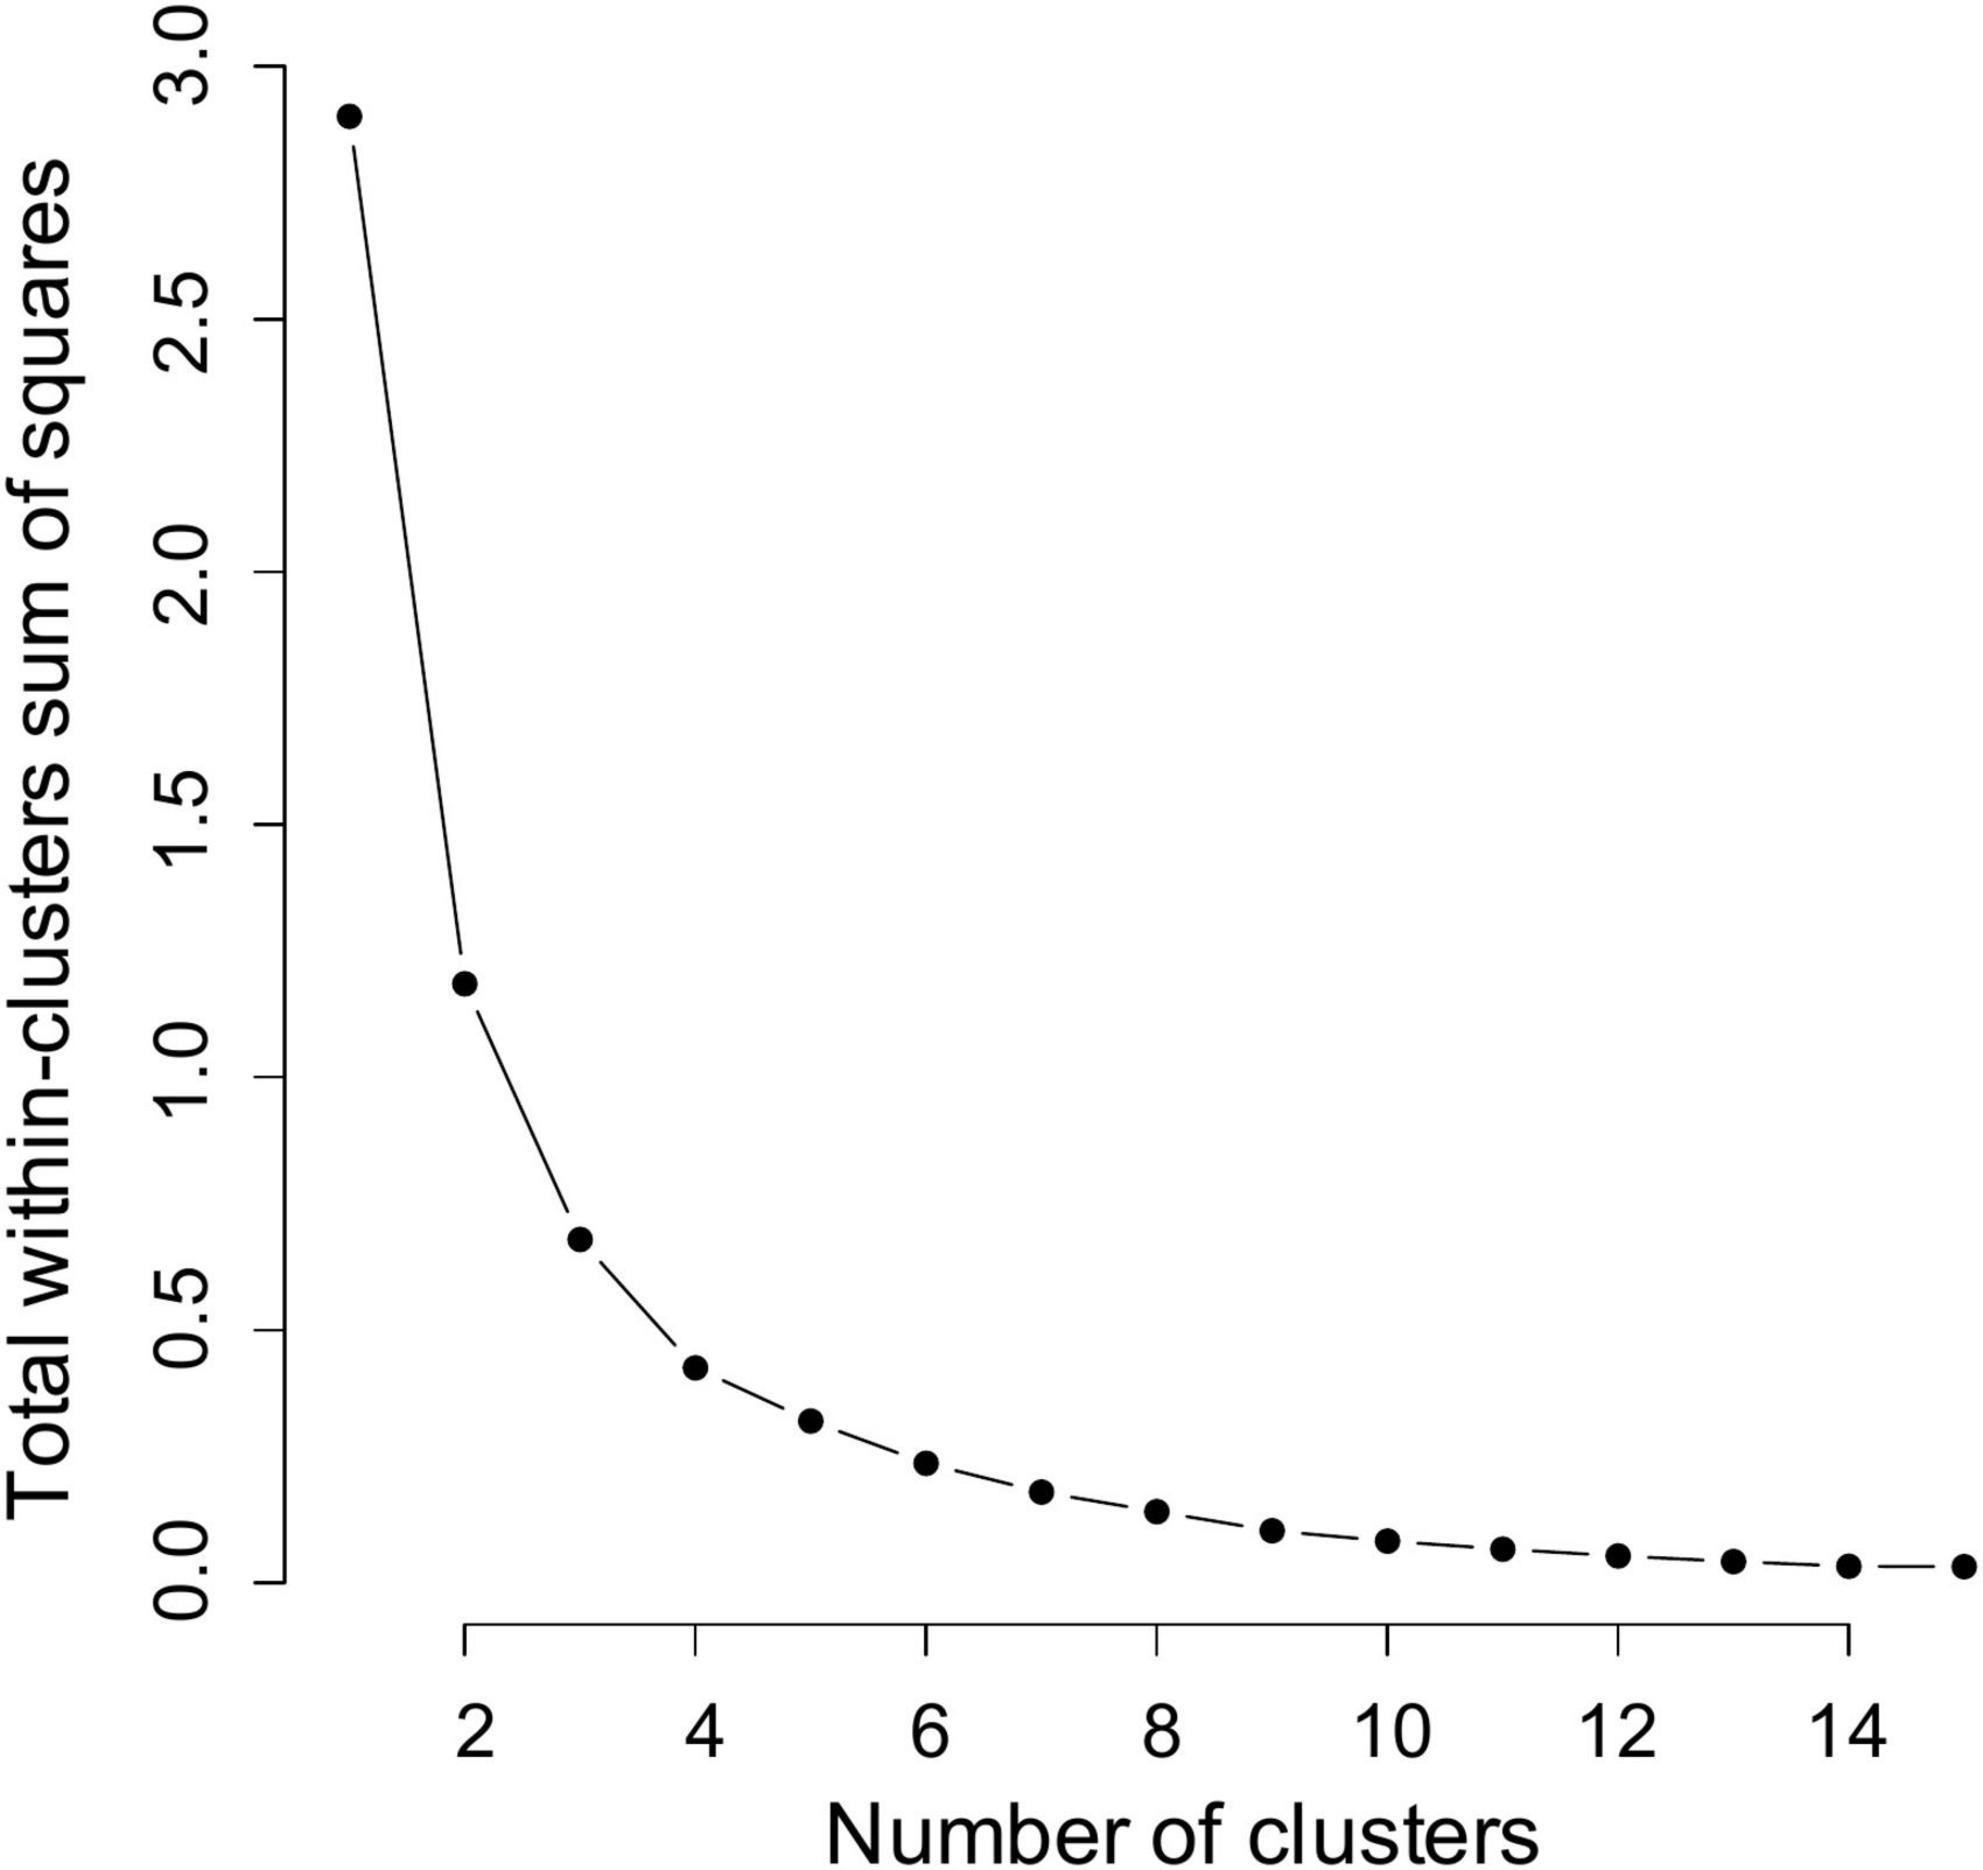
Figure 9. Scree plot (within-clusters sum of squares) of the hierarchical clustering analysis.
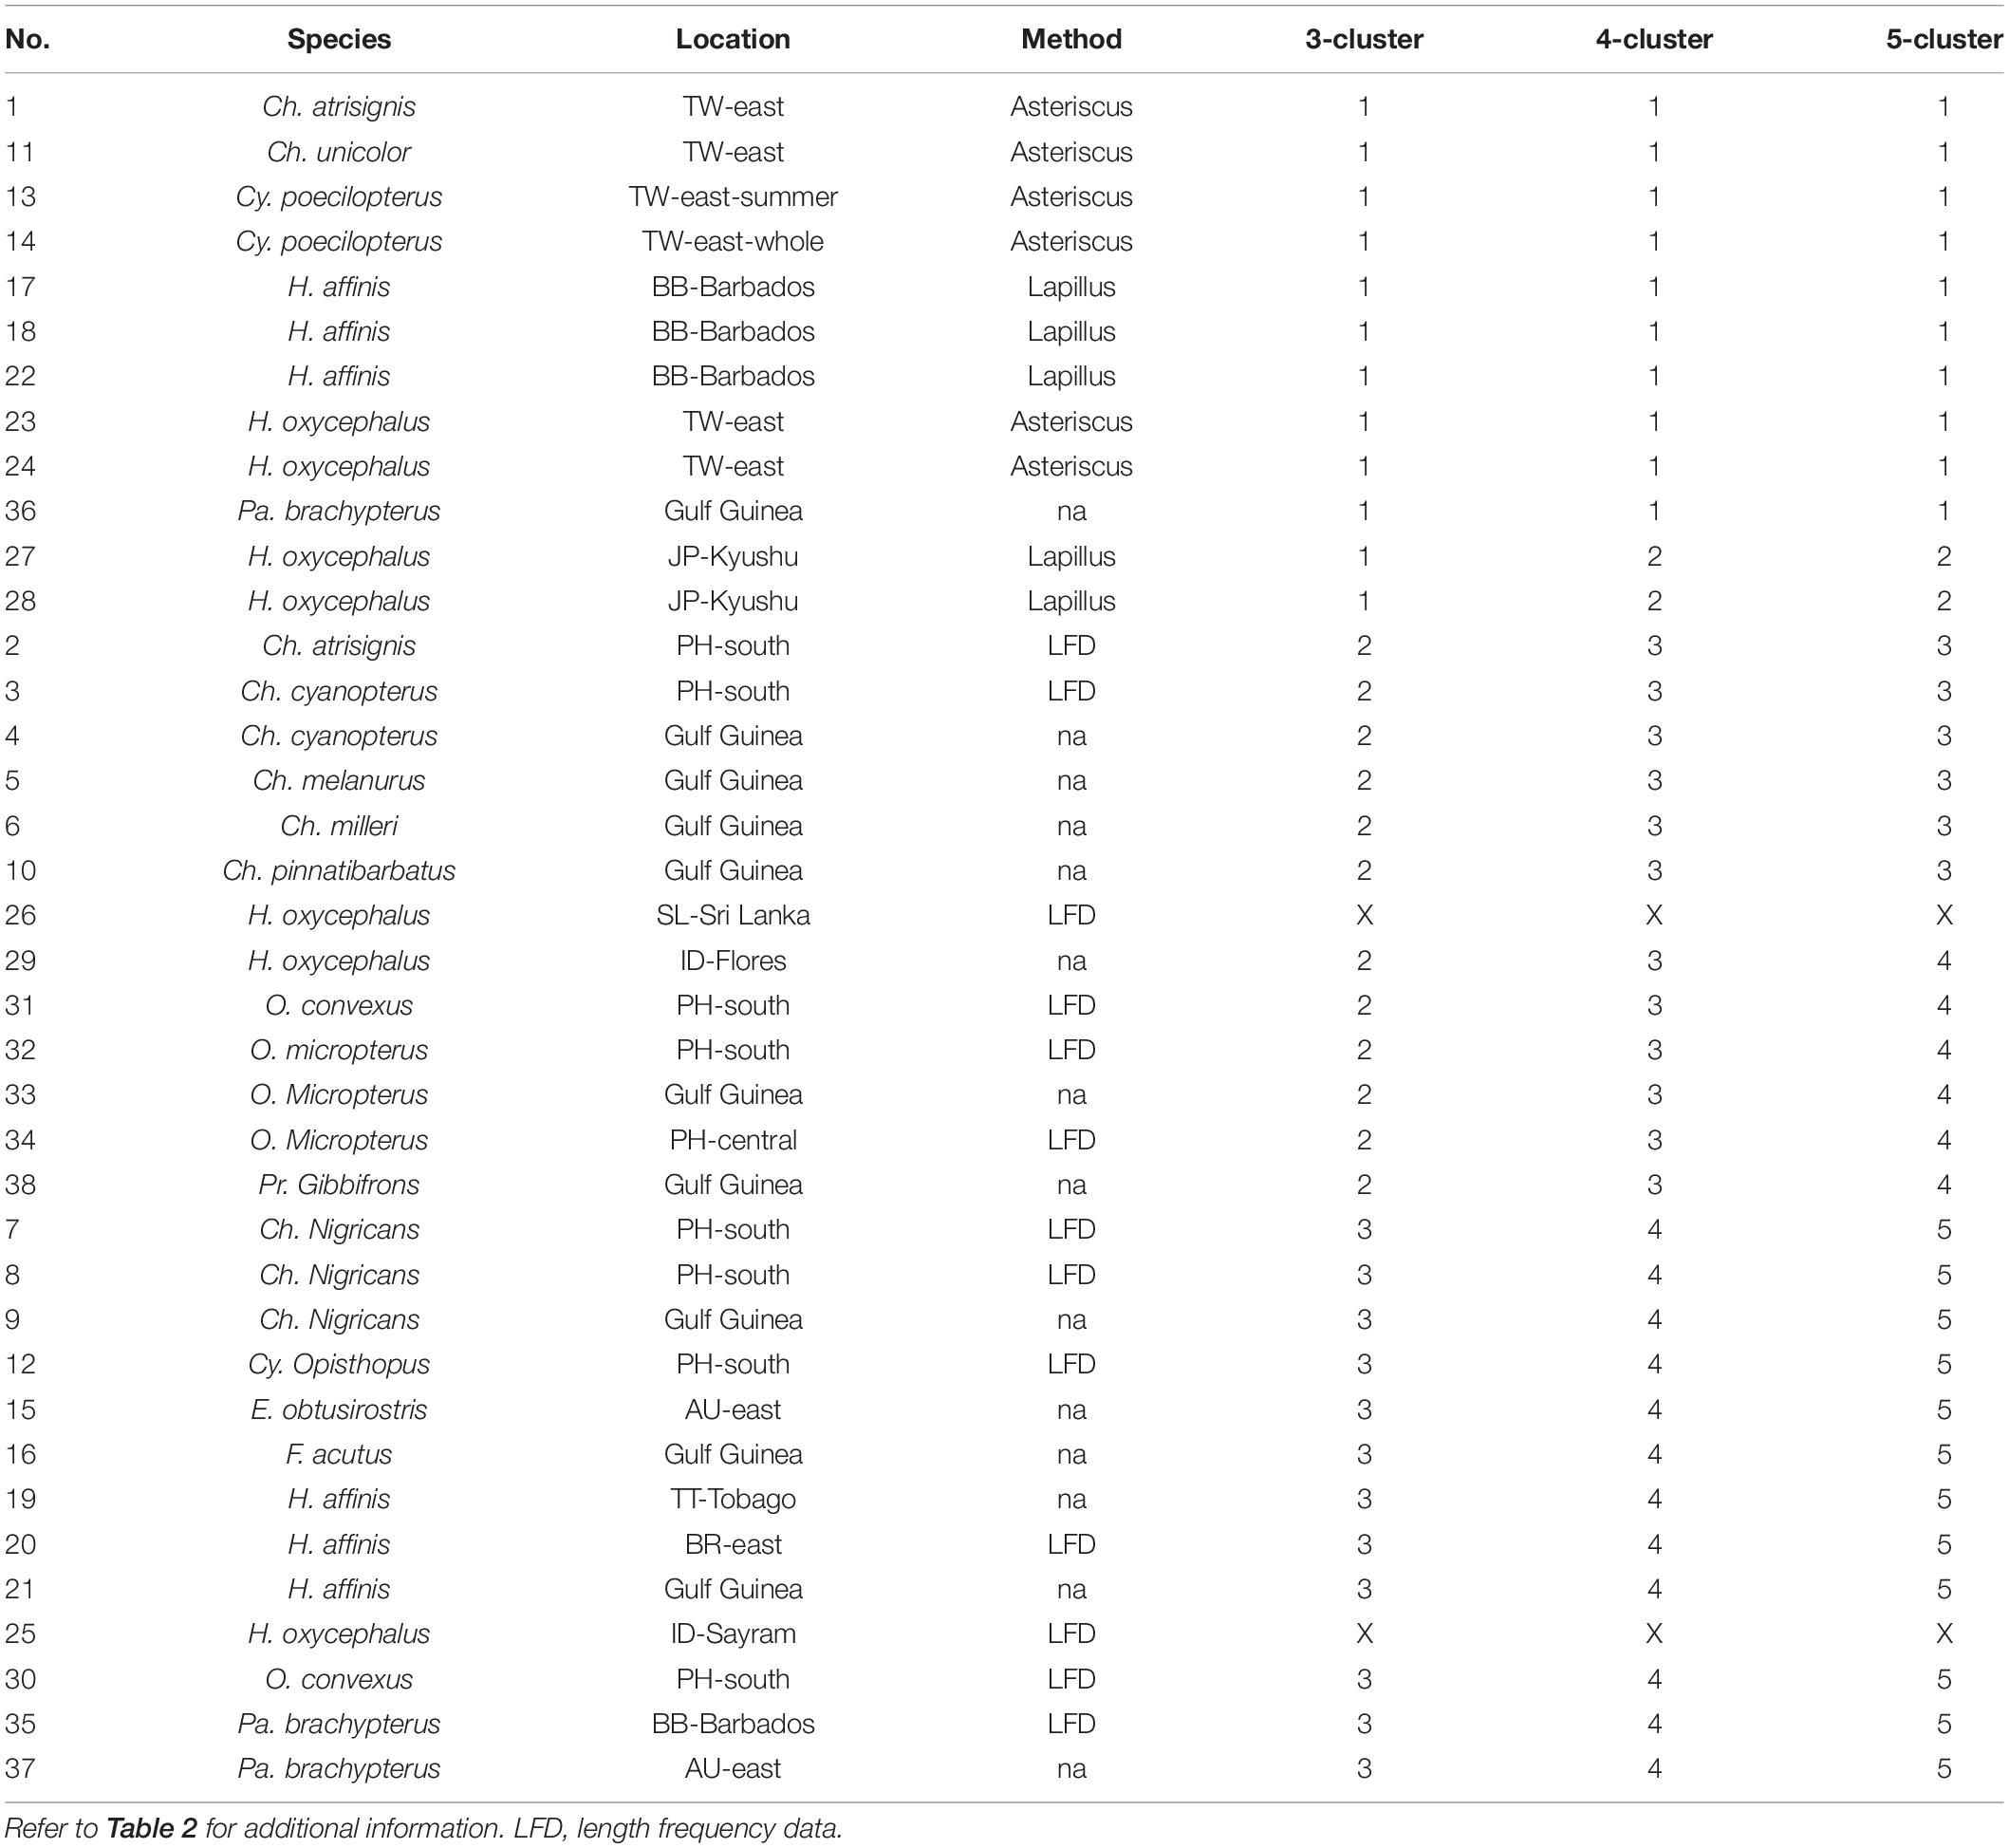
Table 5. Classification results (four clusters and five clusters) by hierarchical clustering analysis on the estimated growth parameters of flyingfishes published globally (in the order of 5-cluster).
The three-cluster scenario suggested that growth estimation based on otolith reading (Cluster 1, except for record number 36 with unknown information of aging method) and (LFD) (Clusters 2 and 3) have substantially different results. Clusters 2 and 3 differed mainly in the species studied, except for record #25 whose samples comprised only adult spawners entangled in FADs. Estimates from this record were marked by the FishBase as “questionable” (see Supplementary Table 1).
The four-cluster scenario separated the Cluster 1 of three-cluster scenario into two clusters. The new Cluster 1 of this scenario studied fishes in tropical waters, while the new Cluster 2 studied fishes from temperate waters north of 33° N (Japan) and mainly on juvenile fish.
The five-cluster scenario further separated the Cluster 2 (three-cluster scenario) or Cluster 3 (four-cluster scenario) into two clusters. The new Cluster 3 of the five-cluster scenario included relatively large flyingfishes of Cheilopogon, except for record #26 which was from gillnet and the data have not been adjusted (Dayaratne, 1998) and was marked by the FishBase as “questionable” (Supplementary Table 1). In contrast, Cluster 4 comprised relatively small flyingfishes.
Discussion
Aging Methodology
Otolith microstructure holds rich information on daily age, size, growth, and development (Campana and Neilson, 1985; Thorrold and Hare, 2002). As noted earlier, there are three methodological issues outlined in Thorrold and Hare (2002) that should be examined in any study to validate the appropriateness of the information extracted from otoliths. We review those issues in relation to aging flyingfish:
(1) Which otoliths to use: The decision on which of the three pairs of otoliths to use is often based on the ease of preparing otolith sections and discriminating increments, as well as the precision and accuracy of otolith increment counts (Thorrold and Hare, 2002). Sagittae of larger flyingfish tend to have an overburden of increased thickness and high opacity, making it difficult to distinguish the daily growth increments either in the sagittal, frontal, or transverse sections of the otolith (Ichimaru, 2008; Chang C.W. et al., 2012). For example, for BNY, growth increments were visible only in mounted sagittae for fish < 30 mm FL and could only be determined in polished sagittae for fish approximately < 65 mm FL (Chang C.W. et al., 2012). Similar difficulties for large fish were observed on lapilli (unless the otolith has undergone a complicated polishing process) (Lin, 2010; Tseng, 2017), but not on asteriscus; growth increments in asterisci were visible for fish of all sizes and could be determined from the mounted, unprocessed otolith (Lin, 2010; Tsai, 2016; Tseng, 2017; Liu, 2019). Moreover, from the BNY hatching experiment, asterisci have been demonstrated to have the highest success rate for daily age estimation (97%), compared to sagittae (73%) and lapilli(92%) (Chang C.W. et al., 2012). The results of the current study also showed that asterisci and lapilli provide very similar age estimates. These observations are contrary to the general understanding that the microstructure of asterisci in fish is usually not clear and preparation for age reading is relatively time-consuming (Campana and Neilson, 1985). Ichimaru (2008) used polished lapilli for aging three flyingfish larvae (i.e., Cy. heterurus, Cy. hiraii, and BNY). After comparing ages from different otoliths, the work also commented that otolith increments were clearly visible in asterisci even in un-polished form, yet that increments in the central area tended to be unclear or discontinuous making it harder to read than other otoliths and that the width of otolith increments were not the same through time. Our preliminary test in aging asterisci suggested that the discrepancy in several readings of the unclear area was always less than 5 days, and this bias could be offset by the convenience of aging asterisci directly without the need for a complex polishing process. Additionally, varying width of increments was probably a natural phenomenon as observed by Ichimaru (2008) for lapilli where the width of increment increases from the larval stage to about 25 days and then decreases to a stable level. In addition, the lapillus is the smallest otolith in flyingfish (Supplementary Figure 1); it was fragile and time-consuming to locate.
Oxenford et al. (1994) also used lapilli of H. affinis as aging material for the reasons that sagittae were more difficult to prepare than other otoliths and asterisci were absent from newly hatched larvae. However, their study also commented that growth increments in lapilli could be reliably counted in fish up to 150 mm FL (juveniles) but were difficult to interpret in larger fish as they were frequently cracked and discontinuous. In this case, the current study estimated the pre-asteriscus days, by comparing increment counts in asterisci and lapilli (discussed below) and added this count to the age estimated from the asterisci to obtain an estimate of total age.
(2) Validation of the periodicity of increment formation: Most analyses of daily otolith increments start with the null hypothesis that increments are deposited daily (Thorrold and Hare, 2002). Chang C.W. et al. (2012) compared the number of microincrements in the three otolith types from BNY (n = 48–61) with the number of days in captivity after hatched and demonstrated that the growth increments were deposited at a constant daily rate in all otolith types. The same conclusion was obtained for GSP in Tseng (2017) through hatching experiment, for Cy. heterurus, Cy. hiraii, and BNY in Japan through hatching experiments (Ichimaru, 2008), and for H. affinis in the eastern Caribbean through larval rearing and adult mark-and-recapture programs (Oxenford et al., 1994). For the other two species of this study (SPW and LPW), while no hatching experiment was conducted for verification, this study assumed that the null hypothesis could be reasonably accepted.
(3) First increment validation: The hatching experiments for BNY and GSP confirmed that the first increments of sagittae and lapilli were deposited at or around hatching, similar to several reef fishes (see citations in Thorrold and Hare, 2002; Fey et al., 2005). The hatching experiments and larval rearing program of Oxenford et al. (1994) and Ichimaru (2008) on four flyingfishes also reached the same conclusion, while Ichimaru (2008) further commented that the first increment of asterisci occurred about 11–15 days after the fish was hatched for Cy. heterurus, Cy. hiraii, and BNY, similar to the conclusion of 10–15 days in Yoneyama (2001). Other hatching experiments suggest that asterisci appeared at about 11.0 days after hatched for BNY (Chang C.W. et al., 2012) and at 12.2 days for GSP (unpublished data). These results supported the conclusion of the current study that the first increments in asterisci were deposited at 10.9 (∼11) days for BNY and 12.2 (∼12) days for GSP after hatching, confirming the use of the asterisci to provide a reliable estimate of age.
Growth Parameter Estimation
A key output of age information is the estimation of growth parameters that are essential biological inputs for stock assessment and understanding a species natural mortality and vulnerability to fishing (Francis and Campana, 2004). Fitting multiple growth models to length at age data without an a priori “true model” is increasingly suggested and practiced (Katsanevakis, 2006; Williams et al., 2012; Carbonara et al., 2020; Liu et al., 2021). Among the various growth models, VBGM has been the most widely used model in fisheries since 1957 (Flinn and Midway, 2021). This model is derived from the allometric relationship between metabolic rate and body weight, describes growth in length that typically exhibits a rapid increase that begins to level off as L∞ is approached, and allows easy comparisons of growth among populations (Quist et al., 2012). The other common growth models, e.g., Gompertz, Logistic, and Richards models, are typically curvilinear with a logistic or sigmoidal pattern: with a growth rate increase in the juvenile (concave) and late-juvenile (sigmoidal) life stages, and a reduction later, often after the onset of maturity (Higgins et al., 2015; Carbonara et al., 2018). Certain growth models may prove to be more likely for certain species or families by better explaining their growth trajectory, and AIC-based multi-model inference approach allows the selection of the optimal model from a set of candidate models (Burnham and Anderson, 2002; Katsanevakis and Maravelias, 2008).
For sex-combined length at age data, VBGM was selected as the optimal model for all the four species. However, for sex-specific data, only three of the eight data series supported VBGM; three supported the Gompertz model, which is used extensively for describing growth at larval and juvenile stages or in fish that present a low initial growth rate (Quist et al., 2012); and the other two supported the logistic model which is similar to the Gompertz model but differs in that regions above and below the inflection of the curve are symmetrical (Quist et al., 2012). Males generally have a lower L∞ and a higher k than females. The changes in model preference with sex-specific versus sex-combined data series may result from the substantially reduced sample size when sexes are separated, and hence the reduction in available age classes (e.g., for male GSP). Model selection depends not only on the species-specific growth pattern but also on the quality of the data set and the amount of available information (e.g., if the range of age classes was too narrow) (Katsanevakis and Maravelias, 2008). Hence, the parameters estimated in this study may change if more age data were available for young fish, especially for SPW and GSP, but our results still provide useful information on maximum age and general growth characteristics.
The use of cultured fish for the juvenile part of the growth curve has both advantages and drawbacks. On the one hand it means that the juvenile part of the growth curve is not affected by the size selectivity of the fishery, which is a common problem in growth curves estimated from fishery data. It is often difficult to obtain unbiased and representative samples from a wild population. Moreover, flyingfish growth rates can vary among cohorts, and with environmental factors such as temperature (Oxenford et al., 1994), such that growth cannot be fully represented by a single curve. The growth patterns and rates of cultured flyingfish may differ from the mean growth rates of fish in the wild, and these growth curves should be supplemented and validated in future with samples of wild-caught juveniles.
One of the main purposes of deriving growth models from length-at-age data is for use in stock assessment (Francis and Campana, 2004; Francis et al., 2016). For flyingfishes, the fishery data usually do not report sex and so a sex-combined growth is considered most suitable for that purpose.
Spawning Season
The “flyingfish season” of Taiwan occurs in April–July, and samples were collected mostly during this period, which is one of the spawning seasons. Our results show there is another spawning season in autumn or wintertime (up to January) for the four species. This bimodality of spawning season coincides with the findings for the congeneric H. affinis in the eastern Caribbean Sea (Oxenford et al., 1994), but is inconsistent with the three species (i.e., Cy. heterurus, Cy. hiraii, and BNY) off the northeastern coast of Japan (Ichimaru, 2008) for which one spawning season is suggested in summer (April–August). However, the samples used to draw this conclusion were larvae hatched from eggs collected in June and July and reared for 50 days, that is, the samples did not include fish potentially spawned in another season. No available published work studying the number of spawning seasons of other flyingfishes have been found in the literature. However, several publications suggest two spawning seasons for fast-growing species such as dolphinfish (Massutí and Morales-Nin, 1997; Alejo-Plata et al., 2011; Chang et al., 2013).
Length–Weight Relationships
Length–weight relationships can be applied to studies on gonadal development, feeding rate and maturity condition (Beyer, 1987) and are commonly used in fisheries science to derive a quantitative measure of biomass for determining the stock status of fishes (Pauly, 1984; Hilborn and Walters, 1992). The a values were at similar level for the four flyingfishes. The allometric coefficients b for three of the flyingfishes of this study were < 3.0, and small flyingfishes exhibited smaller values, suggesting elongation of body shape with increase in length for these species. This is consistent with detailed examination of P. mento mento which concluded that the lengths of the trunk and caudal regions increased disproportionately relative to their depth (Dasilao et al., 2002). Many other flyingfish studies have noted negatively allometric growth (Oliveira et al., 2015; Tuapetel et al., 2017). This type of growth pattern may have evolved as a strategy for flyingfish to maintain the ability to fly at larger sizes (Davenport, 2003).
The magnitude of the allometric coefficient can be affected by many factors such as fishing pressure, food availability in quality and quantity, gonadal maturity, environment conditions (sea temperature) (Froese, 2006). Compared to the flyingfish studies mentioned above, the b values of the four flyingfishes in our study were very close to 3.0. This may be associated with the fact that the fish occurred in Taiwan were almost at spawning stage, especially GSP (b = 3.011) which were mostly actively spawning when caught. Further analyses of LWR by month could be informative about relationships between LWR and the development of gonadal maturity; analyses by year could provide information to determine the condition or relative “wellness” of the fish resource (AL Nahdi et al., 2016).
Implications From Global Estimates Classification
A wide range of growth parameters was noted from global studies on flyingfish growth, with L∞ and k varying in the ranges of 13.5–41.7 cm and 0.69–7.72 y–1, respectively. In addition to differences between species, factors contributing to the variation may include study design (sample size, fish size), laboratory techniques (aging material, preparation method, reading technique), and environmental factors (geographical difference in food availability or exploitation level) (Kimura and Lyons, 1991; Schwenke and Buckel, 2008; Chang et al., 2013; Carbonara et al., 2018).
The growth performance index (Pauly and Munro, 1984) has commonly been used to compare growth estimates of different studies. In consideration of factors potentially contributing to growth variation, cluster analyses (HCA) suggested that aging material may be important, with growth rates from otoliths clearly differing from LFD, even for the same species. Aging material affects estimation of VBGM parameters for dolphinfish based on a global review on growth estimates from otolith, scale and LFD (Chang and Maunder, 2012). Direct age estimation (using otoliths) and LFD analysis resulted in different growth estimates for red mullet, based on a global review on red mullet growth studies, although the results might have interacted with the factor of geographic distribution of the study area (Carbonara et al., 2018). For the present study, however, location did not seem important for the difference in growth performance.
Otolith material is not resorbed during the fish life cycle and can provide rich information about life history (Campana and Thorrold, 2001; Elsdon et al., 2008; Hermann et al., 2016). However, the time required to obtain and prepare otoliths and the difficulty of reading the structure (increments) make this process expensive and potentially inaccurate if undertaken without appropriate validation processes (Campana, 2001; Francis and Campana, 2004). LFD is much easier to collect for commercial fisheries from port sampling programs or even by fishers themselves. However, estimation of growth parameters using LFD is based on monitoring the progression of length frequency modes through time and is most suited for young, fast-growing fish where the length modes of each age group are easily distinguished and spawning occurs over a restricted time period; also, size-selective migration into or out of the study area is not an allowable assumption for this approach (Campana, 2001).
Flyingfish are patchily distributed and in schools at similar life history stages (Oxenford et al., 1995; Chang S.K. et al., 2012), which makes it difficult to sample across age and size classes. Juvenile growth is rapidly (Oxenford et al., 1994) and adult growth flattens. Therefore, samplings programs must cover wide geographic ranges and seasons to obtain sufficient samples to identify representative length frequency modes sufficient for modal progression analysis. Otherwise some modes may not be sampled or may be aggregated with other modes (King, 2007). The four flyingfishes in the present study were not suitable for LFD analysis because most flyingfish species migrate to Taiwan for spawning, so the LFD usually shows a single mode with narrow size range over a short period (Chang S.K. et al., 2012).
Although daily deposition of otolith increments has been validated through hatching or aquaculture experiments for several flyingfish species (see above), the possibility that nondaily deposition can occur in suboptimal or abnormal environmental conditions cannot be excluded (Jones, 1986). A study of reared skipjack and yellowfin tunas noted that fishes fed once daily did not have clear otoliths with countable growth increments; only when the fishes were fed to satiation throughout the day were countable growth increments formed (Uchiyama and Struhsaker, 1981). Consequently, daily increment counts may be less than or equal to the actual number of days after hatching in some cases. Since the final goal for age determination is nearly always to estimate the growth or mortality parameters of a fish population, not to estimate the ages of individual fish (Pauly, 1987; Francis and Campana, 2004); the effect on parameter estimation might need further examination using simulation.
The classification analysis also suggested that growth parameters based on juvenile fish tend to have lower L∞ and higher k (record #27 and #28 of Cluster 2, comparing to #23 and #24 of Cluster 1). Cluster 2 has a close relationship with Cluster 1 because both used otoliths as the aging material. However, Cluster 2 was based only on juvenile data with rapid growth and so has different growth performance. These juvenile-based parameters should only be extrapolated to estimate adult growth with caution, unless the growth model has been validated by independent experiment (Oxenford et al., 1994).
Recommendations for Growth Parameter Estimation for Flyingfishes
Flyingfish resources are important to many coastal countries. Age determination and growth-parameter estimations provide vital information for fishery stock status assessment. Many approaches can be considered for age determination, with different levels of investment of time and money and different levels of precision/accuracy. The goal of the work is not to assign ages to individual fish, but rather to estimate population parameters to be used in stock assessment (Francis and Campana, 2004), and to identify approaches that balance investment and precision/accuracy. With validation of age determination methods and evaluation of multiple growth models, the present study recommends the following advice for coastal countries with flyingfish resources to derive a set of accurate growth parameters.
(1) Otoliths are preferred to LFD for growth determination of flyingfishes. Flyingfishes are generally fast-growing short-lived species. If otolith samples cover all life stages, the sample size can be much smaller than for LFD.
(2) Asterisci should be considered first when using otoliths for age determination. Their size makes them relatively easy to locate, the increments are easily counted, and a daily deposition has been verified. Rearing or hatching experiments, and additional reading of lapilli can be used to confirm the number of pre-asteriscus days. Alternatively, assuming 10–15 days pre-asteriscus should be acceptable.
(3) Apply multi-model inference to the age-length data to select the best-fit growth model. The R code used in the present study is provided for convenience. The VBGM is often suitable, particularly if the data encompasses all life stages and both sexes.
(4) The spawning season can be estimated from both the results of aging and back-calculation from LFD. The potential for more than one spawning season should be considered.
Data Availability Statement
The raw data supporting the conclusions of this article will be made available by the authors, without undue reservation.
Ethics Statement
The animal study was reviewed and approved by Chairman of the Institutional Animal Care and Use Committee (IACUC), National Sun Yat-sen University (IACUC Approval No: 10322).
Author Contributions
S-KC: conceptualization, funding acquisition, data analyses design, manuscript writing and review. T-LY: data preparation and analyses. SH: manuscript review and editing. JF: manuscript review and editing. J-CS: aging experiment design and manuscript review. All authors contributed to the article and approved the submitted version.
Funding
This study was financially supported by the Ministry of Science and Technology, Taiwan under Contract Nos. NSC 99-2611-M-110-017, NSC 100-2611-M-110-016, NSC 101-2611-M-110-013, MOST 104-2611-M-110-001, and MOST 105-2611-M-110-006.
Conflict of Interest
SH was employed by the company National Institute of Water and Atmospheric Research Ltd (NIWA).
The remaining authors declare that the research was conducted in the absence of any commercial or financial relationships that could be construed as a potential conflict of interest.
Publisher’s Note
All claims expressed in this article are solely those of the authors and do not necessarily represent those of their affiliated organizations, or those of the publisher, the editors and the reviewers. Any product that may be evaluated in this article, or claim that may be made by its manufacturer, is not guaranteed or endorsed by the publisher.
Acknowledgments
Aging of most fish samples was conducted by Chia-Ho Tsai (SPW), Chung-Hui Lin (BNY), I-Hsuan Tseng (GSP), and Chih-Cheng Liu (LPW), Masters students in the first author’s laboratory. The first author appreciates their efforts and contributions very much, also is very grateful to Shu-Chiang Huang, Yu-Jun Lu, and Ying-Jhu Chen who helped to review the age data and process new data. Appreciations are extended to Nicholas Ducharme-Barth of the Oceanic Fisheries Programme, SPC, who provided the R code for plotting the length weight relationship (Figure 3), and to Campbell Davies of the CSIRO who provided valuable comments on the first draft. Constructive comments from the two reviewers were very helpful in improving the quality of this article and are much appreciated.
Supplementary Material
The Supplementary Material for this article can be found online at: https://www.frontiersin.org/articles/10.3389/fmars.2021.747382/full#supplementary-material
Supplementary Figure 1 | Images of otoliths (sagitta, lapillus, and asteriscus) of spotwing flyingfish (SPW), bony flyingfish (BNY), greater spotted flyingfish (GSP), and limpidwing flyingfish (LPW). The image of SPW is juvenile fish and the rest are adult fish.
Supplementary Table 1 | Information on the estimates of growth parameters for flyingfishes by studies published globally.
References
AL Nahdi, A., Garcia de Leaniz, C., and King, A. J. (2016). Spatio-temporal variation in length-weight relationships and condition of the ribbonfish Trichiurus lepturus (Linnaeus, 1758): implications for fisheries management. PLoS One 11:e0161989. doi: 10.1371/journal.pone.0161989
Alejo-Plata, C., Díaz-Jaimes, P., and Salgado-Ugarte, I. H. (2011). Sex ratios, size at sexual maturity, and spawning seasonality of dolphinfish (Coryphaena hippurus) captured in the gulf of tehuantepec. Mexico. Fish Res. 110, 207–216. doi: 10.1016/j.fishres.2011.04.008
Aragón-Noriega, E. A., Alcántara-Razo, E., Valenzuela-Quiñónez, W., and Rodríguez-Quiroz, G. (2015). Multi-model inference for growth parameter estimation of the bigeye croaker Micropogonias megalops in the upper gulf of California. Rev. Biol. Mar. Oceanogr. 50, 25–38. doi: 10.4067/S0718-19572015000100003
Beamish, R. J., and Fournier, D. A. (2011). A method for comparing the precision of a set of age determinations. Can. J. Fish. Aquat. Sci. 38, 982–983. doi: 10.1139/f81-132
Beyer, J. E. (1987). On length-weight relationships. part I: computing the mean weights of the fish in a given length class. Fishbyte 5, 11–13.
Blake, A., and Campbell, G. A. (2007). Conflict over flying fish: the dispute between Trinidad & Tobago and Barbados. Mar. Policy 31, 327–335. doi: 10.1016/j.marpol.2006.09.006
Bleeker, P. (1853). Derde bijdrage tot de kennis der ichthyologische fauna van Celebes. Natuurkd. Tijdschr. Ned. Indië 3, 739–782.
Boehmke, B., and Greenwell, B. M. (2019). Hands-On Machine Learning with R. Available online at: https://bradleyboehmke.github.io/HOML/ (accessed June 5, 2021).
Burnham, K. P., and Anderson, D. R. (2002). Model Selection and Multimodel Inference: A Practical Information-Theoretic Approach, 2nd Edn. New York: Springer-Verlag, doi: 10.1007/b97636
Campana, S. E. (2001). Accuracy, precision and quality control in age determination, including a review of the use and abuse of age validation methods. J. Fish Biol. 59, 197–242. doi: 10.1111/j.1095-8649.2001.tb00127.x
Campana, S. E., and Neilson, J. D. (1985). Microstructure of fish otoliths. Can. J. Fish. Aquat. Sci. 42, 1014–1032. doi: 10.1139/f85-127
Campana, S. E., and Thorrold, S. R. (2001). Otoliths, increments, and elements: keys to a comprehensive understanding of fish populations? Can. J. Fish. Aquat. Sci. 58, 30–38. doi: 10.1139/f00-177
Carbonara, P., Bellodi, A., Palmisano, M., Mulas, A., Porcu, C., Zupa, W., et al. (2020). Growth and age validation of the thornback ray (Raja clavata Linnaeus, 1758) in the South Adriatic Sea (central mediterranean). Front. Mar. Sci. 7:586094. doi: 10.3389/fmars.2020.586094
Carbonara, P., Intini, S., Kolitari, J., Joksimović, A., Milone, N., Lembo, G., et al. (2018). A holistic approach to the age validation of Mullus barbatus L., 1758 in the Southern Adriatic sea (central mediterranean). Sci. Rep. 8:13219. doi: 10.1038/s41598-018-30872-1
Chang, C. W., Lin, C.-H., Chen, Y.-S., Chen, M.-H., and Chang, S.-K. (2012). Age validation, growth estimation and cohort dynamics of the bony flying fish Hirundichthys oxycephalus off eastern Taiwan. Aquat. Biol. 15, 251–260. doi: 10.3354/ab00425
Chang, S.-K. (2020). Taboos/norms and modern science, and possible integration for sustainable management of the flyingfish resource of Orchid Island, Taiwan. Sustainability 12:8621. doi: 10.3390/su12208621
Chang, S.-K., and Maunder, M. N. (2012). Aging material matters in the estimation of von bertalanffy growth parameters for dolphinfish (Coryphaena hippurus). Fish. Res. 11, 147–153. doi: 10.1016/j.fishres.2012.01.008
Chang, S. K., Chang, C.-W., and Ame, E. (2012). Species composition and distribution of the dominant flyingfishes (exocoetidae) associated with the kuroshio current, South China sea. Raffles Bull. Zool. 60, 539–550.
Chang, S.-K., DiNardo, G., Farley, J., Brodziak, J., and Yuan, Z.-L. (2013). Possible stock structure of dolphinfish (Coryphaena hippurus) in Taiwan coastal waters and globally based on reviews of growth parameters. Fish. Res. 147, 127–136. doi: 10.1016/j.fishres.2013.05.003
Cumberbatch, J., and Hinds, C. (2013). Barbadian bio-cultural heritage: an analysis of the flying fish. Int. J. Intang. Herit. 8, 117–134.
Dalzell, P. (1993). The fisheries biology of flying fishes (families: exocoetidae and hemiramphidae) from the camotes sea, central Philippines. J. Fish Biol. 43, 19–32. doi: 10.1111/j.1095-8649.1993.tb00407.x
Dasilao, J. J. C., Rossiter, A., and Yamaoka, K. (2002). Adaptive ontogenetic shape change in flyingfish Parexocoetus mento mento. Fish. Sci. 68, 71–76. doi: 10.1046/J.1444-2906.2002.00391.X
Davenport, J. (2003). Allometric constraints on stability and maximum size in flying fishes: implications for their evolution. J. Fish Biol. 62, 455–463. doi: 10.1046/j.1095-8649.2003.00041.x
Dayaratne, P. (1998). Review of resource assessment information on small pelagic fish stocks in coastal marine waters of Sri Lanka. Sri Lanka J. Aquat. Sci. 3, 1–10.
Deane, L. (2008). Age Validation and Growth Rate Determination for Flying Fish Hirundichthys Affinis in the Eastern Caribbean. Ph, D. Thesis. The University of the West Indies.
Eero, M., Hjelm, J., Behrens, J., Buchmann, K., Cardinale, M., Casini, M., et al. (2015). Eastern baltic cod in distress: biological changes and challenges for stock assessment. ICES J. Mar. Sci. 72, 2180–2186. doi: 10.1093/icesjms/fsv109
Elsdon, T. S., Wells, B. K., Campana, S. E., Gillanders, B. M., Jones, C. M., Limburg, K. E., et al. (2008). “Otolith chemistry to describe movements and life -history parameters of fishes: hypotheses, assumptions, limitations and inferences,” in Oceanography and Marine Biology, Vol. 46, eds R. N. Gibson, R. J. A. Atkinson, and J. D. M. Gordon (London: Taylor and Francis), 297–330.
Farley, J., Eveson, P., Krusic-Golub, K., Sanchez, C., Roupsard, F., McKechnie, S., et al. (2017). Age, Growth and Maturity of Bigeye Tuna in the Western and Central Pacific Ocean. WCPFC-SC132017/SA-WP-01.
Fey, D. P., Martin, G. E. B., Morris, J. A., and Hare, J. A. (2005). Effect of type of otolith and preparation technique on age estimation of larval and juvenile spot. Fish. Bull. 103, 544–552.
Flinn, S. A., and Midway, S. R. (2021). Trends in growth modeling in fisheries science. Fishes 6:1. doi: 10.3390/fishes6010001
Forrestal, F. C. (2016). The Impacts of Bycatch from the Atlantic Tropical Tuna Purse Seine Fishery on Ecosystem Structure and Function. Ph. D, Thesis. University of Miami.
Francis, R. C., and Campana, S. E. (2004). Inferring age from otolith measurements: a review and a new approach. Can. J. Fish. Aquat. Sci. 61, 1269–1284. doi: 10.1139/f04-063
Francis, R. I. C. C., Aires-da-Silva, A. M., Maunder, M. N., Schaefer, K. M., and Fuller, D. W. (2016). Estimating fish growth for stock assessments using both age–length and tagging-increment data. Fish. Res. 180, 113–118. doi: 10.1016/j.fishres.2015.06.011
Froese, R. (2006). Cube law, condition factor and weight–length relationships: history, meta-analysis and recommendations. J. Appl. Ichthyol. 22, 241–253. doi: 10.1111/j.1439-0426.2006.00805.x
Froese, R., and Pauly, D. (2019). FishBase: World Wide Web Electronic Publications. Available online at: http://www.fishbase.org (accessed April 2, 2019).
Gayanilo, F. C. J., Sparre, P., and Pauly, D. (2005). FAO-ICLARM Stock Assessment Tools II (FiSAT II). Rome: FAO.
Gompertz, B. (1825). On the nature of the function expressive of the law of human mortality, and on a new mode of determining the value of life contingencies. Philos. Trans. R. Soc. Lond. 115, 513–583. doi: 10.1098/rstl.1825.0026
Hermann, T. W., Stewart, D. J., Limburg, K. E., and Castello, L. (2016). Unravelling the life history of amazonian fishes through otolith microchemistry. R. Soc. Open Sci. 3:160206. doi: 10.1098/rsos.160206
Higgins, R. M., Diogo, H., and Isidro, E. J. (2015). Modelling growth in fish with complex life histories. Rev. Fish Biol. Fish. 25, 449–462. doi: 10.1007/s11160-015-9388-8
Hilborn, R., and Walters, C. J. (1992). Quantitative Fisheries Stock Assessment: Choice, Dynamics and Uncertainty. New York: Chapman and Hall. doi: 10.1007/978-1-4615-3598-0
Hurvich, C. M., and Tsai, C.-L. (1989). Regression and time series model selection in small samples. Biometrika 76, 297–307. doi: 10.1093/biomet/76.2.297
Hüssy, K., Radtke, K., Plikshs, M., Oeberst, R., Baranova, T., Krumme, U., et al. (2016). Challenging ICES age estimation protocols: lessons learned from the eastern baltic cod stock. ICES J. Mar. Sci. 73, 2138–2149. doi: 10.1093/icesjms/fsw107
Ichimaru, T. (2008). The life cycle of three species of flyingfish in the north waters of kyusyu and the recruitment of young flyingfish to the fishing ground. Bull. Nagasaki Prefect. Inst. Fish. 33, 7–110.
Ichimaru, T., Kazushi, K., and Nakazono, A. (2005). “Microstructure of ring pattern and growth on the otolith of Hirundichthys oxycephalus (translated from Japanese),” in Proceedings of the 2005 Japanese Society of Fisheries Science Conference.
Jenkins, O. P. (1903). Report on collections of fishes made in the Hawaiian Islands, with descriptions of new species. Bull. U.S. Fish Comm. 22, 417–511.
Jones, C. (1986). Determining age of larval fish with the otolith increment technique. Fish. Bull. 84, 91–102.
Kassambara, A. (2017). ). Practical Guide to Cluster Analysis in R: Unsupervised Machine Learning. France: STHDA-Statistical Tools for High-Throughput Data Analysis.
Katsanevakis, S. (2006). Modelling fish growth: model selection, multi-model inference and model selection uncertainty. Fish. Res. 81, 229–235. doi: 10.1016/j.fishres.2006.07.002
Katsanevakis, S., and Maravelias, C. D. (2008). Modelling fish growth: multi-model inference as a better alternative to a priori using von Bertalanffy equation. Fish Fish. 9, 178–187. doi: 10.1111/j.1467-2979.2008.00279.x
Kimura, D. K., and Lyons, J. J. (1991). Between-reader bias and variability in the age-determination process. Fish. Bull. 89, 53–60.
King, M. (2007). Fisheries Biology, Assessment and Management, 2nd Edn. Oxford: Blackwell Publishing. doi: 10.1002/9781118688038
Kono, M. (2004). Fisheries biology of flyingfish (Cypselurus hiraii Abe). Bull. Yamaguchi Prefect. Fish. Res. Cent. 2, 27–76.
Lavapie-Gonzales, F., Ganaden, S. R., and Gayanilo, F. C. (1997). Some Population Parameters of Commercially-Important Fishes in the Philippines. Quezon City: Bureau of Fisheries and Aquatic Resources.
Lessa, R. P., Nóbrega, M. F., and Bezerra, J. L. Jr. (2004). Dinâmica de Populações E Avaliação de Estoques dos Recursos Pesqueiros da Região Nordeste. Brazil: DIMAR, Departamento de Pesca - Universidade Federal Rural de Pernambuco.
Lin, C.-H. (2010). Age and Growth of Bony Flyingfish (Hirundichthys oxycephalus) off the Eastern Taiwan Through Otolith Examination and Its Implication in Fisheries Management. Ph, D. Thesis. Kaohsiung, Taiwan: National Sun Yat-sen University.
Liu, C.-C. (2019). Growth, Reproduction and Management Implication of Cheilopogon Unicolor off the Eastern Taiwan. Tseng, I.-H. (2017). Ph. D, Thesis. Kaohsiung, Taiwan: National Sun Yat-sen University.
Liu, K.-M., Wu, C.-B., Joung, S.-J., Tsai, W.-P., and Su, K.-Y. (2021). Multi-model approach on growth estimation and association with life history trait for elasmobranchs. Front. Mar. Sci. 8:591692. doi: 10.3389/fmars.2021.591692
Liu, T.-M., and Chang, S.-K. (2019). Changes in local knowledge and its impacts on ecological resources management: the case of flyingfish culture of the Tao in Taiwan. Mar. Policy 103, 74–83. doi: 10.1016/j.marpol.2019.02.031
Mancini, P. L., and Bugoni, L. (2014). Resources partitioning by seabirds and their relationship with other consumers at and around a small tropical archipelago. ICES J. Mar. Sci. 71, 2599–2607. doi: 10.1093/icesjms/fsu105
Massutí, E., and Morales-Nin, B. (1997). Reproductive biology of dolphin-fish (Coryphaena hippurus L.) off the island of Majorca (western Mediterranean). Fish. Res. 30, 57–65. doi: 10.1016/s0165-7836(96)00562-0
Masuda, H., Amaoka, K., Araga, C., Uyeno, T., and Yoshino, T. (1984). The Fishes of the Japanese Archipelago. Tokyo: Tokai University Press.
Maunder, M. N., and Piner, K. R. (2015). Contemporary fisheries stock assessment: many issues still remain. ICES J. Mar. Sci. 72, 7–18. doi: 10.1093/icesjms/fsu015
Maunder, M. N., Crone, P. R., Punt, A. E., Valero, J. L., and Semmens, B. X. (2016). Growth: theory, estimation, and application in fishery stock assessment models. Fish. Res. 180, 1–3. doi: 10.1016/j.fishres.2016.03.005
McKechnie, S., Pilling, G., and Hampton, J. (2017). “Stock assessment of bigeye tuna in the western and central pacific ocean,” in Proceeding of The 13th Regular Session of the Scientific Committee, (Cook Islands).
Oliveira, M. R., Carvalho, M. M., Silva, N. B., Yamamoto, M. E., and Chellappa, S. (2015). Reproductive aspects of the flyingfish, hirundichthys affinis from the northeastern coastal waters of Brazil. Braz. J. Biol. Rev. Brasleira Biol. 75, 198–207. doi: 10.1590/1519-6984.11513
Oxenford, H. A., and Hunte, W. (1999). Feeding habits of the dolphinfish (Coryphaena hippurus) in the eastern caribbean. Sci. Mar. 63, 303–315. doi: 10.3989/scimar.1999.63n3-4317
Oxenford, H. A., Hunte, W., Deane, R., and Campana, S. E. (1994). Otolith age validation and growth-rate variation in flyingfish (Hirundichthys affinis) from the eastern caribbean. Mar. Biol. 118, 585–592. doi: 10.1007/BF00347505
Oxenford, H. A., Mahon, R., and Hunte, W. (1993). The Eastern Caribbean Flyingfish Project. St Vincent: Organisation of Eastern Caribbean States (OECS), OECD Fishery Report 9.
Oxenford, H. A., Mahon, R., and Hunte, W. (1995). Distribution and relative abundance of flyingfish (exocoetidae) in the eastern caribbean. I. Adults. Mar. Ecol. Prog. Ser. 117, 11–23. doi: 10.3354/meps117011
Pauly, D. (1979). Gill Size and Temperature as Governing Factors in Fish Growth: A Generalization of von Bertalanffy’s Growth Formula. Germany: Instiute fuer Meereskunde 63, Kiel University.
Pauly, D. (1984). Some Simple Methods for the Assessment of Tropical Fish Stocks. FAO Fisheries Technical Paper. Rome: FAO.
Pauly, D. (1987). “Application of information on age and growth of fish to fishery management,” in Age and growth of fish, eds R. C. Summerfelt and G. E. Hall (Ames, Iowa: Iowa State University Press).
Pauly, D., and Munro, J. L. (1984). Once more on the comparison of growth in fish and invertebrates. Fishbyte 2:21. doi: 10.1186/1471-2458-7-199
Potts, A. C., Thomas, A. D., and Nichols, E. (2003). An economic and social assessment of the flying fish (pelagic) fishery of Tobago, Trinidad and Toba. Proc. Gulf Caribb. Fish. Inst. 54, 635–649.
Quist, M. C., Pegg, M. A., and Devries, D. R. (2012). “Age and Growth,” in Fisheries Techniques, 3rd Edn, Chap. 15, eds A. V. Zale, D. L. Parrish, and T. M. Sutton (American Fisheries Society), 677–731. doi: 10.47886/9781934874295.ch15
R-Development Core Team (2018). R: A Language and Environment for Statistical Computing. Vienna, Austria: R Foundation for Statistical Computing.
Rehatta, B. M., Kamal, M. M., Boer, M., Fahrudin, A., and Zairion, and Ninef, J. S. R. (2021). Growth, mortality, recruitment pattern, and exploitation rate of shared stock flying fish (exocoetidae) at border area of Indonesia and timor leste in ombai strait. IOP Conf. Ser. Earth Environ. Sci. 744:012062. doi: 10.1088/1755-1315/744/1/012062
Richards, F. J. (1959). A flexible growth function for empirical use. J. Exp. Bot. 10, 290–301. doi: 10.1093/jxb/10.2.290
Ricker, W. E. (1975). Computation and interpretation of biological statistics of fish populations. Bull. Fish. Res. Board Can. 191, 1–382.
Roff, D. A. (1980). A motion for the retirement of the von Bertalanffy function. Can. J. Fish. Aquat. Sci. 37, 127–129. doi: 10.1139/f80-016
Samlasingh, S., and Pandchee, E. (1992). Preliminary Stock Assessment for the Flyingfish (Hirundichthys affinis) Fishery of Tobago. Port of Spain: FAO/UNDP.
Schwenke, K. L., and Buckel, J. A. (2008). Age, growth, and reproduction of dolphinfish (Coryphaena hippurus) caught off the coast of North Carolina. Fish. Bull. 106, 82–92.
Sparre, P., and Venema, S. C. (1992). Introduction to Tropical Fish Stock Assessment. Part. 1. Manual. FAO Fish. Tech. Paper No. 306.1. Rome: FAO.
Tan, P.-N., Steinbach, M., and Kumar, V. (2006). “Cluster analysis: basic concepts and algorithms,” in Introduction to Data Mining, Chap. 8, (Boston: Pearson Addison Wesley), 487–568.
Then, A. Y., Hoenig, J. M., Hall, N. G., and Hewitt, D. A. (2015). Evaluating the predictive performance of empirical estimators of natural mortality rate using information on over 200 fish species. ICES J. Mar. Sci. 72, 82–92. doi: 10.1093/icesjms/fsu136
Thorrold, S. R., and Hare, J. A. (2002). “Otolith applications in reef fish ecology,” in Coral Reef Fishes: Dynamics and Diversity in a Complex Ecosystem, ed. P. F. Sale (San Diego, CA: Academic Press), 243–264. doi: 10.1016/b978-012615185-5/50015-3
Tsai, C. (2016). Fishery Biology of Spotwing Flyingfish (Cypselurus poecilopterus) in the Kuroshio off Taiwan and its Management Implication. Ph. D, Thesis. Kaohsiung, Taiwan: National Sun Yat-sen University.
Tseng, I.-H. (2017). Growth, Reproduction and Management Implication of Cheilopogon Atrisignis in the Orchid Island off Eastern Taiwan. Ph. D, Thesis. Kaohsiung, Taiwan: National Sun Yat-sen University.
Tuapetel, F., Nessa, N., Ali, S. A., Sudirman, S., Hutubessy, B. G., and Mosse, J. W. (2017). Morphometric relationship, growth, and condition factor of flyingfish, Hirundicththys oxycephalus during spawning season. Conf. Ser. Earth Environ. Sci. 89:012001. doi: 10.1088/1755-1315/89/1/012001
Uchiyama, J. H., and Struhsaker, P. (1981). Age and growth of skipjack tuna, Katsuwonus pelamis, and yellowfin tuna, Thunnus albacares, as indicated by daily growth increments of sagittae. Fish. Bull. 79, 151–162.
Valenciennes, A. (1847). “Exocoetus,” in Histoire Naturelle des Poissons, Vol. 19, eds G. Cuvier and A. Valenciennes (Paris: P. Bertrand), 544. doi: 10.5962/bhl.title.7339
Ward, J. H. (1963). Hierarchical grouping to optimize an objective function. J. Am. Stat. Assoc. 58, 236–244. doi: 10.1080/01621459.1963.10500845
Williams, A. J., Farley, J. H., Hoyle, S. D., Davies, C. R., and Nicol, S. J. (2012). Spatial and sex-specific variation in growth of albacore tuna (Thunnus alalunga) across the South Pacific Ocean. PLoS One 7:e39318. doi: 10.1371/journal.pone.0039318
Yacapin, N. C. (1991). Growth, mortality and recruitment of short-wing flying fish Oxyphorhamphus micropterus in Bohol sea, Philippines. Fishbyte 9, 10–12.
Yoneyama, S. (2001). Examining Age of Coastal Flying Fish by Otolith. Tokyo: Tokyo Suisan Shikenjo Shuyo Seikashu Heisei 12 Nendo, 3–4.
Young, J., Lansdell, Hobday, A., Dambacher, Cooper, Griffiths, S., et al. (2009). Determining Ecosystem Effects of Longline Fishing in the Eastern Tuna and Billfish Fishery. Australia: CSIRO Marine and Atmospheric Research.
Keywords: otolith, von Bertalanffy, Gompertz, spawning season, length-weight relationship, aging issues, growth performance
Citation: Chang S-K, Yuan T-L, Hoyle SD, Farley JH and Shiao J-C (2022) Growth Parameters and Spawning Season Estimation of Four Important Flyingfishes in the Kuroshio Current Off Taiwan and Implications From Comparisons With Global Studies. Front. Mar. Sci. 8:747382. doi: 10.3389/fmars.2021.747382
Received: 26 July 2021; Accepted: 29 November 2021;
Published: 04 January 2022.
Edited by:
Jie Cao, North Carolina State University, United StatesReviewed by:
Paul Andrew Hamer, Pacific Community (SPC), New CaledoniaCahide Çiǧdem Yıǧın, Çanakkale Onsekiz Mart University, Turkey
Copyright © 2022 Chang, Yuan, Hoyle, Farley and Shiao. This is an open-access article distributed under the terms of the Creative Commons Attribution License (CC BY). The use, distribution or reproduction in other forums is permitted, provided the original author(s) and the copyright owner(s) are credited and that the original publication in this journal is cited, in accordance with accepted academic practice. No use, distribution or reproduction is permitted which does not comply with these terms.
*Correspondence: Shui-Kai Chang, skchang@faculty.nsysu.edu.tw